| Param | Original file | Final file |
|---|---|---|
| Filename | modeM0/AS1A14_083T06_9000006558_56632cztM0_level2.fits | modeM0/AS1A14_083T06_9000006558_56632cztM0_level2_quad_clean.evt |
| Size (bytes) | 1,150,462,080 | 256,855,680 |
| Size | 1.1 GB | 245.0 MB |
| Events in quadrant A | 10,150,822 | 1,647,620 |
| Events in quadrant B | 9,301,341 | 1,783,355 |
| Events in quadrant C | 10,479,308 | 1,595,644 |
| Events in quadrant D | 11,213,346 | 1,467,628 |
| Mode SS | |||
|---|---|---|---|
| Quadrant | BADHDUFLAG | Total packets | Discarded packets |
| A | 0 | 380 | 0 |
| B | 0 | 380 | 0 |
| C | 0 | 380 | 0 |
| D | 0 | 380 | 0 |
| Mode M9 | |||
|---|---|---|---|
| Quadrant | BADHDUFLAG | Total packets | Discarded packets |
| A | 0 | 11 | 0 |
| B | 0 | 11 | 0 |
| C | 0 | 11 | 0 |
| D | 0 | 11 | 0 |
| Mode M0 | |||
|---|---|---|---|
| Quadrant | BADHDUFLAG | Total packets | Discarded packets |
| A | 0 | 43652 | 3 |
| B | 0 | 40905 | 3 |
| C | 0 | 44445 | 3 |
| D | 0 | 46381 | 3 |
| Quadrant | Total seconds | Saturated seconds | Saturation percentage |
|---|---|---|---|
| A | 18602 | 747 | 4.015697% |
| B | 18602 | 627 | 3.370605% |
| C | 18602 | 623 | 3.349102% |
| D | 18603 | 866 | 4.655163% |
Noise dominated data is calculated using 1-second bins in cleaned event files. If a bin has >2000 counts, and if more than 50% of those come from <1% of pixels, then it is considered to be noise-dominated and hence unusable.
| Quadrant | # 1 sec bins | Bins with >0 counts | Bins with >2000 counts | High rate bins dominated by noise | Noise dominated (total time) | Noise dominated (detector-on time) | Marked lightcurve |
|---|---|---|---|---|---|---|---|
| A | 19812 | 18607 | 291 | 291 | 1.47% | 1.56% | 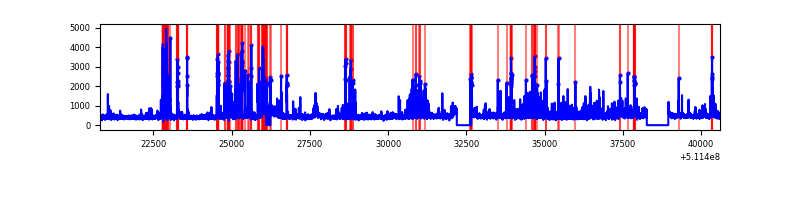 |
| B | 19812 | 18607 | 141 | 141 | 0.71% | 0.76% | 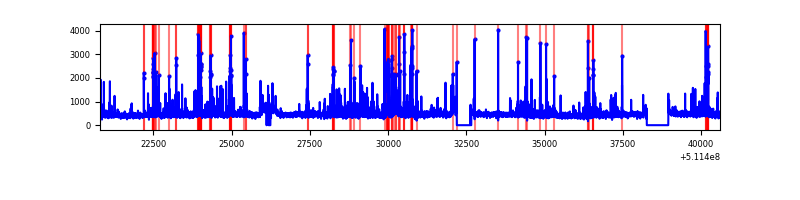 |
| C | 19812 | 18605 | 273 | 273 | 1.38% | 1.47% | 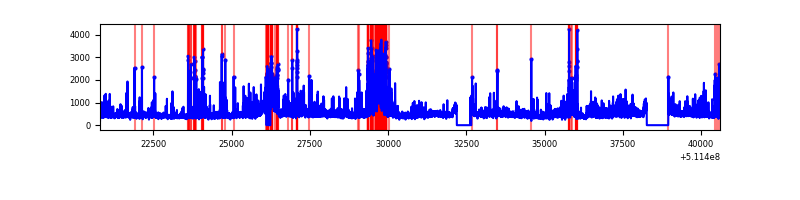 |
| D | 19813 | 18608 | 475 | 475 | 2.40% | 2.55% | 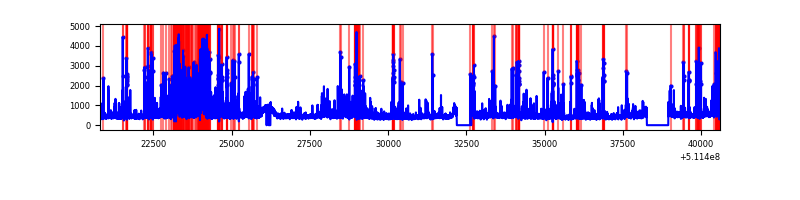 |
Top three noisy pixels from each quadrant. If the there are fewer than three noisy pixels in the level2.evt file, extra rows are filled as -1
| Pixel properties | Quadrant properties | ||||||
|---|---|---|---|---|---|---|---|
| Quadrant | DetID | PixID | Counts | Sigma | Mean | Median | Sigma |
| A | 6 | 179 | 547099 | 1132.41 | 1969 | 1923 | 481.4 |
| A | 10 | 251 | 520924 | 1078.04 | 1969 | 1923 | 481.4 |
| A | 3 | 78 | 294449 | 607.62 | 1969 | 1923 | 481.4 |
| B | 0 | 231 | 329323 | 778.31 | 1971 | 1896 | 420.7 |
| B | 10 | 247 | 328600 | 776.59 | 1971 | 1896 | 420.7 |
| B | 8 | 128 | 197899 | 465.91 | 1971 | 1896 | 420.7 |
| C | 15 | 230 | 1382441 | 2657.28 | 1923 | 1905 | 519.5 |
| C | 1 | 16 | 638841 | 1225.99 | 1923 | 1905 | 519.5 |
| C | 12 | 252 | 248234 | 474.14 | 1923 | 1905 | 519.5 |
| D | 6 | 239 | 1185056 | 2199.22 | 1921 | 1833 | 538.0 |
| D | 2 | 249 | 667114 | 1236.54 | 1921 | 1833 | 538.0 |
| D | 7 | 96 | 622560 | 1153.73 | 1921 | 1833 | 538.0 |
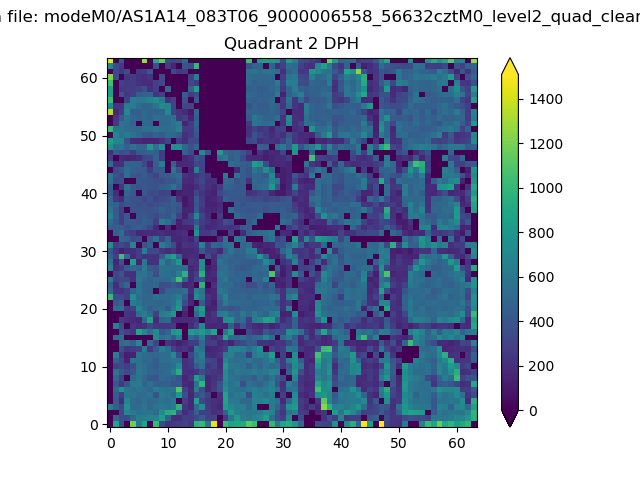
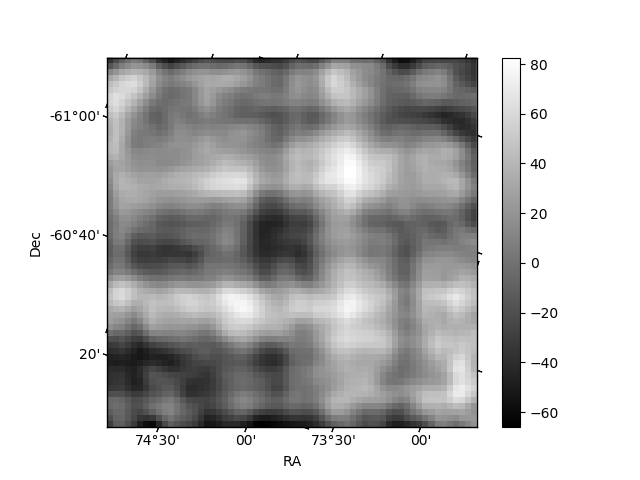
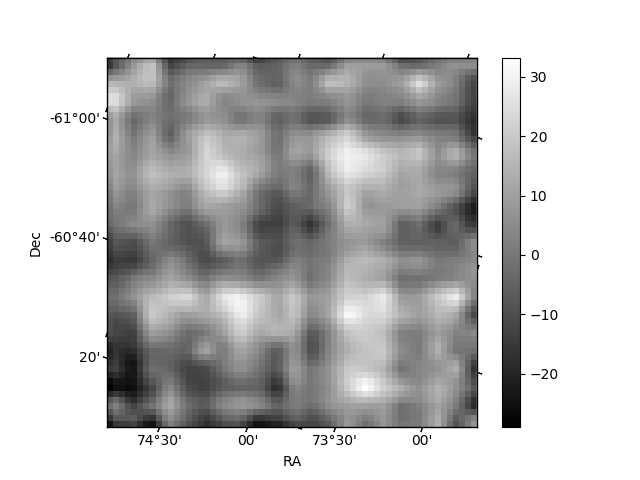
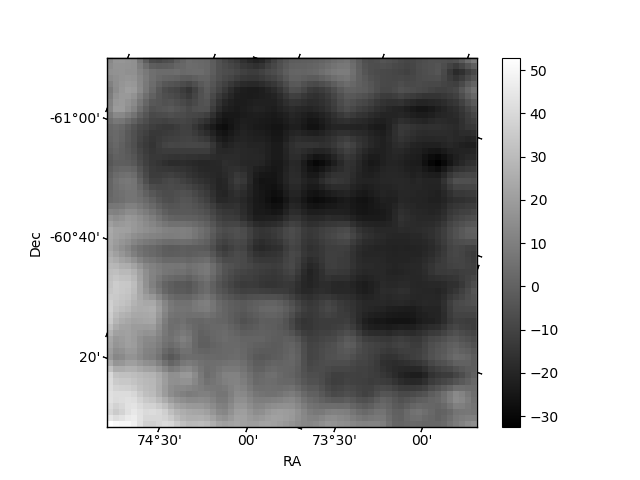
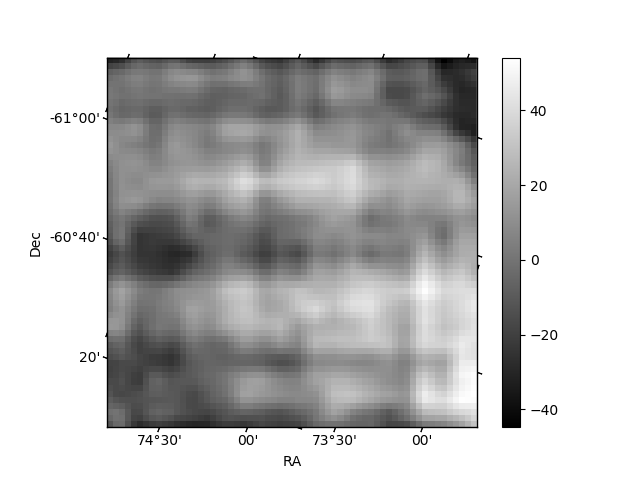
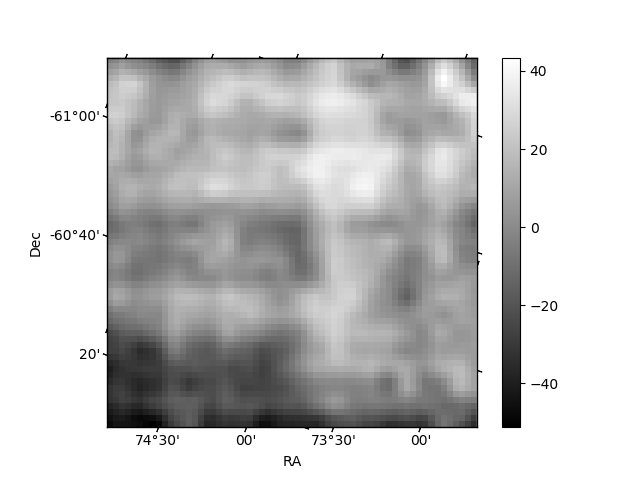
Histogram calculated using DETX and DETY for each event in the final _common_clean file
| Quadrant A | 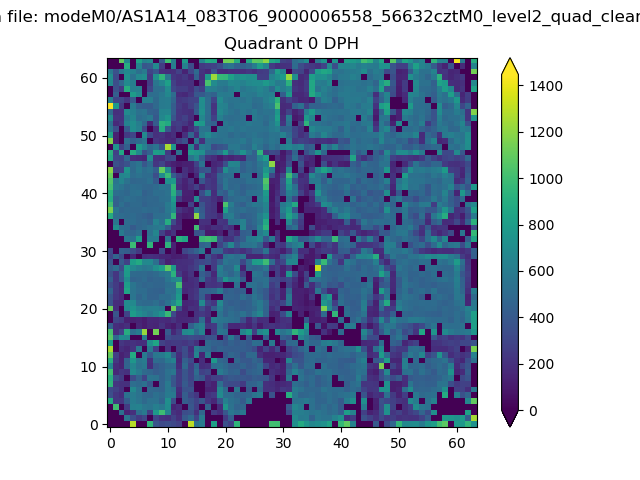 |
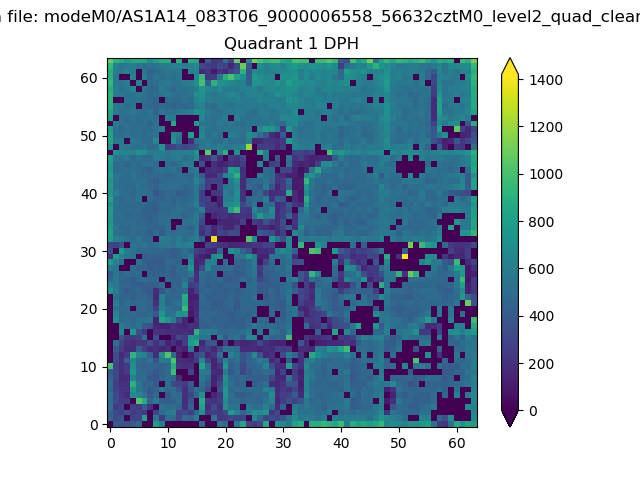 |
Quadrant B |
|---|---|---|---|
| Quadrant D | 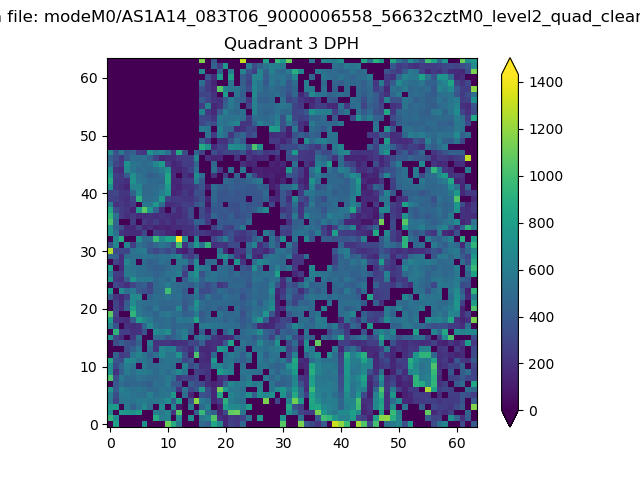 |
 |
Quadrant C |
| Plot type | Count rate plots | Images |
|---|---|---|
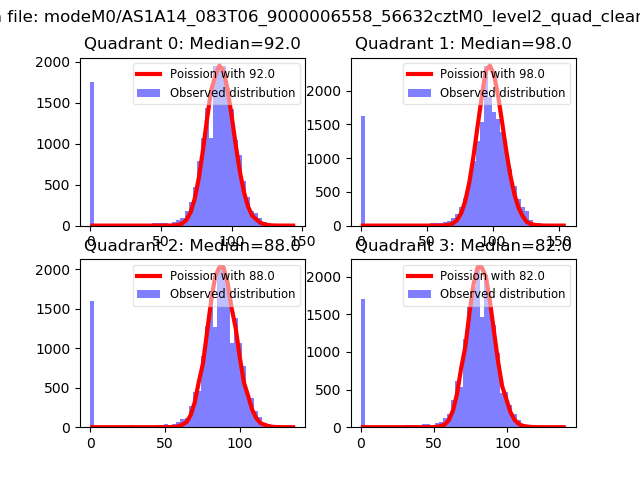
| Comparison with Poisson distribution Blue bars denote a histogram of data divided into 1 sec bins. Red curve is a Poisson curve with rate = median count rate of data. |
 |
 |
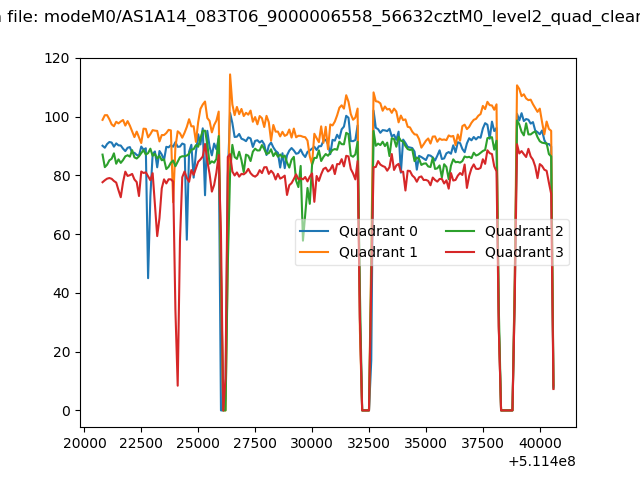
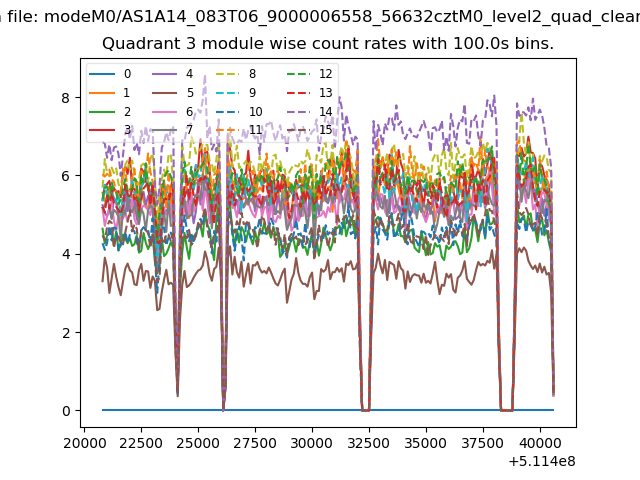
| Quadrant-wise count rates Data is divided into 100 sec bins |
 |
|
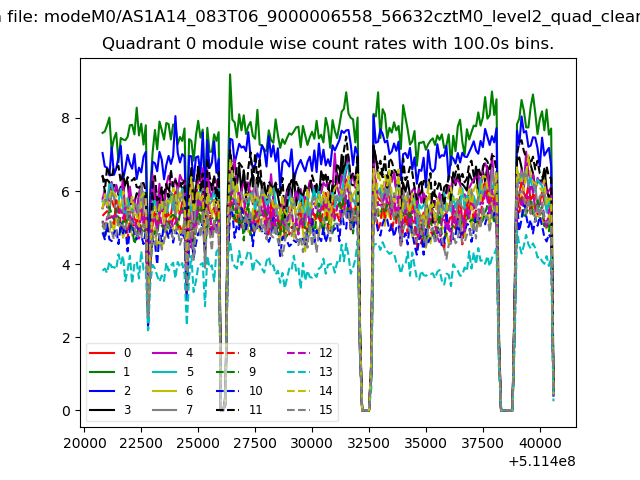
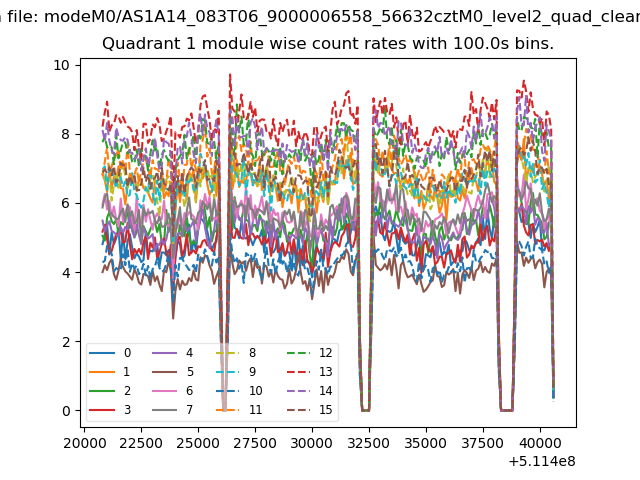
| Module-wise count rates for Quadrant A Data is divided into 100 sec bins |
 |
 |
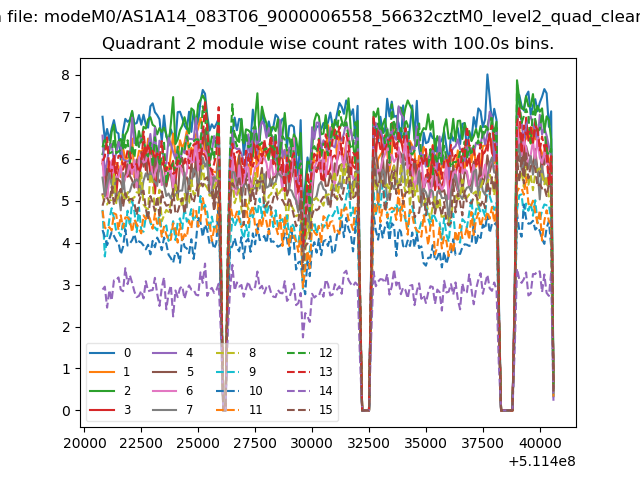
| Module-wise count rates for Quadrant B Data is divided into 100 sec bins |
 |
 |
| Module-wise count rates for Quadrant C Data is divided into 100 sec bins |
 |
 |
| Module-wise count rates for Quadrant D Data is divided into 100 sec bins |
 |
 |
| Parameter | Plot |
|---|---|
| CZT HV Monitor | 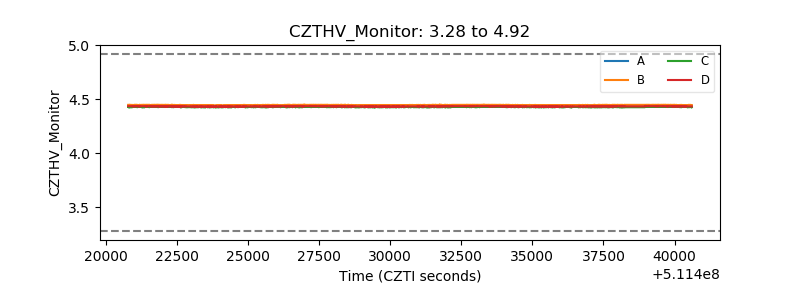 |
| D_VDD | 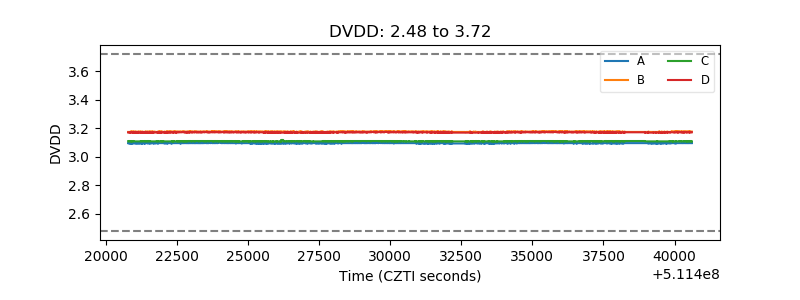 |
| Temperature 1 | 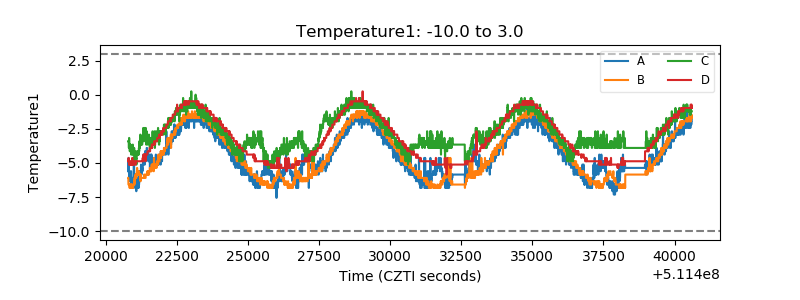 |
| Veto HV Monitor | 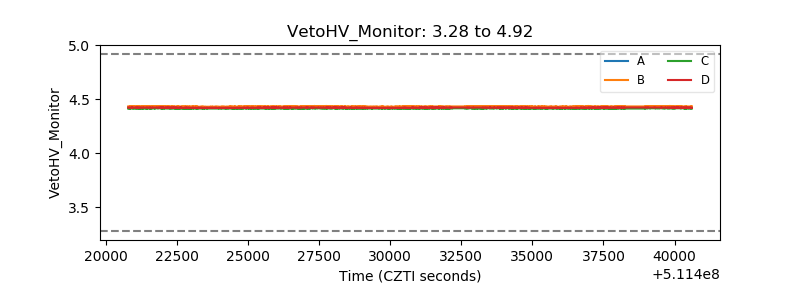 |
| Veto LLD | 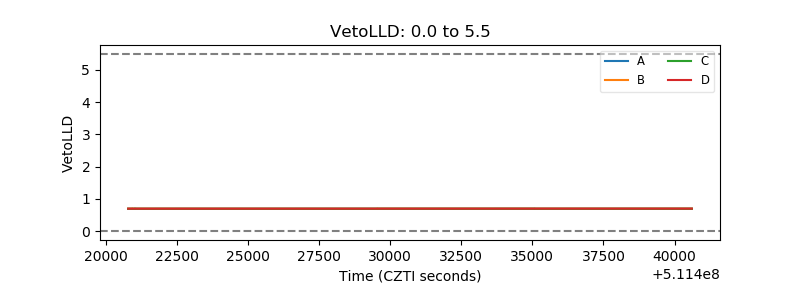 |
| Alpha Counter | 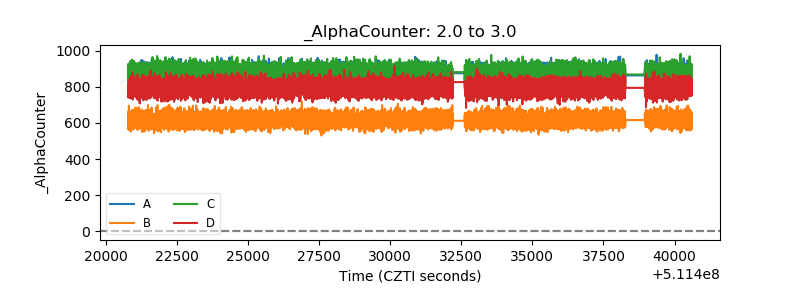 |
| _CPM_Rate | 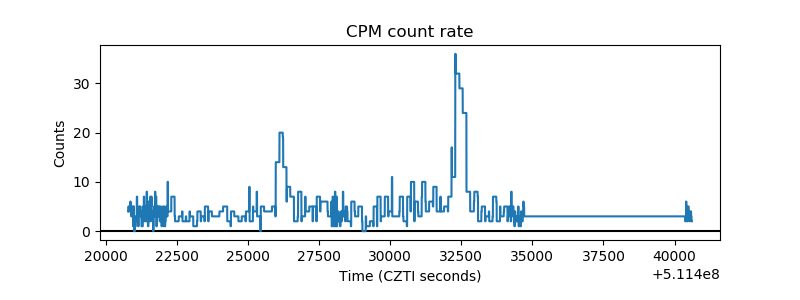 |
| CZT Counter | 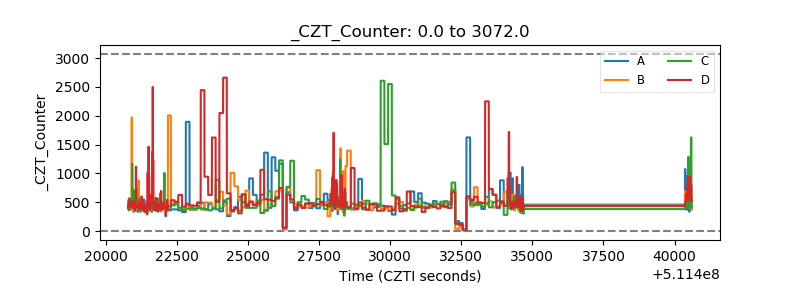 |
| +2.5 Volts monitor |  |
| +5 Volts monitor |  |
| _ROLL_ROT | 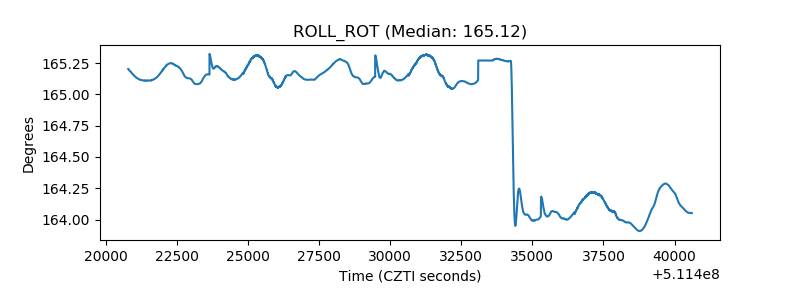 |
| _Roll_DEC | 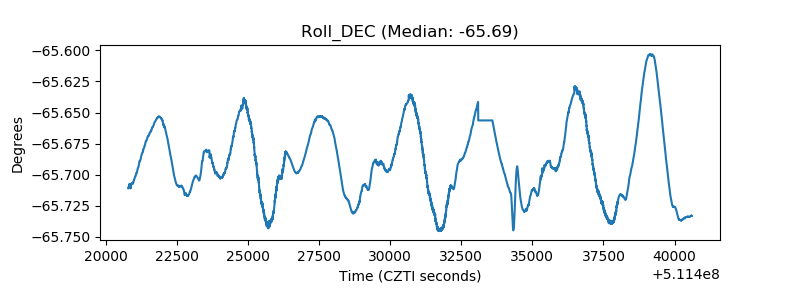 |
| _Roll_RA | 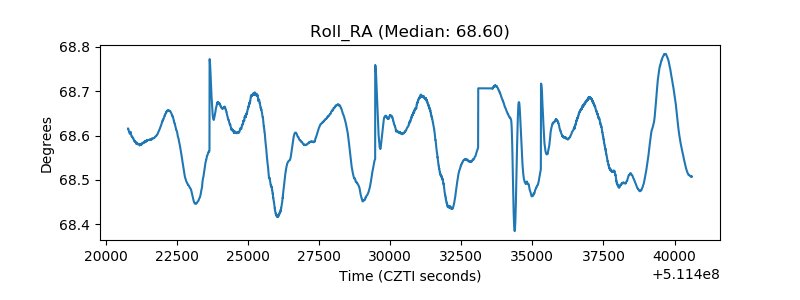 |
| Veto Counter | 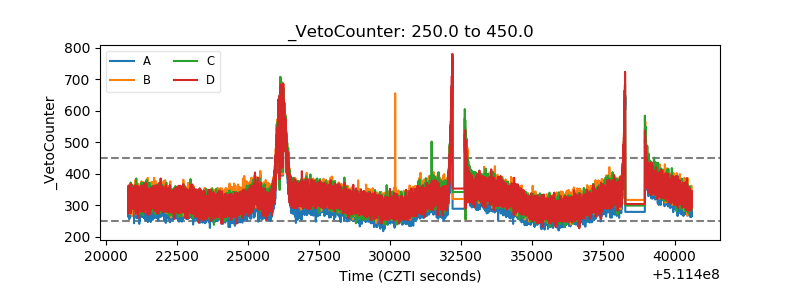 |