| Param | Original file | Final file |
|---|---|---|
| Filename | modeM0/AS1A14_083T06_9000006558_56635cztM0_level2.fits | modeM0/AS1A14_083T06_9000006558_56635cztM0_level2_quad_clean.evt |
| Size (bytes) | 377,648,640 | 92,021,760 |
| Size | 360.2 MB | 87.8 MB |
| Events in quadrant A | 3,397,110 | 591,676 |
| Events in quadrant B | 3,112,606 | 646,304 |
| Events in quadrant C | 2,989,631 | 574,255 |
| Events in quadrant D | 3,985,387 | 530,474 |
| Mode SS | |||
|---|---|---|---|
| Quadrant | BADHDUFLAG | Total packets | Discarded packets |
| A | 0 | 130 | 0 |
| B | 0 | 130 | 0 |
| C | 0 | 130 | 0 |
| D | 0 | 130 | 0 |
| Mode M9 | |||
|---|---|---|---|
| Quadrant | BADHDUFLAG | Total packets | Discarded packets |
| A | 0 | 10 | 0 |
| B | 0 | 10 | 0 |
| C | 0 | 10 | 0 |
| D | 0 | 10 | 0 |
| Mode M0 | |||
|---|---|---|---|
| Quadrant | BADHDUFLAG | Total packets | Discarded packets |
| A | 0 | 14744 | 1 |
| B | 0 | 13782 | 1 |
| C | 0 | 13604 | 1 |
| D | 0 | 16201 | 1 |
| Quadrant | Total seconds | Saturated seconds | Saturation percentage |
|---|---|---|---|
| A | 6352 | 211 | 3.321788% |
| B | 6353 | 100 | 1.574059% |
| C | 6353 | 52 | 0.818511% |
| D | 6353 | 198 | 3.116638% |
Noise dominated data is calculated using 1-second bins in cleaned event files. If a bin has >2000 counts, and if more than 50% of those come from <1% of pixels, then it is considered to be noise-dominated and hence unusable.
| Quadrant | # 1 sec bins | Bins with >0 counts | Bins with >2000 counts | High rate bins dominated by noise | Noise dominated (total time) | Noise dominated (detector-on time) | Marked lightcurve |
|---|---|---|---|---|---|---|---|
| A | 7342 | 6353 | 135 | 135 | 1.84% | 2.12% | 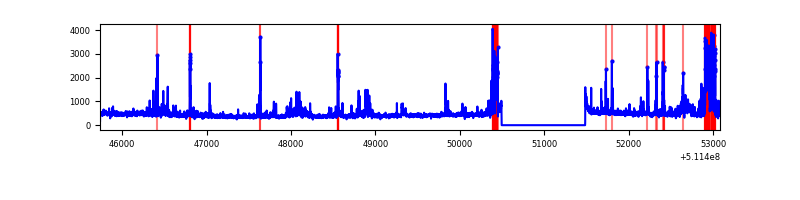 |
| B | 7343 | 6354 | 32 | 32 | 0.44% | 0.50% | 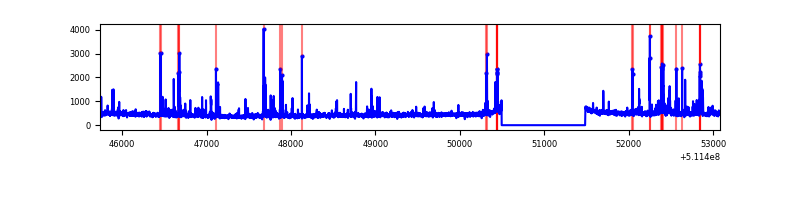 |
| C | 7343 | 6354 | 14 | 14 | 0.19% | 0.22% | 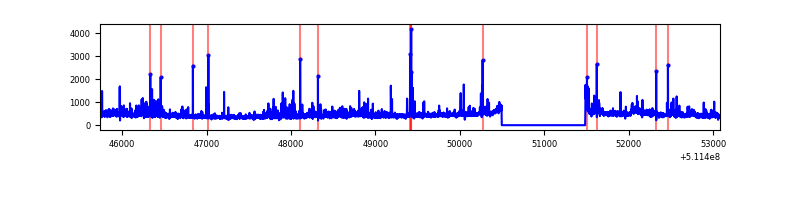 |
| D | 7343 | 6354 | 134 | 134 | 1.82% | 2.11% | 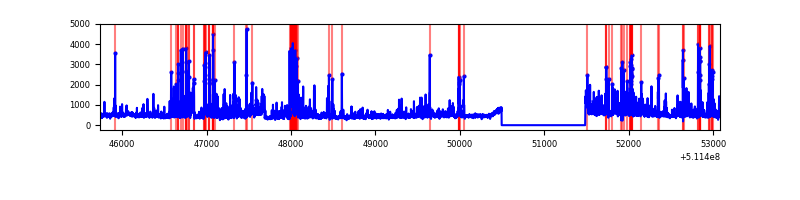 |
Top three noisy pixels from each quadrant. If the there are fewer than three noisy pixels in the level2.evt file, extra rows are filled as -1
| Pixel properties | Quadrant properties | ||||||
|---|---|---|---|---|---|---|---|
| Quadrant | DetID | PixID | Counts | Sigma | Mean | Median | Sigma |
| A | 10 | 251 | 471848 | 2830.27 | 670 | 652 | 166.5 |
| A | 6 | 179 | 131812 | 787.82 | 670 | 652 | 166.5 |
| A | 4 | 95 | 85900 | 512.05 | 670 | 652 | 166.5 |
| B | 10 | 247 | 150963 | 1044.03 | 669 | 643 | 144.0 |
| B | 0 | 245 | 72776 | 500.99 | 669 | 643 | 144.0 |
| B | 8 | 128 | 48118 | 329.73 | 669 | 643 | 144.0 |
| C | 1 | 16 | 167318 | 933.96 | 650 | 643 | 178.5 |
| C | 13 | 3 | 88563 | 492.66 | 650 | 643 | 178.5 |
| C | 12 | 252 | 85201 | 473.82 | 650 | 643 | 178.5 |
| D | 6 | 239 | 468702 | 2553.24 | 647 | 618 | 183.3 |
| D | 2 | 249 | 343755 | 1871.7 | 647 | 618 | 183.3 |
| D | 3 | 12 | 201940 | 1098.14 | 647 | 618 | 183.3 |
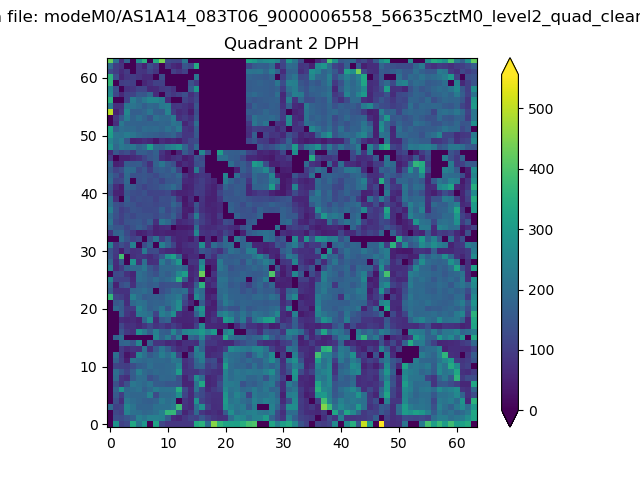
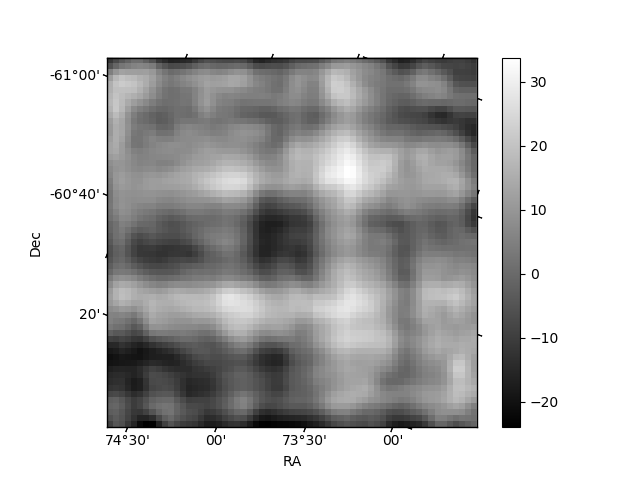
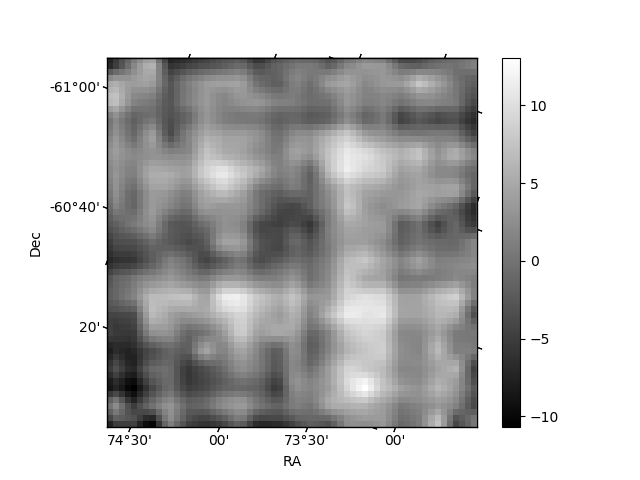
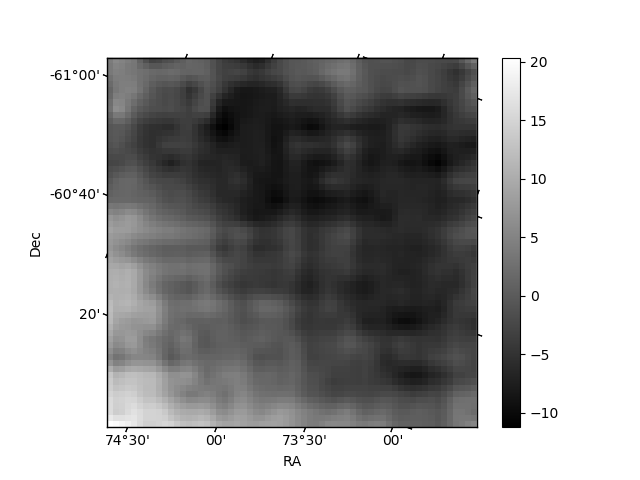
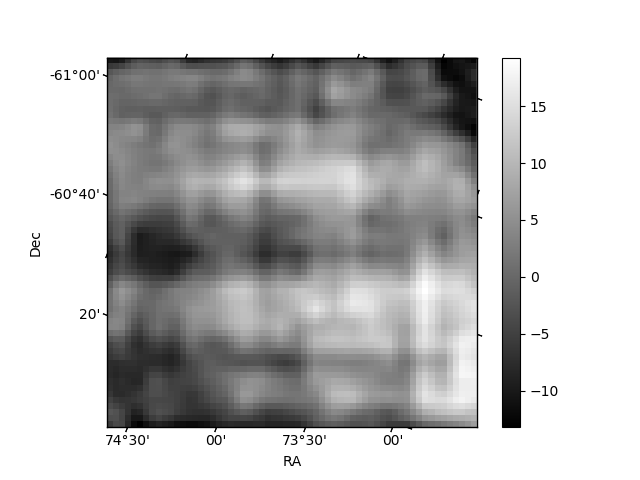
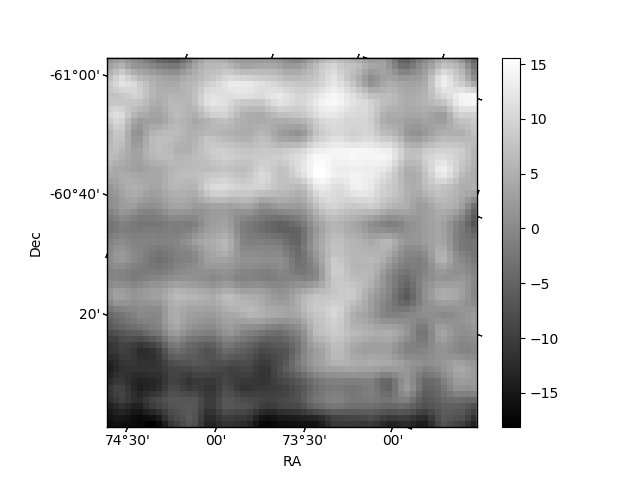
Histogram calculated using DETX and DETY for each event in the final _common_clean file
| Quadrant A | 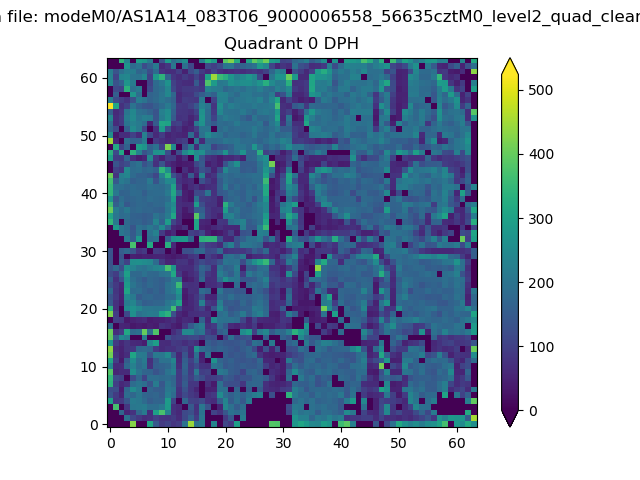 |
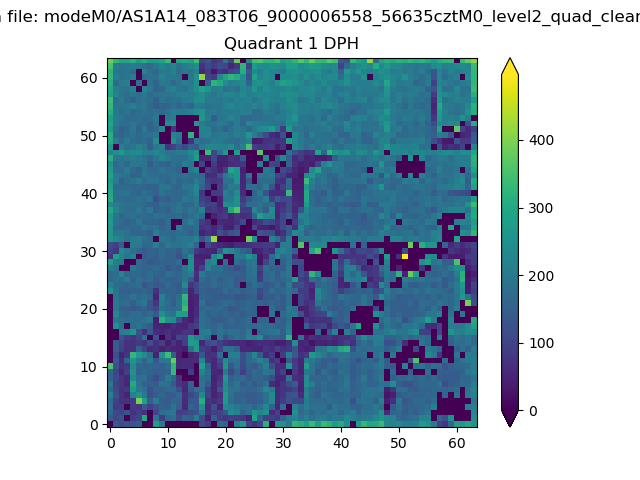 |
Quadrant B |
|---|---|---|---|
| Quadrant D | 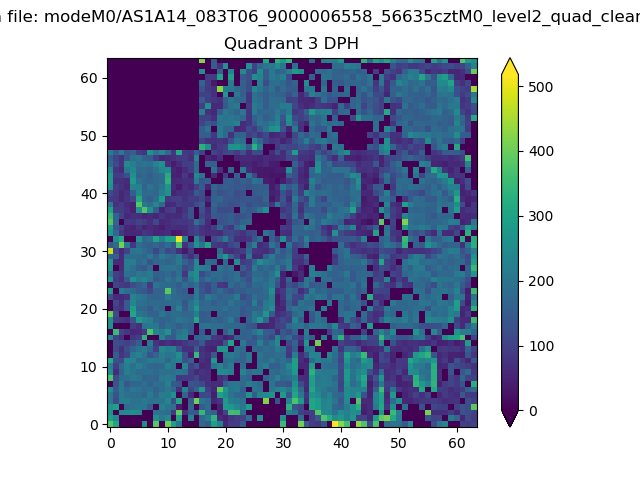 |
 |
Quadrant C |
| Plot type | Count rate plots | Images |
|---|---|---|
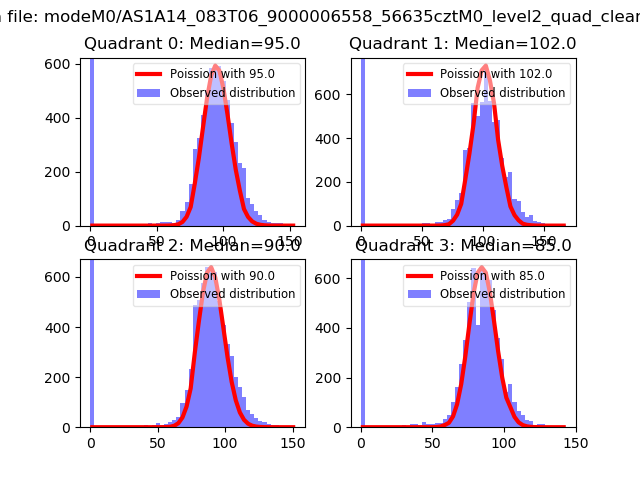
| Comparison with Poisson distribution Blue bars denote a histogram of data divided into 1 sec bins. Red curve is a Poisson curve with rate = median count rate of data. |
 |
 |
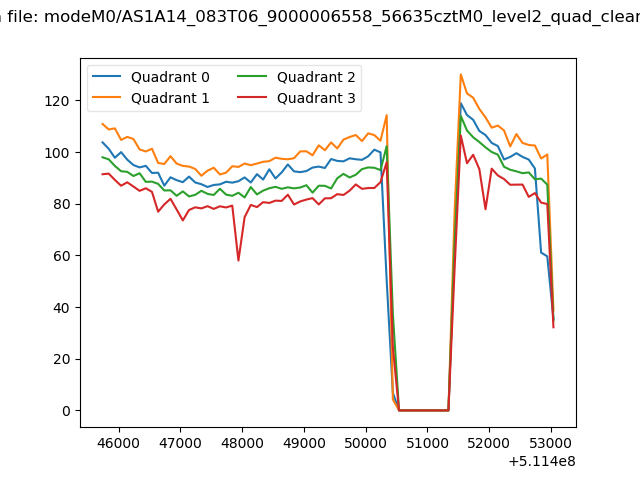
| Quadrant-wise count rates Data is divided into 100 sec bins |
 |
|
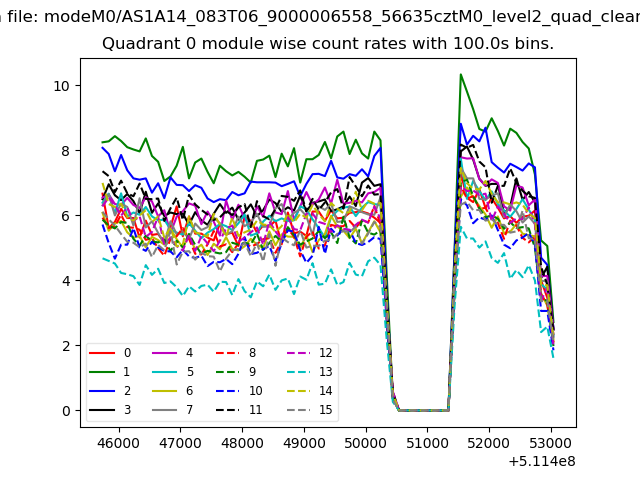
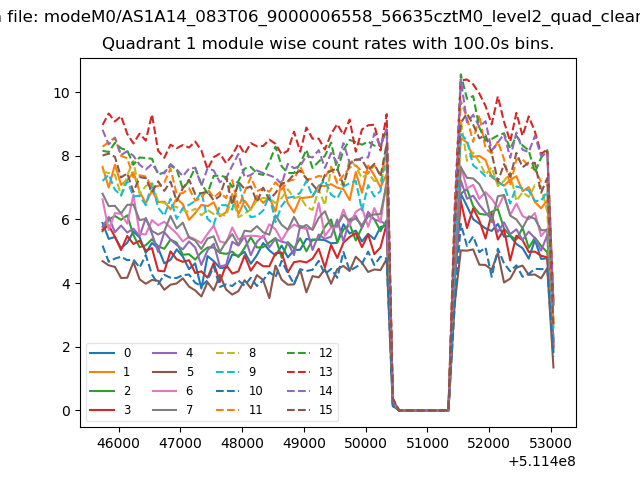
| Module-wise count rates for Quadrant A Data is divided into 100 sec bins |
 |
 |
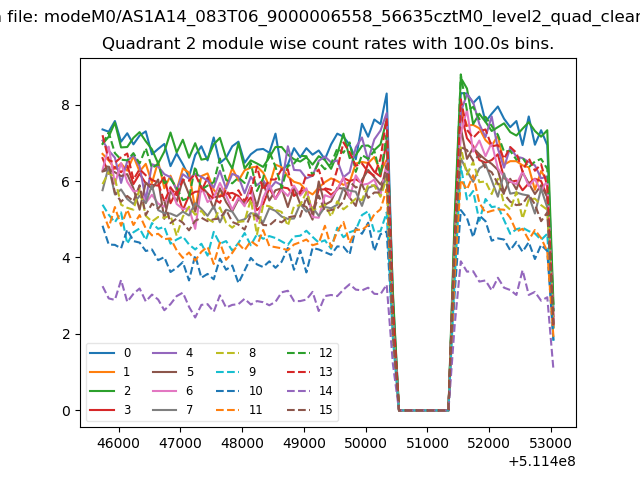
| Module-wise count rates for Quadrant B Data is divided into 100 sec bins |
 |
 |
| Module-wise count rates for Quadrant C Data is divided into 100 sec bins |
 |
 |
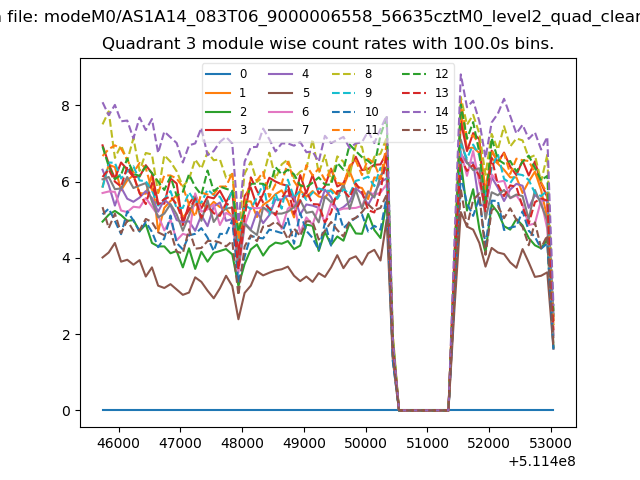
| Module-wise count rates for Quadrant D Data is divided into 100 sec bins |
 |
 |
| Parameter | Plot |
|---|---|
| CZT HV Monitor | 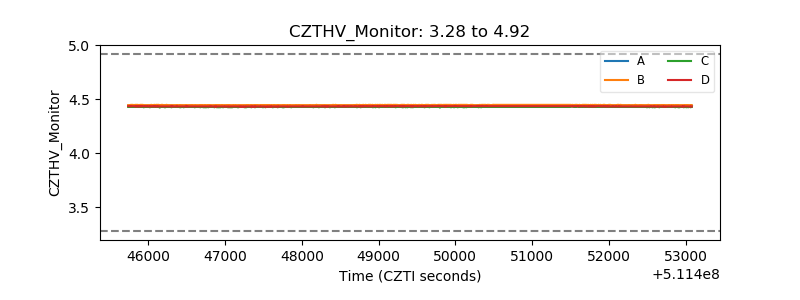 |
| D_VDD | 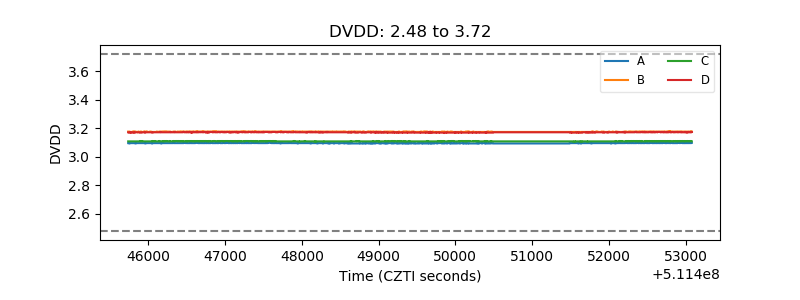 |
| Temperature 1 | 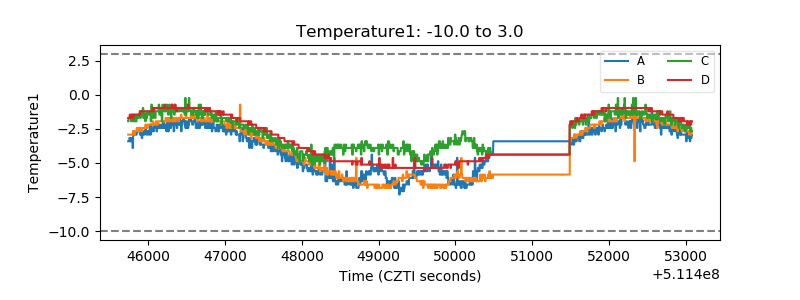 |
| Veto HV Monitor | 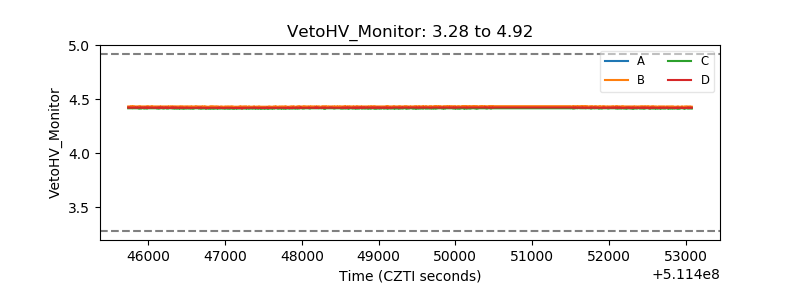 |
| Veto LLD | 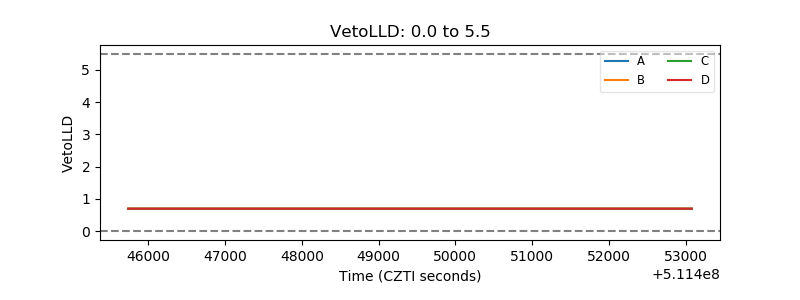 |
| Alpha Counter | 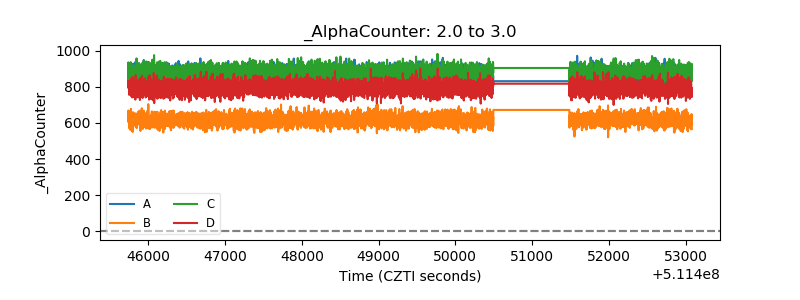 |
| _CPM_Rate | 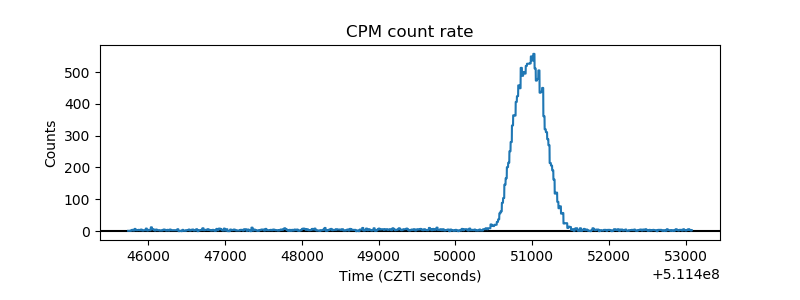 |
| CZT Counter | 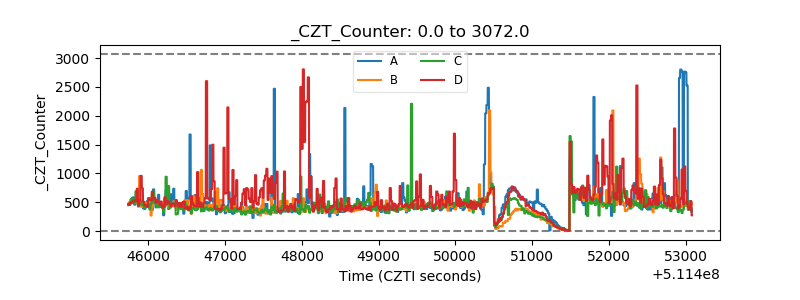 |
| +2.5 Volts monitor |  |
| +5 Volts monitor |  |
| _ROLL_ROT | 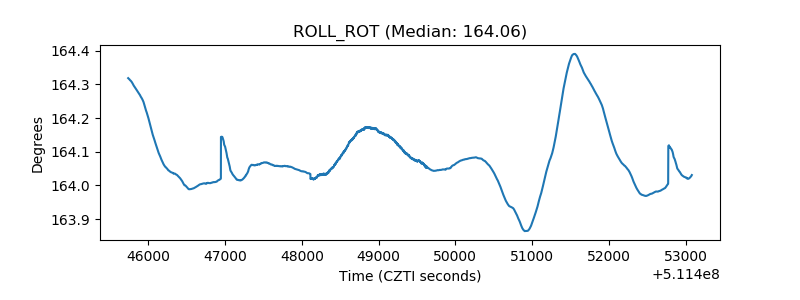 |
| _Roll_DEC | 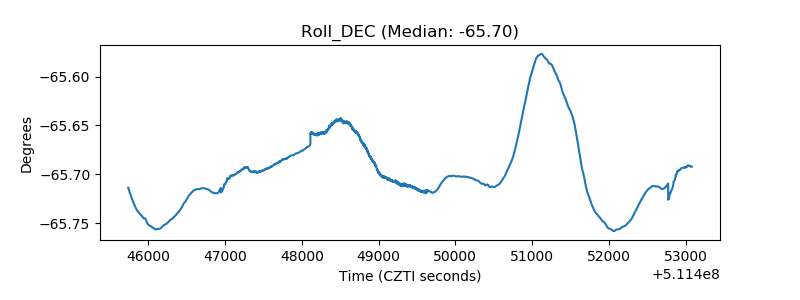 |
| _Roll_RA | 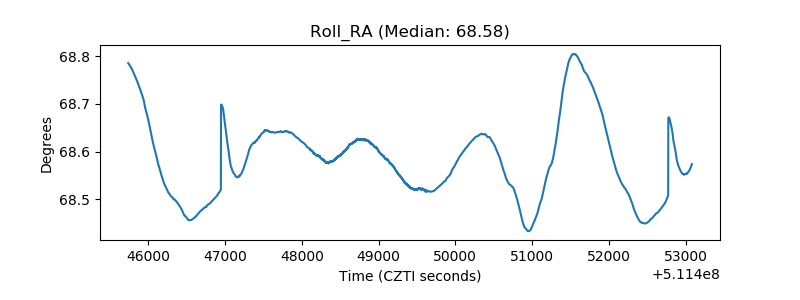 |
| Veto Counter | 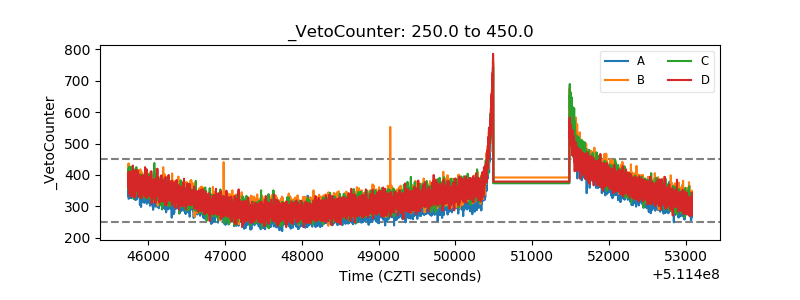 |