| Param | Original file | Final file |
|---|---|---|
| Filename | modeM0/AS1A14_083T06_9000006558_56636cztM0_level2.fits | modeM0/AS1A14_083T06_9000006558_56636cztM0_level2_quad_clean.evt |
| Size (bytes) | 392,734,080 | 84,646,080 |
| Size | 374.5 MB | 80.7 MB |
| Events in quadrant A | 4,104,079 | 539,163 |
| Events in quadrant B | 2,986,373 | 608,209 |
| Events in quadrant C | 3,407,232 | 514,448 |
| Events in quadrant D | 3,583,756 | 491,834 |
| Mode SS | |||
|---|---|---|---|
| Quadrant | BADHDUFLAG | Total packets | Discarded packets |
| A | 0 | 118 | 0 |
| B | 0 | 118 | 0 |
| C | 0 | 118 | 0 |
| D | 0 | 118 | 0 |
| Mode M9 | |||
|---|---|---|---|
| Quadrant | BADHDUFLAG | Total packets | Discarded packets |
| A | 0 | 11 | 0 |
| B | 0 | 11 | 0 |
| C | 0 | 11 | 0 |
| D | 0 | 11 | 0 |
| Mode M0 | |||
|---|---|---|---|
| Quadrant | BADHDUFLAG | Total packets | Discarded packets |
| A | 0 | 16315 | 2 |
| B | 0 | 12776 | 1 |
| C | 0 | 14259 | 1 |
| D | 0 | 14814 | 1 |
| Quadrant | Total seconds | Saturated seconds | Saturation percentage |
|---|---|---|---|
| A | 5862 | 417 | 7.113613% |
| B | 5863 | 75 | 1.279209% |
| C | 5863 | 239 | 4.076411% |
| D | 5863 | 237 | 4.042299% |
Noise dominated data is calculated using 1-second bins in cleaned event files. If a bin has >2000 counts, and if more than 50% of those come from <1% of pixels, then it is considered to be noise-dominated and hence unusable.
| Quadrant | # 1 sec bins | Bins with >0 counts | Bins with >2000 counts | High rate bins dominated by noise | Noise dominated (total time) | Noise dominated (detector-on time) | Marked lightcurve |
|---|---|---|---|---|---|---|---|
| A | 6967 | 5863 | 388 | 388 | 5.57% | 6.62% | 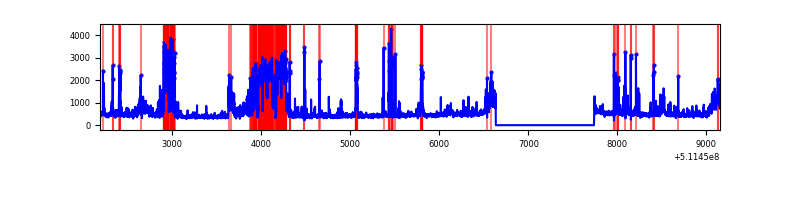 |
| B | 6968 | 5864 | 15 | 15 | 0.22% | 0.26% | 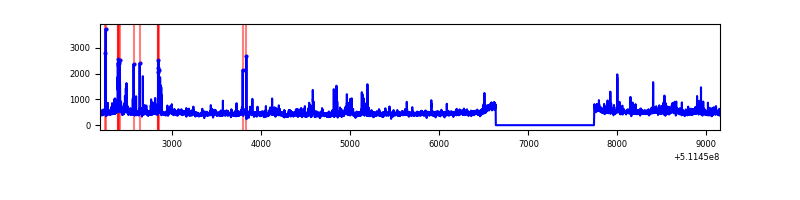 |
| C | 6968 | 5864 | 171 | 171 | 2.45% | 2.92% | 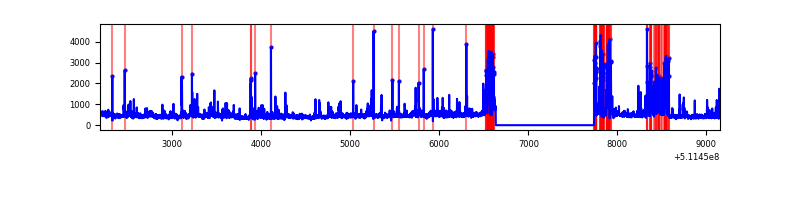 |
| D | 6968 | 5864 | 179 | 179 | 2.57% | 3.05% | 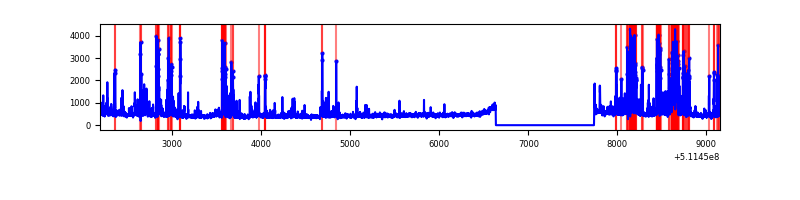 |
Top three noisy pixels from each quadrant. If the there are fewer than three noisy pixels in the level2.evt file, extra rows are filled as -1
| Pixel properties | Quadrant properties | ||||||
|---|---|---|---|---|---|---|---|
| Quadrant | DetID | PixID | Counts | Sigma | Mean | Median | Sigma |
| A | 4 | 95 | 909244 | 5896.28 | 616 | 601 | 154.1 |
| A | 10 | 251 | 422143 | 2735.43 | 616 | 601 | 154.1 |
| A | 6 | 179 | 216563 | 1401.4 | 616 | 601 | 154.1 |
| B | 4 | 21 | 200272 | 1489.68 | 620 | 597 | 134.0 |
| B | 0 | 197 | 117002 | 868.44 | 620 | 597 | 134.0 |
| B | 10 | 247 | 72681 | 537.79 | 620 | 597 | 134.0 |
| C | 14 | 96 | 519171 | 3225.38 | 584 | 579 | 160.8 |
| C | 1 | 16 | 178845 | 1108.72 | 584 | 579 | 160.8 |
| C | 13 | 3 | 138026 | 854.85 | 584 | 579 | 160.8 |
| D | 6 | 239 | 501103 | 2960.92 | 591 | 564 | 169.0 |
| D | 2 | 249 | 387626 | 2289.65 | 591 | 564 | 169.0 |
| D | 2 | 31 | 89168 | 524.13 | 591 | 564 | 169.0 |
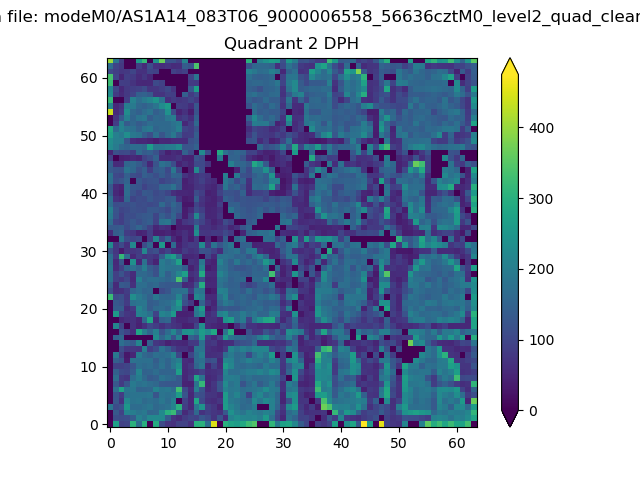
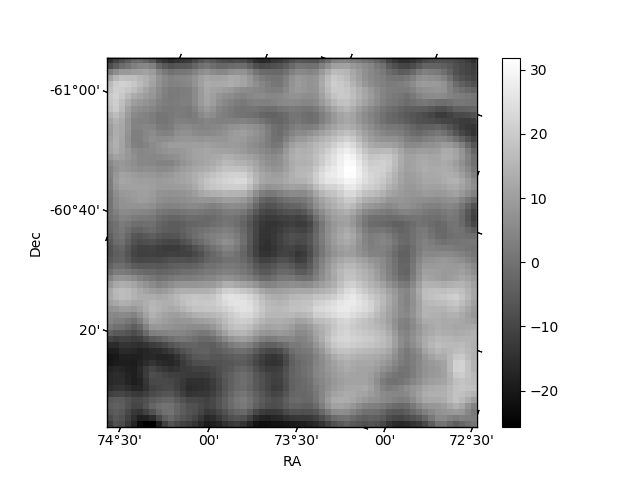
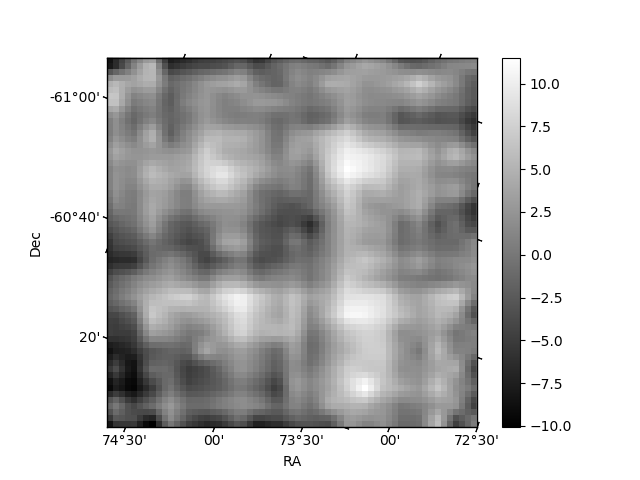
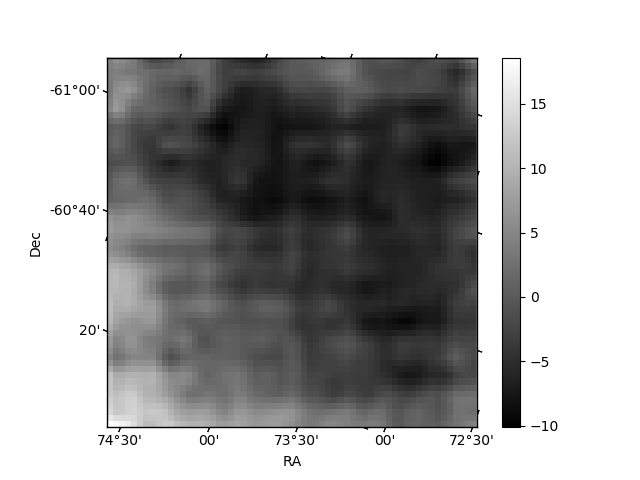
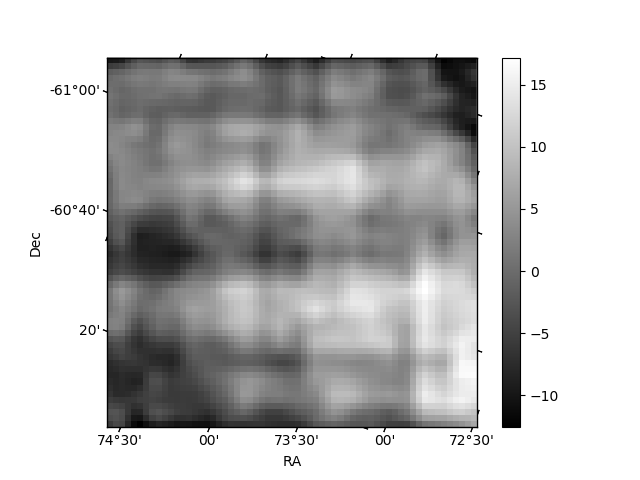
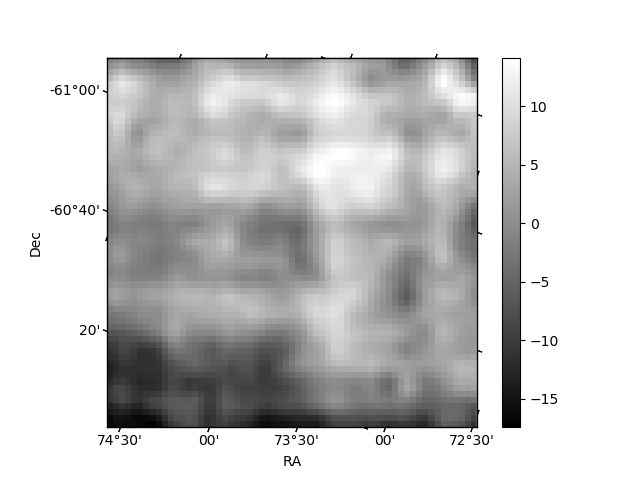
Histogram calculated using DETX and DETY for each event in the final _common_clean file
| Quadrant A | 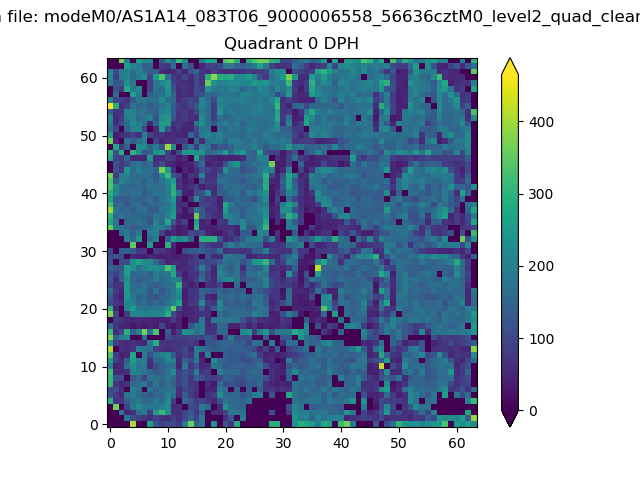 |
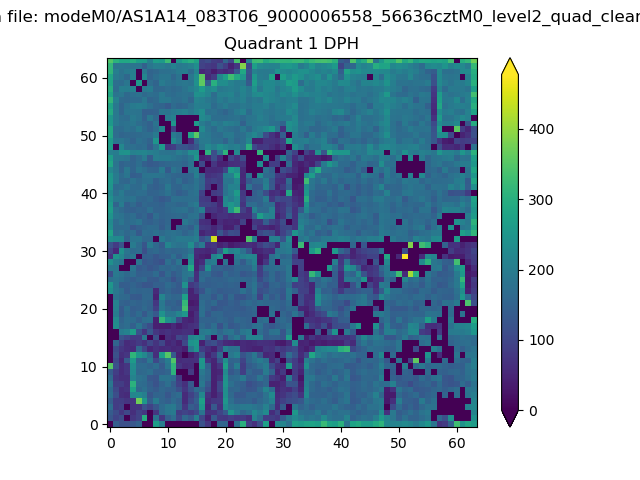 |
Quadrant B |
|---|---|---|---|
| Quadrant D | 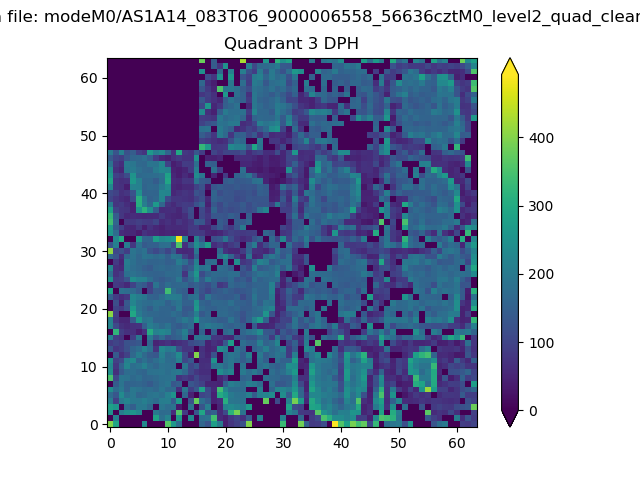 |
 |
Quadrant C |
| Plot type | Count rate plots | Images |
|---|---|---|
| Comparison with Poisson distribution Blue bars denote a histogram of data divided into 1 sec bins. Red curve is a Poisson curve with rate = median count rate of data. |
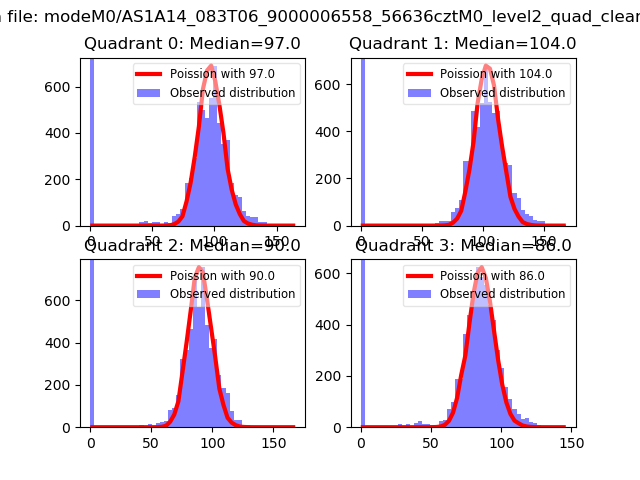 |
 |
| Quadrant-wise count rates Data is divided into 100 sec bins |
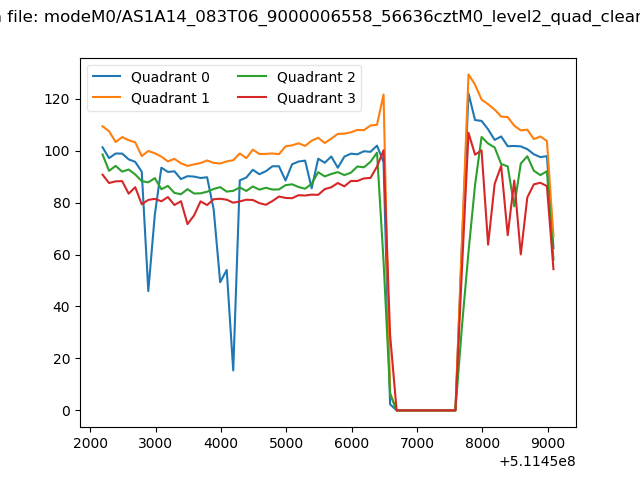 |
|
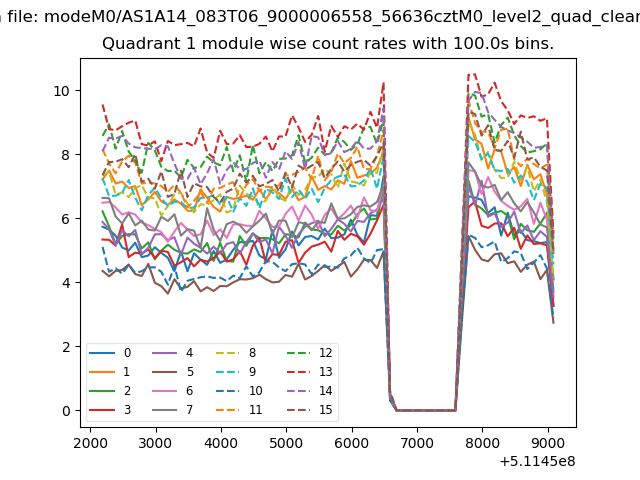
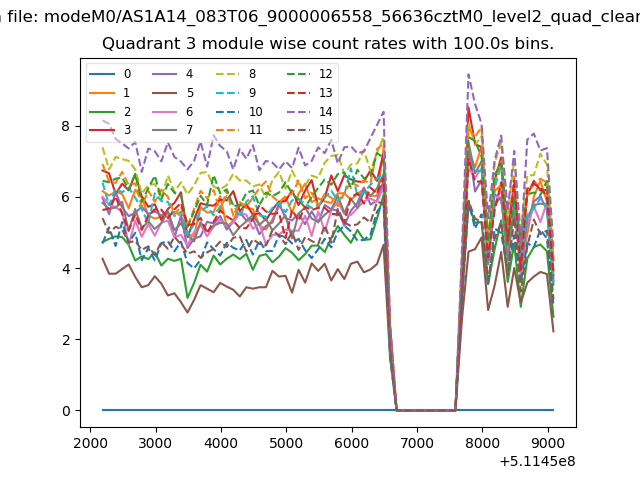
| Module-wise count rates for Quadrant A Data is divided into 100 sec bins |
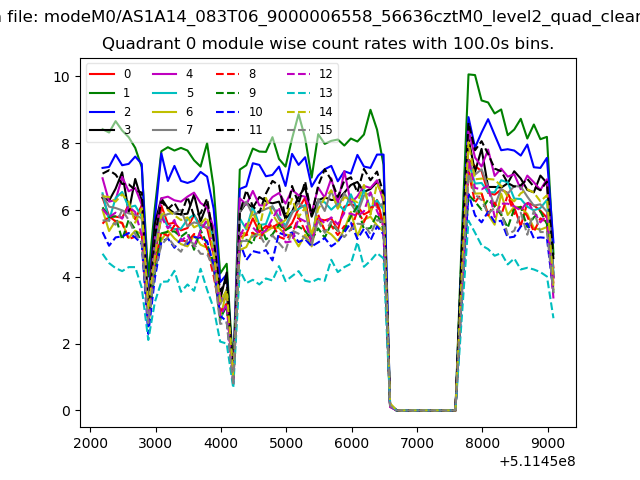 |
 |
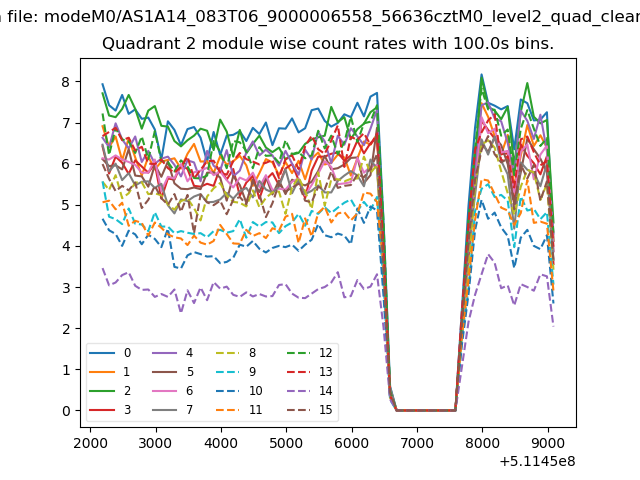
| Module-wise count rates for Quadrant B Data is divided into 100 sec bins |
 |
 |
| Module-wise count rates for Quadrant C Data is divided into 100 sec bins |
 |
 |
| Module-wise count rates for Quadrant D Data is divided into 100 sec bins |
 |
 |
| Parameter | Plot |
|---|---|
| CZT HV Monitor | 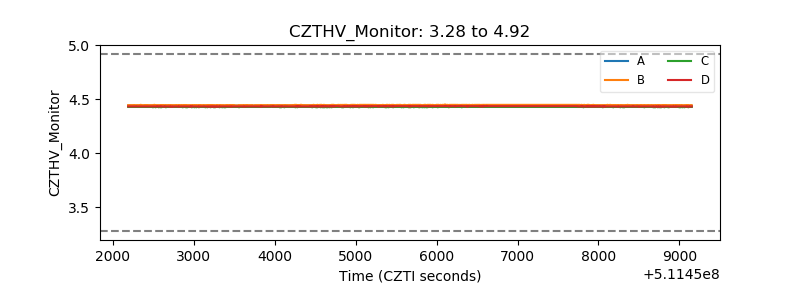 |
| D_VDD | 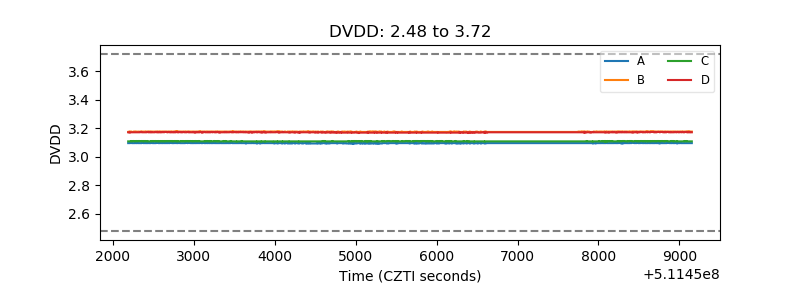 |
| Temperature 1 | 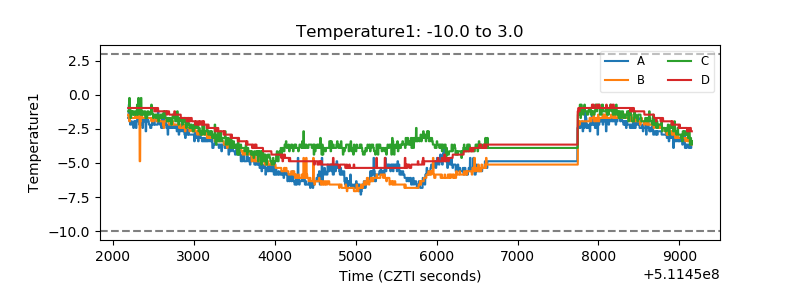 |
| Veto HV Monitor | 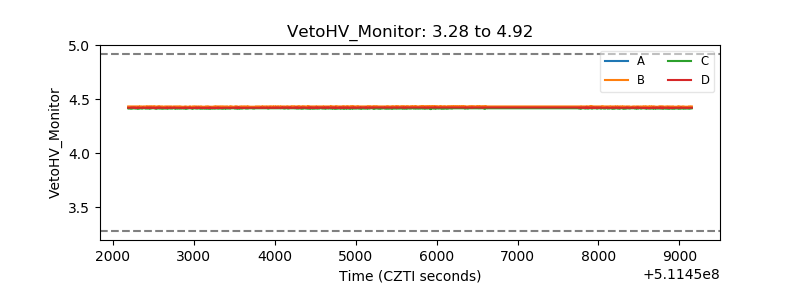 |
| Veto LLD | 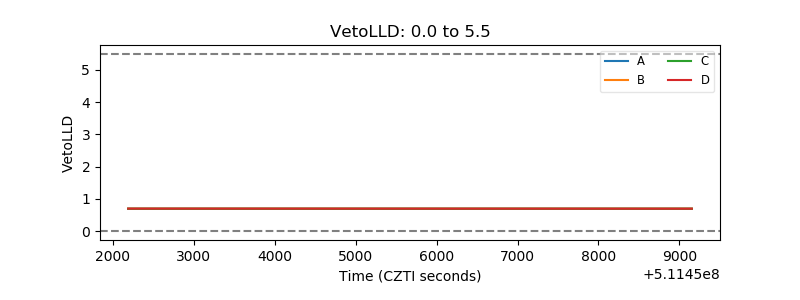 |
| Alpha Counter | 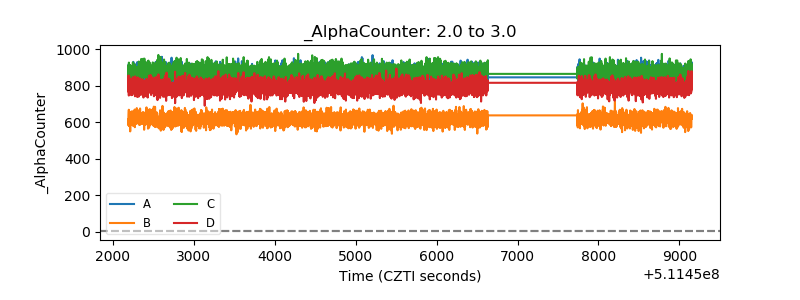 |
| _CPM_Rate | 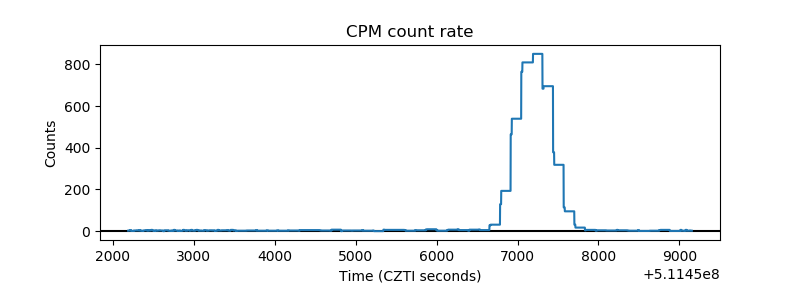 |
| CZT Counter | 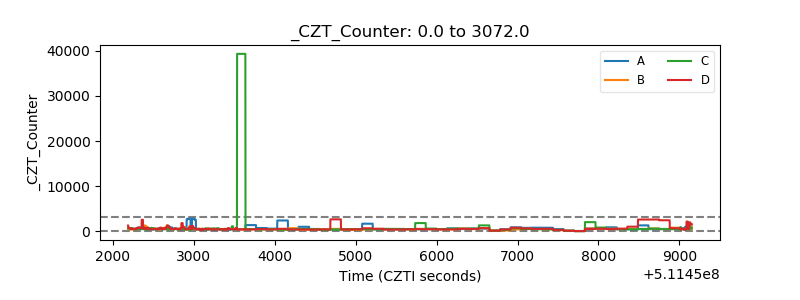 |
| +2.5 Volts monitor |  |
| +5 Volts monitor |  |
| _ROLL_ROT | 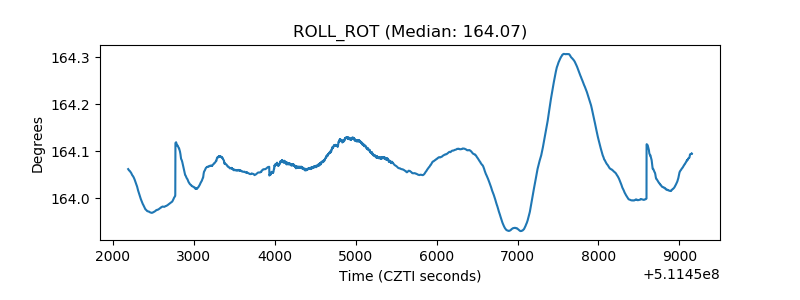 |
| _Roll_DEC | 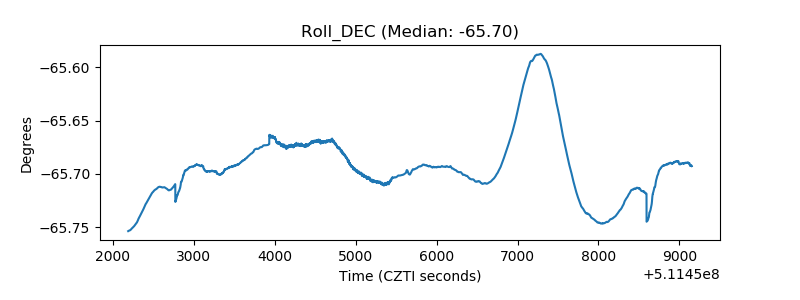 |
| _Roll_RA | 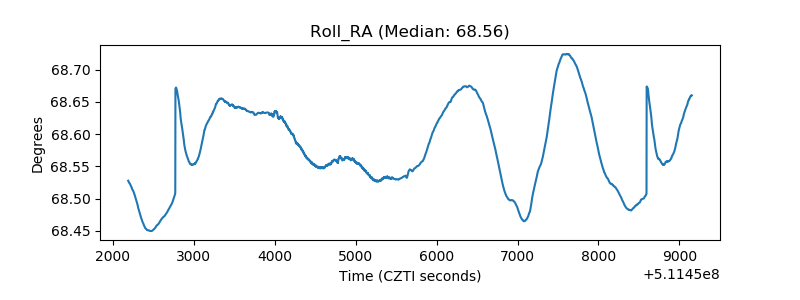 |
| Veto Counter | 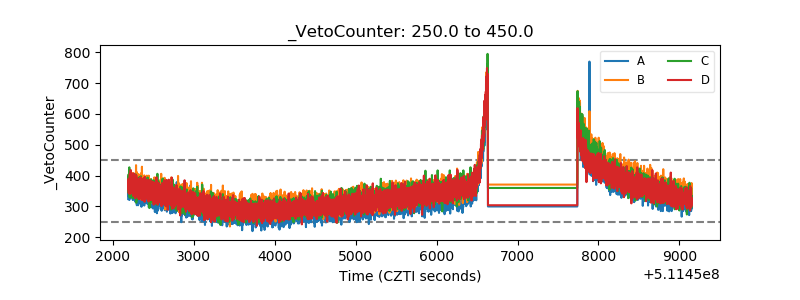 |