| Param | Original file | Final file |
|---|---|---|
| Filename | modeM0/AS1A14_083T06_9000006558_56638cztM0_level2.fits | modeM0/AS1A14_083T06_9000006558_56638cztM0_level2_quad_clean.evt |
| Size (bytes) | 371,471,040 | 91,641,600 |
| Size | 354.3 MB | 87.4 MB |
| Events in quadrant A | 3,513,279 | 598,585 |
| Events in quadrant B | 3,201,165 | 651,152 |
| Events in quadrant C | 3,348,242 | 565,203 |
| Events in quadrant D | 3,209,508 | 531,103 |
| Mode SS | |||
|---|---|---|---|
| Quadrant | BADHDUFLAG | Total packets | Discarded packets |
| A | 0 | 124 | 0 |
| B | 0 | 124 | 0 |
| C | 0 | 124 | 0 |
| D | 0 | 124 | 0 |
| Mode M9 | |||
|---|---|---|---|
| Quadrant | BADHDUFLAG | Total packets | Discarded packets |
| A | 0 | 12 | 0 |
| B | 0 | 12 | 0 |
| C | 0 | 12 | 0 |
| D | 0 | 12 | 0 |
| Mode M0 | |||
|---|---|---|---|
| Quadrant | BADHDUFLAG | Total packets | Discarded packets |
| A | 0 | 14890 | 1 |
| B | 0 | 13689 | 2 |
| C | 0 | 14456 | 1 |
| D | 0 | 13928 | 1 |
| Quadrant | Total seconds | Saturated seconds | Saturation percentage |
|---|---|---|---|
| A | 6147 | 181 | 2.944526% |
| B | 6147 | 66 | 1.073694% |
| C | 6147 | 96 | 1.561737% |
| D | 6147 | 73 | 1.187571% |
Noise dominated data is calculated using 1-second bins in cleaned event files. If a bin has >2000 counts, and if more than 50% of those come from <1% of pixels, then it is considered to be noise-dominated and hence unusable.
| Quadrant | # 1 sec bins | Bins with >0 counts | Bins with >2000 counts | High rate bins dominated by noise | Noise dominated (total time) | Noise dominated (detector-on time) | Marked lightcurve |
|---|---|---|---|---|---|---|---|
| A | 7342 | 6148 | 139 | 139 | 1.89% | 2.26% | 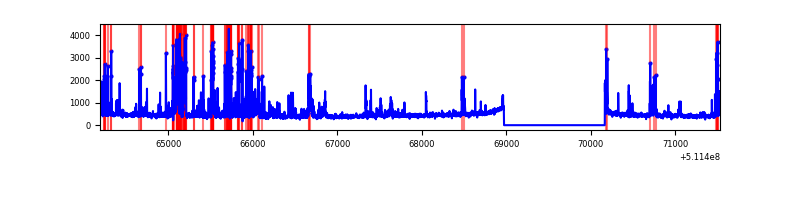 |
| B | 7342 | 6148 | 20 | 20 | 0.27% | 0.33% | 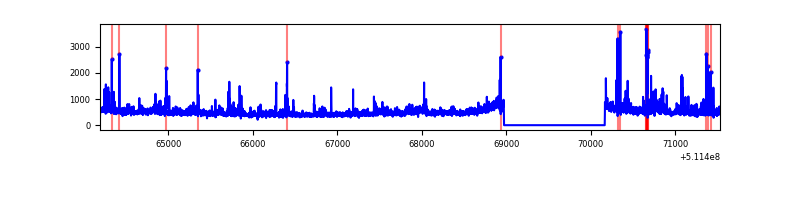 |
| C | 7342 | 6148 | 88 | 88 | 1.20% | 1.43% | 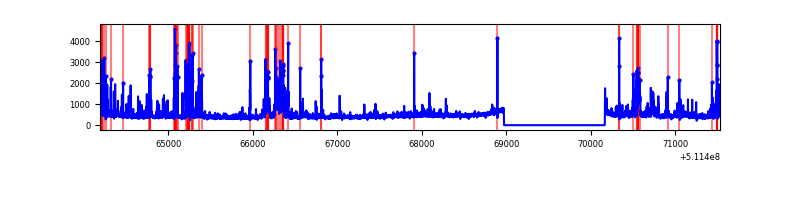 |
| D | 7342 | 6148 | 55 | 55 | 0.75% | 0.89% | 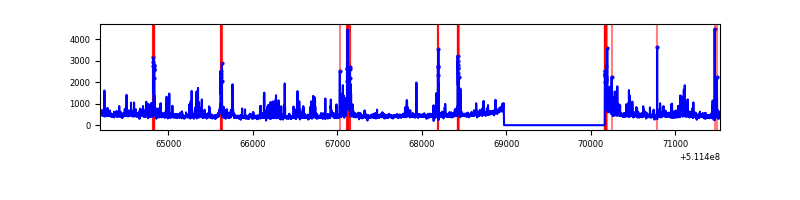 |
Top three noisy pixels from each quadrant. If the there are fewer than three noisy pixels in the level2.evt file, extra rows are filled as -1
| Pixel properties | Quadrant properties | ||||||
|---|---|---|---|---|---|---|---|
| Quadrant | DetID | PixID | Counts | Sigma | Mean | Median | Sigma |
| A | 0 | 8 | 265016 | 1635.18 | 655 | 640 | 161.7 |
| A | 4 | 249 | 261869 | 1615.72 | 655 | 640 | 161.7 |
| A | 10 | 251 | 215345 | 1327.96 | 655 | 640 | 161.7 |
| B | 4 | 21 | 293506 | 2106.81 | 655 | 633 | 139.0 |
| B | 0 | 197 | 64840 | 461.88 | 655 | 633 | 139.0 |
| B | 10 | 247 | 55493 | 394.64 | 655 | 633 | 139.0 |
| C | 13 | 3 | 387408 | 2237.51 | 626 | 620 | 172.9 |
| C | 15 | 230 | 201693 | 1163.17 | 626 | 620 | 172.9 |
| C | 12 | 252 | 98892 | 568.49 | 626 | 620 | 172.9 |
| D | 3 | 12 | 189465 | 1075.27 | 620 | 591 | 175.7 |
| D | 6 | 239 | 157303 | 892.17 | 620 | 591 | 175.7 |
| D | 7 | 96 | 96216 | 544.4 | 620 | 591 | 175.7 |
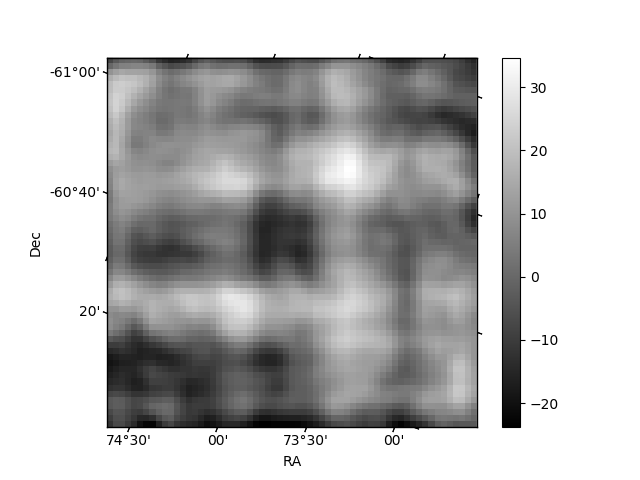
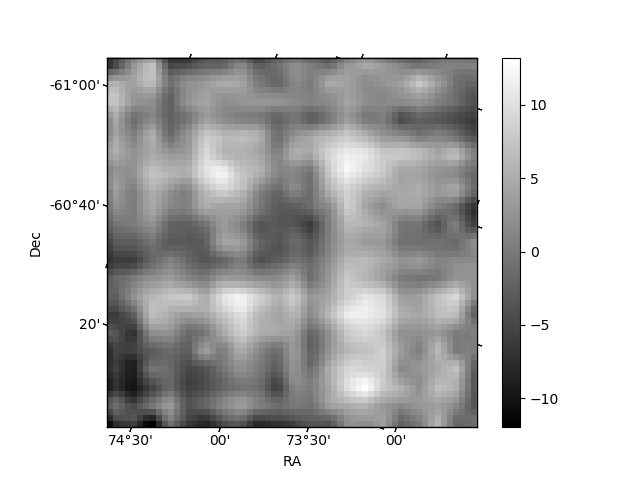
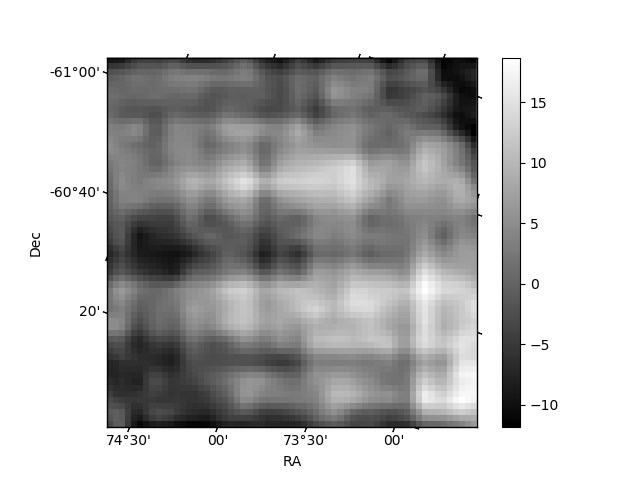
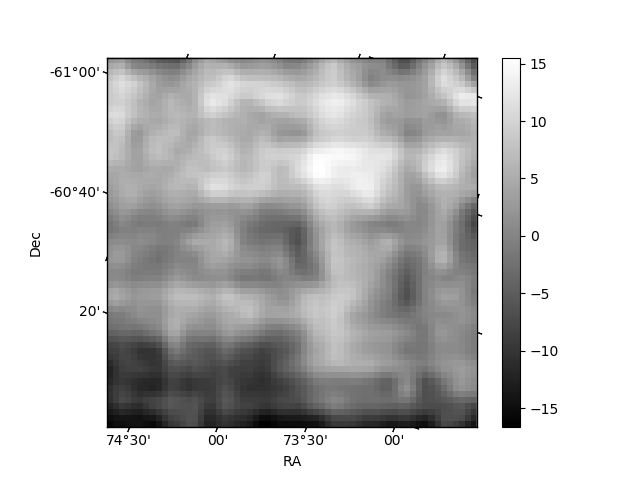
Histogram calculated using DETX and DETY for each event in the final _common_clean file
| Quadrant A | 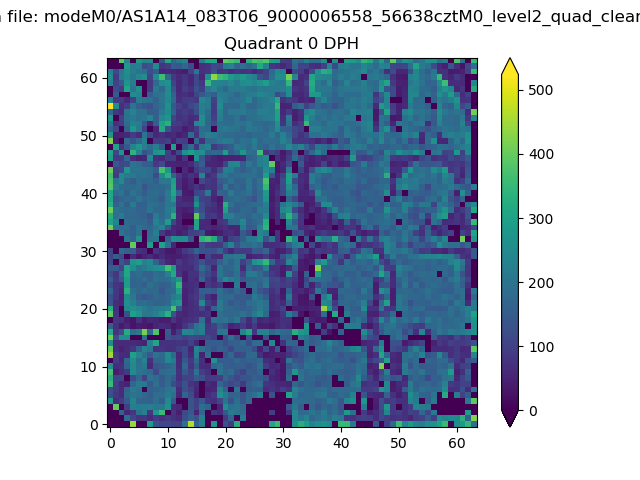 |
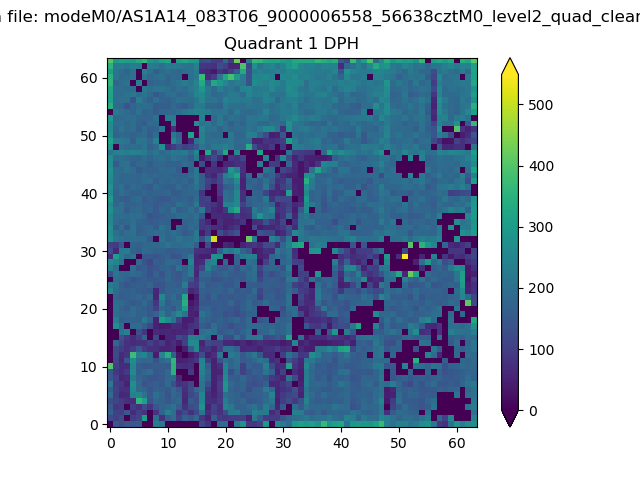 |
Quadrant B |
|---|---|---|---|
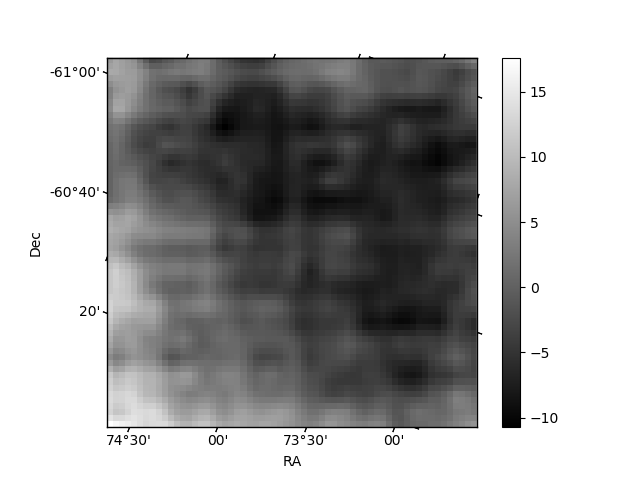
| Quadrant D | 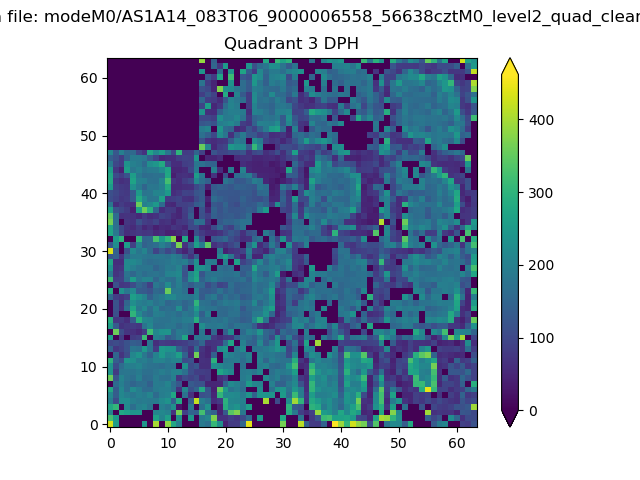 |
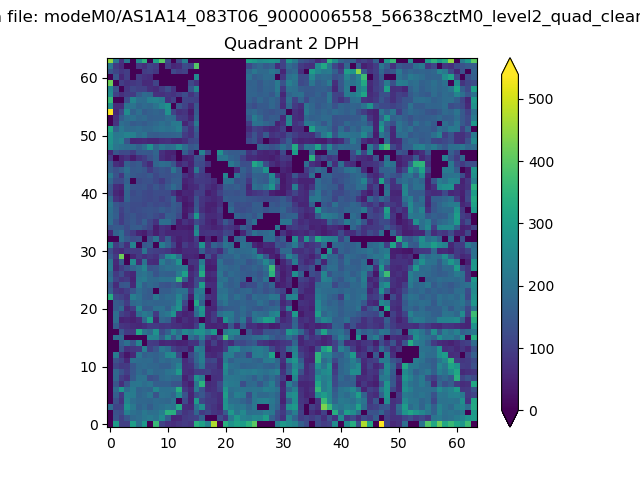 |
Quadrant C |
| Plot type | Count rate plots | Images |
|---|---|---|
| Comparison with Poisson distribution Blue bars denote a histogram of data divided into 1 sec bins. Red curve is a Poisson curve with rate = median count rate of data. |
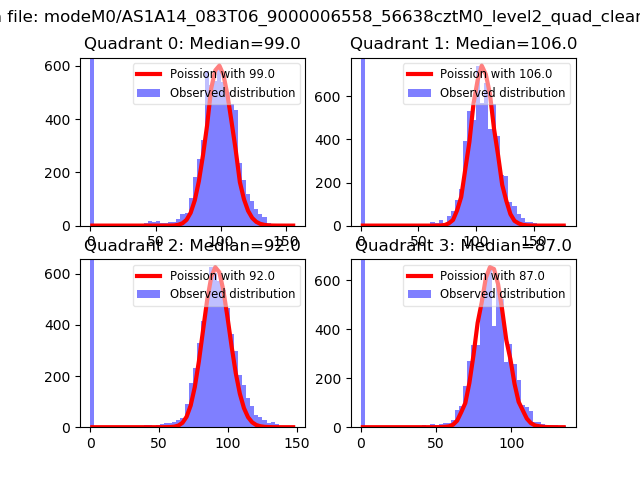 |
 |
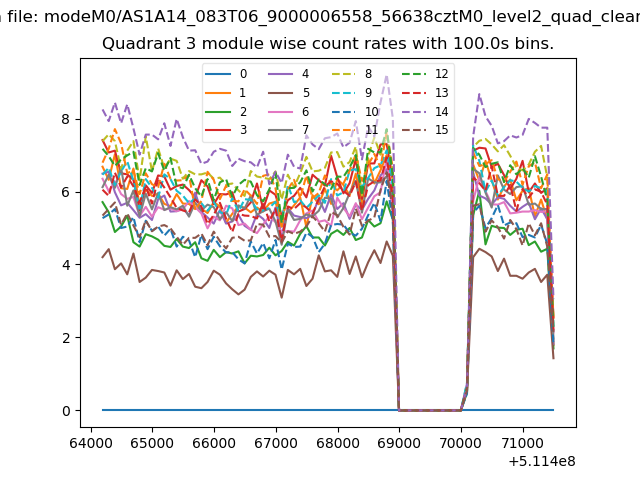
| Quadrant-wise count rates Data is divided into 100 sec bins |
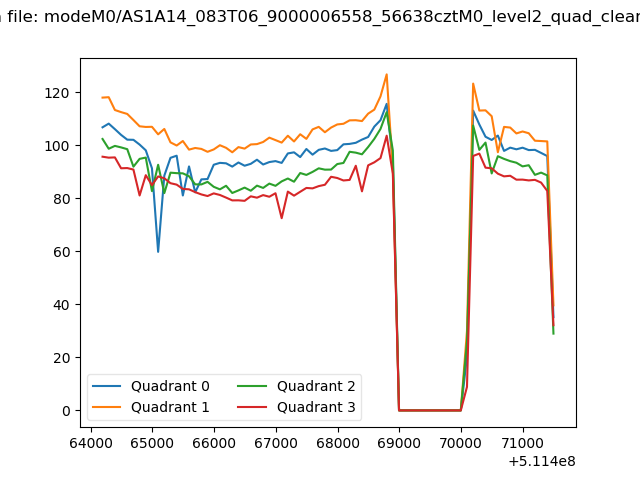 |
|
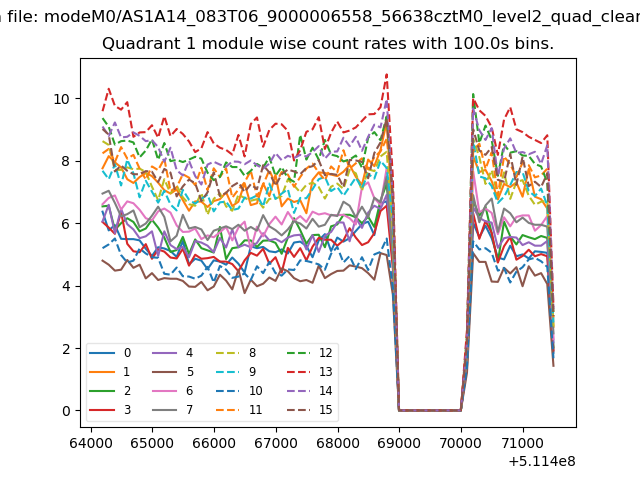
| Module-wise count rates for Quadrant A Data is divided into 100 sec bins |
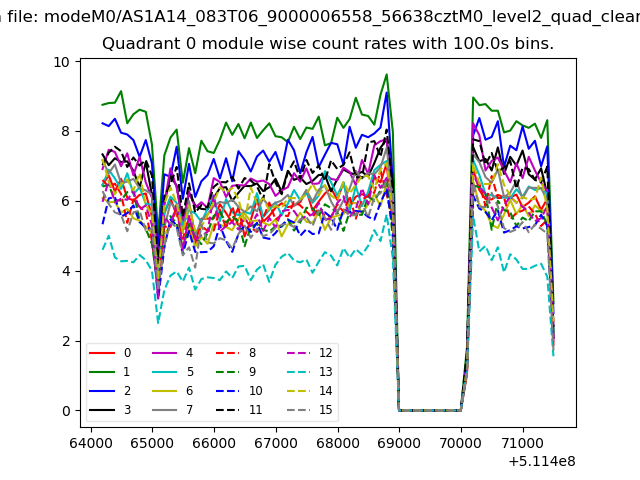 |
 |
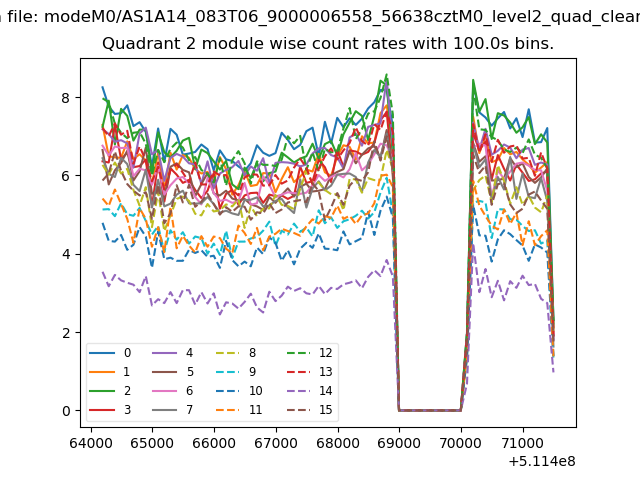
| Module-wise count rates for Quadrant B Data is divided into 100 sec bins |
 |
 |
| Module-wise count rates for Quadrant C Data is divided into 100 sec bins |
 |
 |
| Module-wise count rates for Quadrant D Data is divided into 100 sec bins |
 |
 |
| Parameter | Plot |
|---|---|
| CZT HV Monitor | 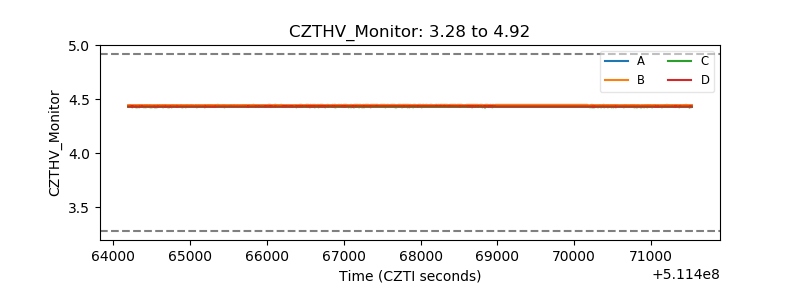 |
| D_VDD | 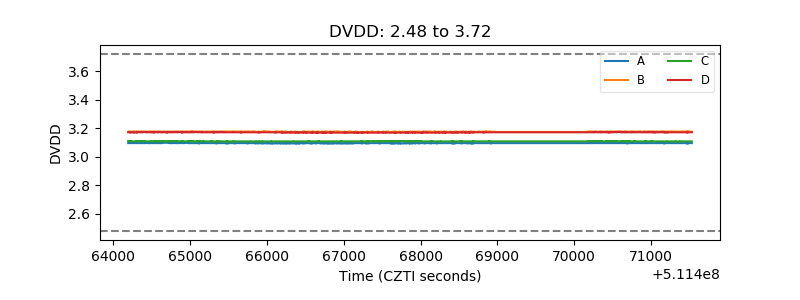 |
| Temperature 1 | 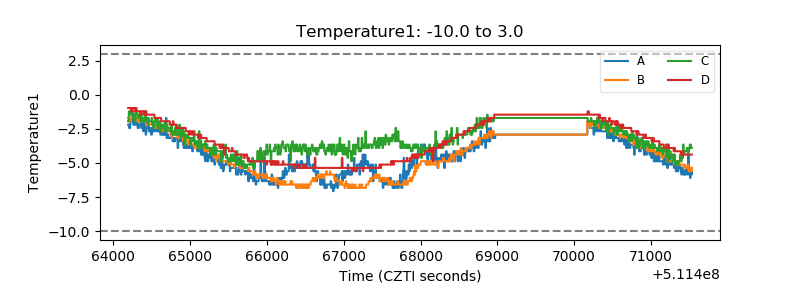 |
| Veto HV Monitor | 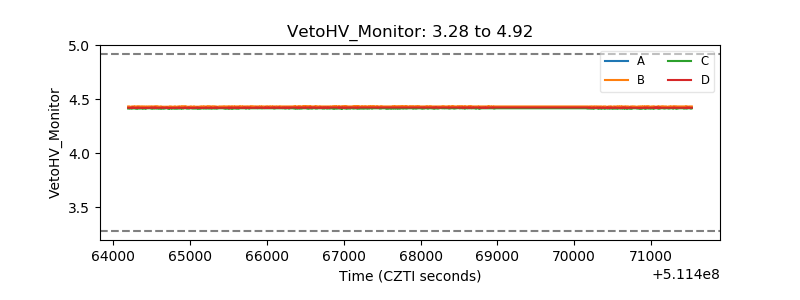 |
| Veto LLD | 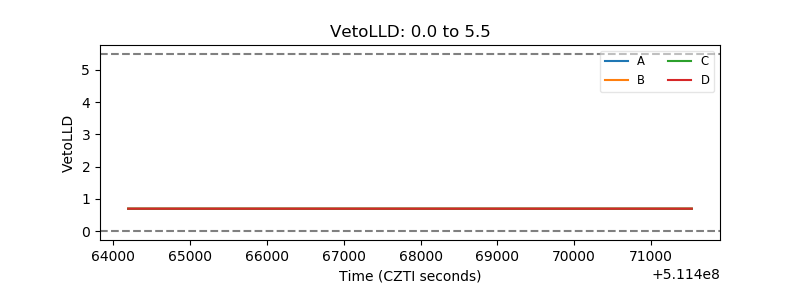 |
| Alpha Counter | 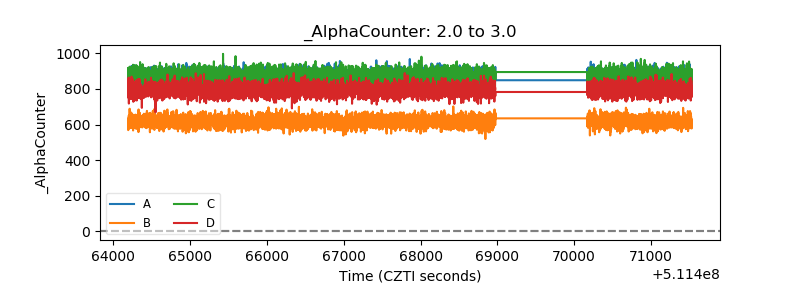 |
| _CPM_Rate | 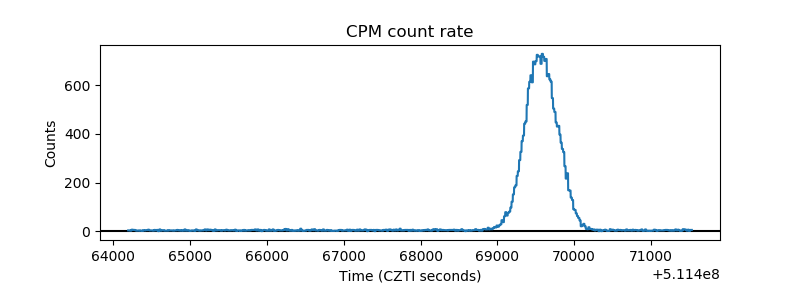 |
| CZT Counter | 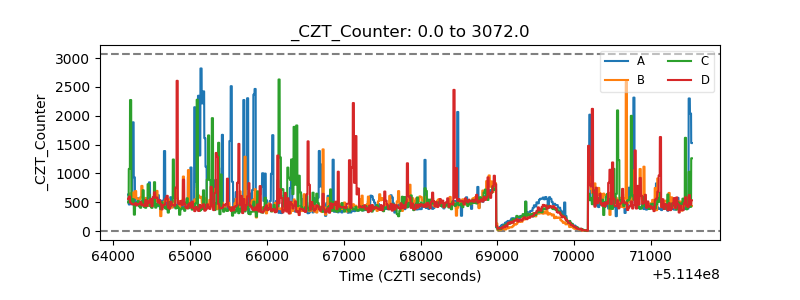 |
| +2.5 Volts monitor |  |
| +5 Volts monitor |  |
| _ROLL_ROT | 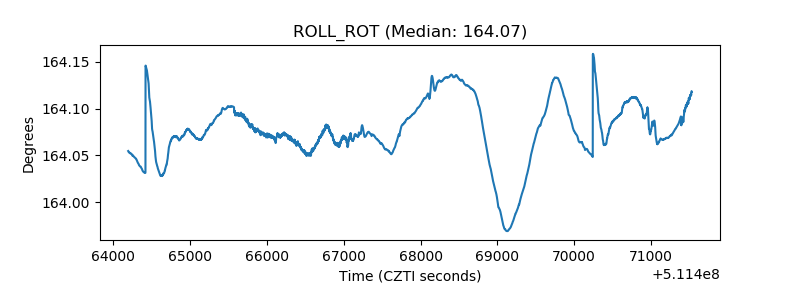 |
| _Roll_DEC | 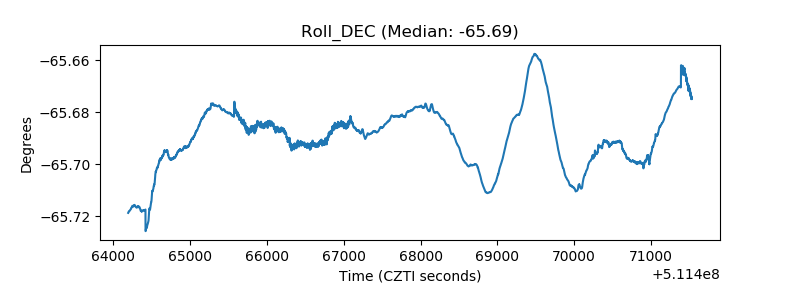 |
| _Roll_RA | 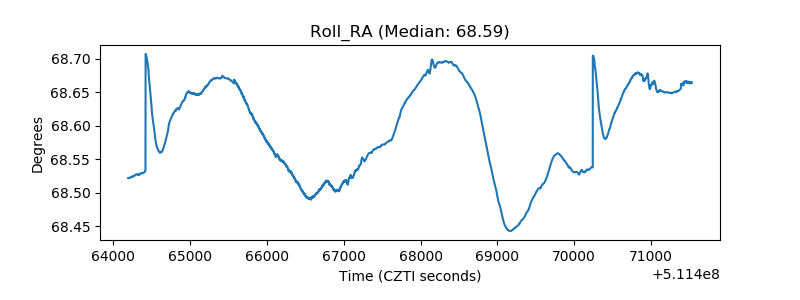 |
| Veto Counter | 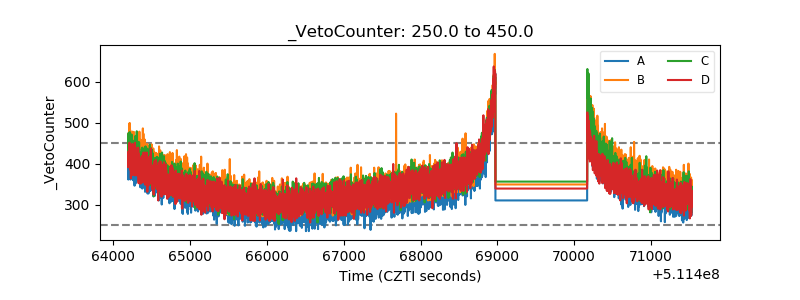 |