| Param | Original file | Final file |
|---|---|---|
| Filename | modeM0/AS1A14_083T06_9000006558_56642cztM0_level2.fits | modeM0/AS1A14_083T06_9000006558_56642cztM0_level2_quad_clean.evt |
| Size (bytes) | 532,558,080 | 119,617,920 |
| Size | 507.9 MB | 114.1 MB |
| Events in quadrant A | 4,202,403 | 784,470 |
| Events in quadrant B | 4,318,329 | 845,247 |
| Events in quadrant C | 4,781,698 | 742,969 |
| Events in quadrant D | 5,758,709 | 665,610 |
| Mode SS | |||
|---|---|---|---|
| Quadrant | BADHDUFLAG | Total packets | Discarded packets |
| A | 0 | 170 | 0 |
| B | 0 | 170 | 0 |
| C | 0 | 170 | 0 |
| D | 0 | 170 | 0 |
| Mode M9 | |||
|---|---|---|---|
| Quadrant | BADHDUFLAG | Total packets | Discarded packets |
| A | 0 | 4 | 0 |
| B | 0 | 4 | 0 |
| C | 0 | 4 | 0 |
| D | 0 | 4 | 0 |
| Mode M0 | |||
|---|---|---|---|
| Quadrant | BADHDUFLAG | Total packets | Discarded packets |
| A | 0 | 18925 | 1 |
| B | 0 | 18937 | 1 |
| C | 0 | 20131 | 1 |
| D | 0 | 23182 | 1 |
| Quadrant | Total seconds | Saturated seconds | Saturation percentage |
|---|---|---|---|
| A | 8399 | 113 | 1.345398% |
| B | 8400 | 148 | 1.761905% |
| C | 8400 | 97 | 1.154762% |
| D | 8400 | 425 | 5.059524% |
Noise dominated data is calculated using 1-second bins in cleaned event files. If a bin has >2000 counts, and if more than 50% of those come from <1% of pixels, then it is considered to be noise-dominated and hence unusable.
| Quadrant | # 1 sec bins | Bins with >0 counts | Bins with >2000 counts | High rate bins dominated by noise | Noise dominated (total time) | Noise dominated (detector-on time) | Marked lightcurve |
|---|---|---|---|---|---|---|---|
| A | 8809 | 8400 | 52 | 52 | 0.59% | 0.62% | 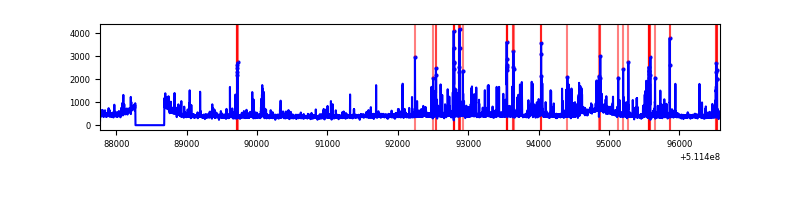 |
| B | 8810 | 8401 | 45 | 45 | 0.51% | 0.54% | 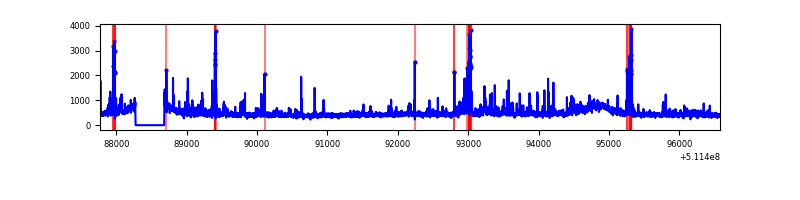 |
| C | 8810 | 8401 | 71 | 71 | 0.81% | 0.85% | 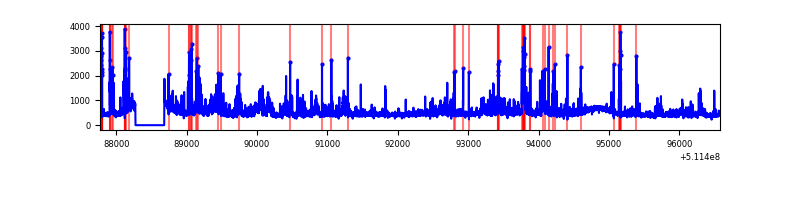 |
| D | 8810 | 8400 | 349 | 349 | 3.96% | 4.15% | 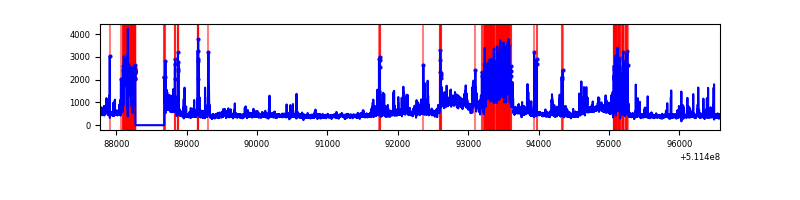 |
Top three noisy pixels from each quadrant. If the there are fewer than three noisy pixels in the level2.evt file, extra rows are filled as -1
| Pixel properties | Quadrant properties | ||||||
|---|---|---|---|---|---|---|---|
| Quadrant | DetID | PixID | Counts | Sigma | Mean | Median | Sigma |
| A | 10 | 251 | 538159 | 2414.98 | 906 | 881 | 222.5 |
| A | 13 | 248 | 47669 | 210.3 | 906 | 881 | 222.5 |
| A | 6 | 179 | 42218 | 185.8 | 906 | 881 | 222.5 |
| B | 4 | 206 | 145066 | 748.33 | 903 | 870 | 192.7 |
| B | 5 | 185 | 132617 | 683.72 | 903 | 870 | 192.7 |
| B | 8 | 128 | 119876 | 617.6 | 903 | 870 | 192.7 |
| C | 12 | 252 | 544656 | 2297.01 | 879 | 866 | 236.7 |
| C | 13 | 3 | 401507 | 1692.34 | 879 | 866 | 236.7 |
| C | 9 | 38 | 231412 | 973.84 | 879 | 866 | 236.7 |
| D | 2 | 249 | 910513 | 3780.43 | 854 | 816 | 240.6 |
| D | 14 | 49 | 386255 | 1601.77 | 854 | 816 | 240.6 |
| D | 3 | 12 | 379558 | 1573.94 | 854 | 816 | 240.6 |
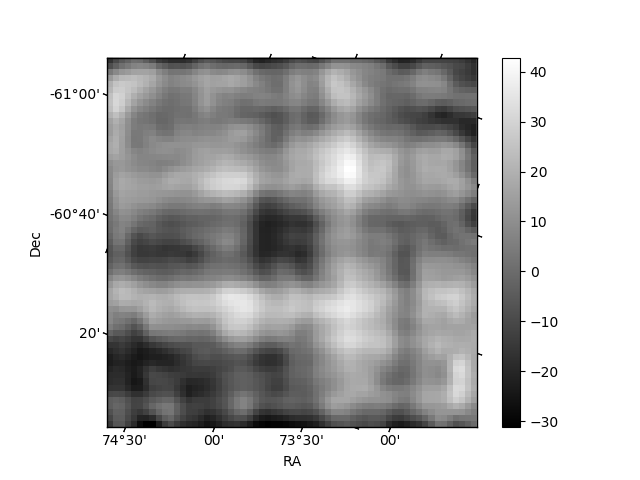
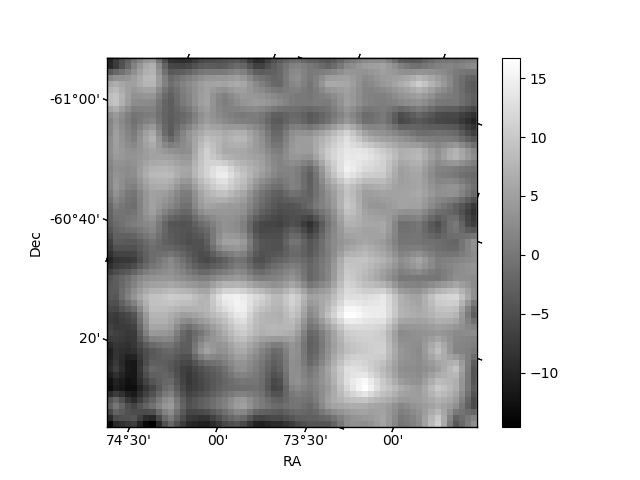
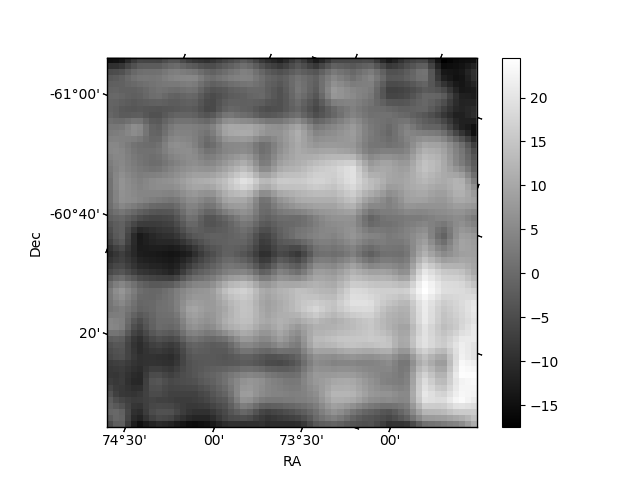
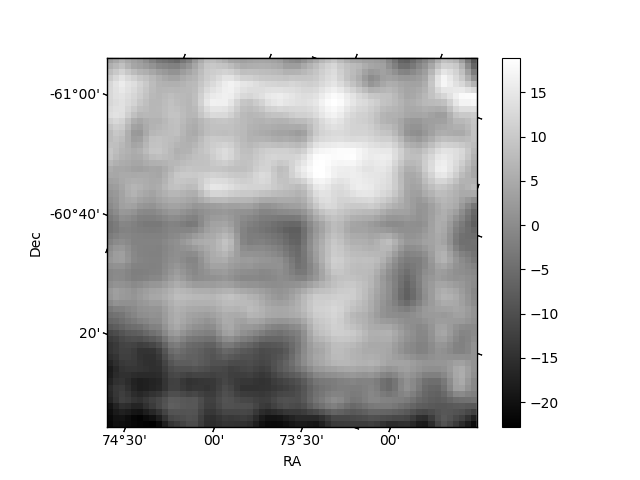
Histogram calculated using DETX and DETY for each event in the final _common_clean file
| Quadrant A | 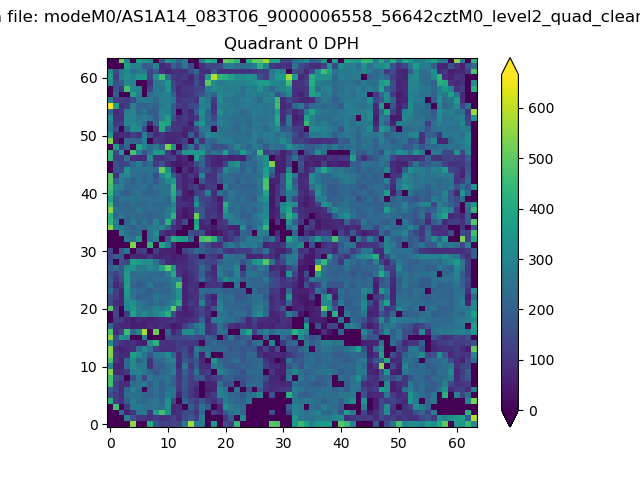 |
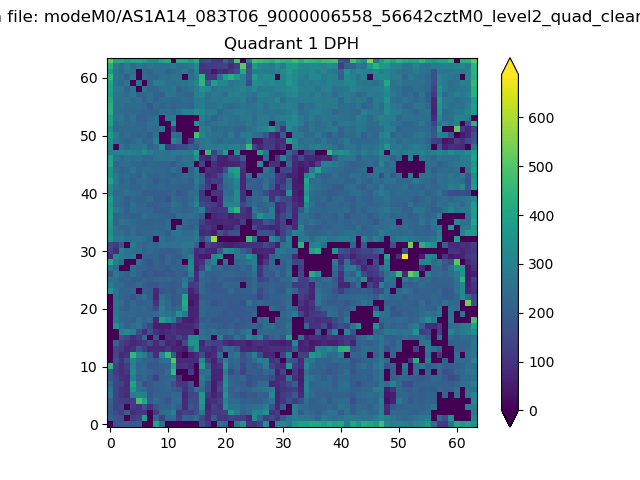 |
Quadrant B |
|---|---|---|---|
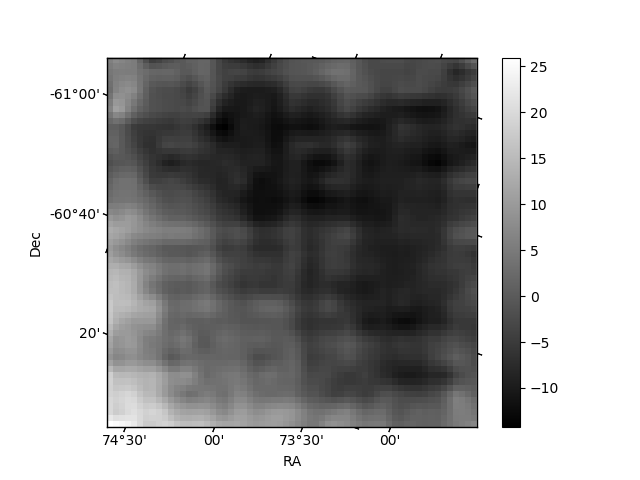
| Quadrant D | 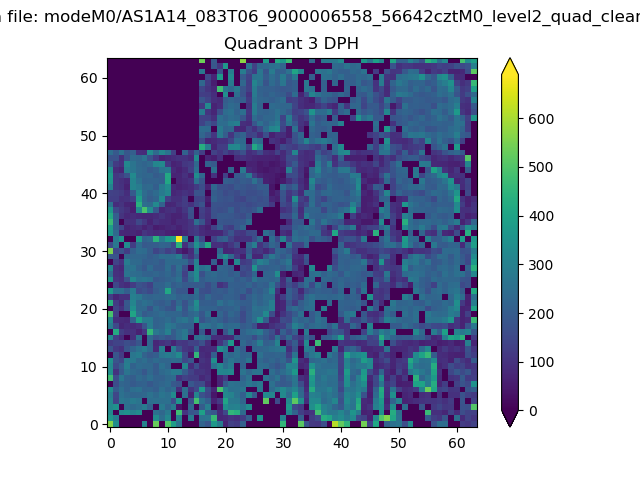 |
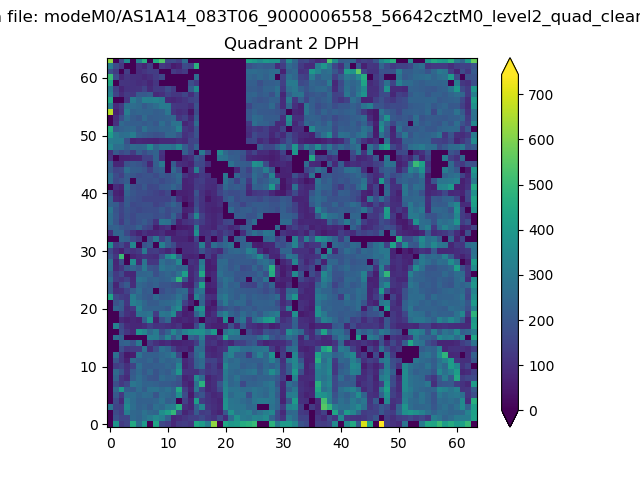 |
Quadrant C |
| Plot type | Count rate plots | Images |
|---|---|---|
| Comparison with Poisson distribution Blue bars denote a histogram of data divided into 1 sec bins. Red curve is a Poisson curve with rate = median count rate of data. |
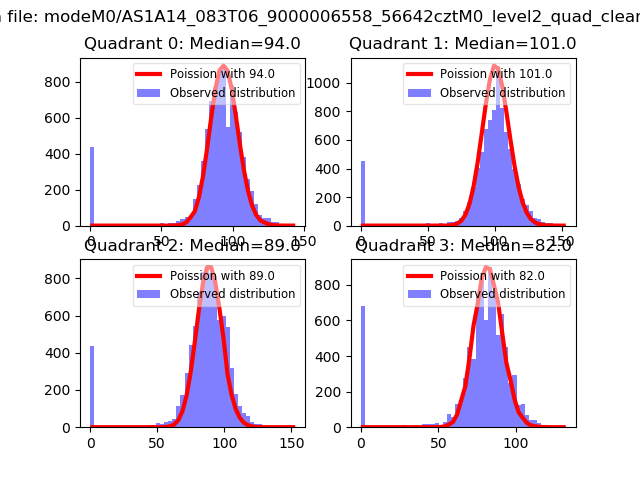 |
 |
| Quadrant-wise count rates Data is divided into 100 sec bins |
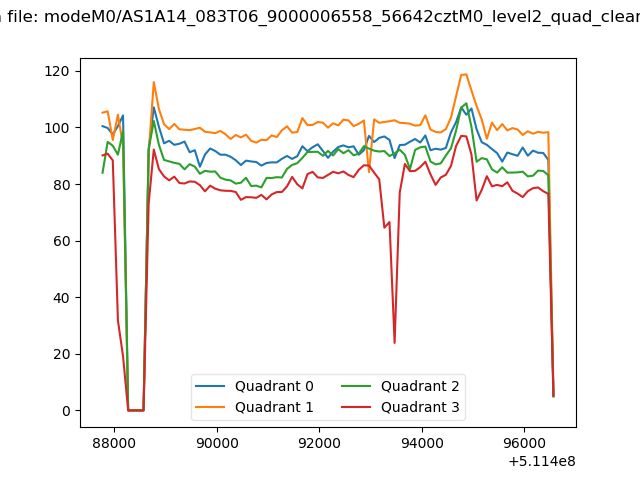 |
|
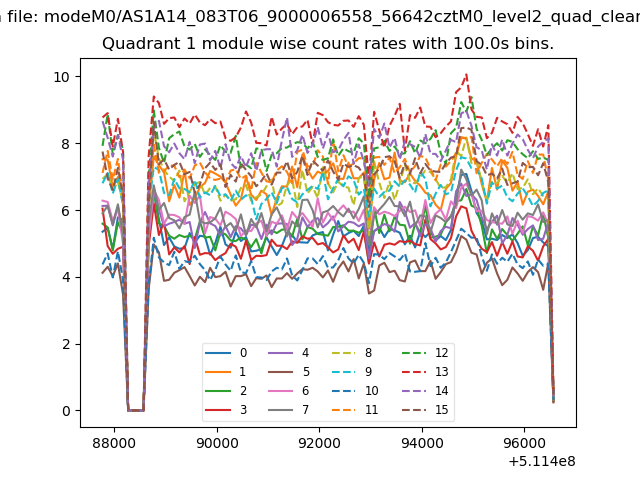
| Module-wise count rates for Quadrant A Data is divided into 100 sec bins |
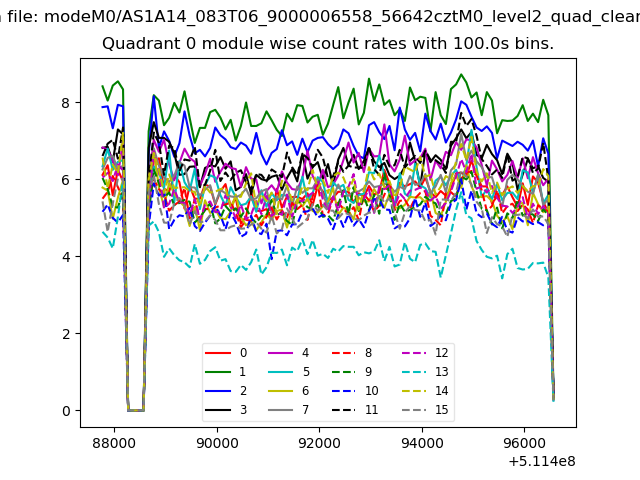 |
 |
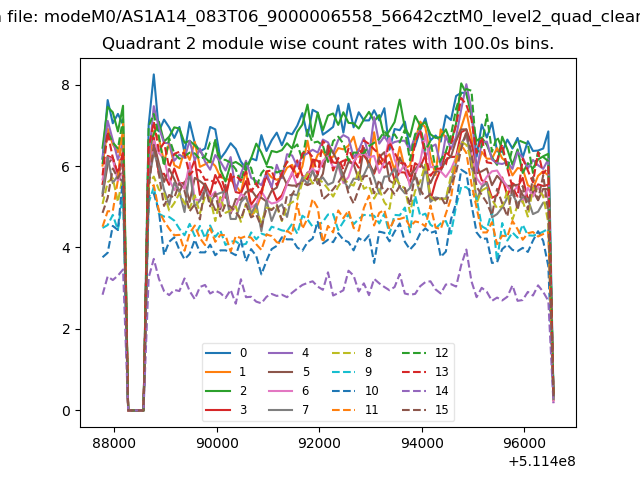
| Module-wise count rates for Quadrant B Data is divided into 100 sec bins |
 |
 |
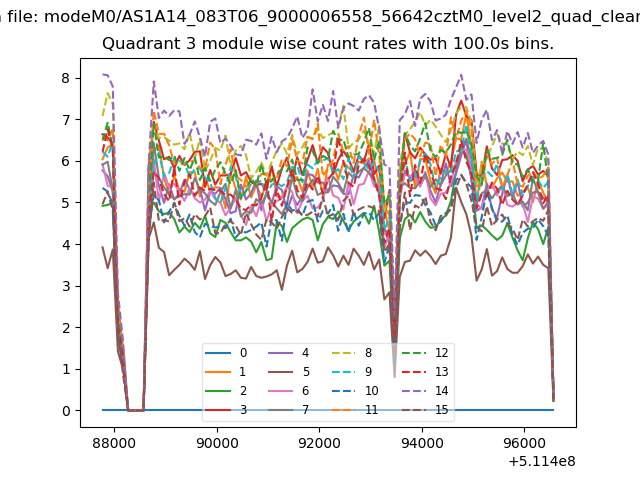
| Module-wise count rates for Quadrant C Data is divided into 100 sec bins |
 |
 |
| Module-wise count rates for Quadrant D Data is divided into 100 sec bins |
 |
 |
| Parameter | Plot |
|---|---|
| CZT HV Monitor | 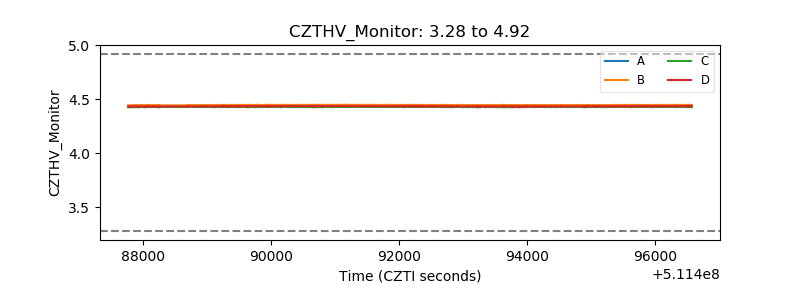 |
| D_VDD | 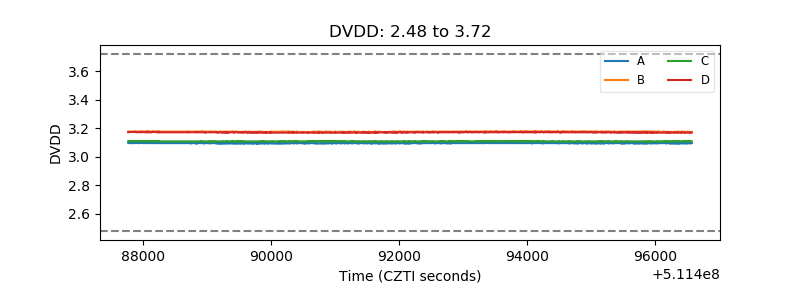 |
| Temperature 1 | 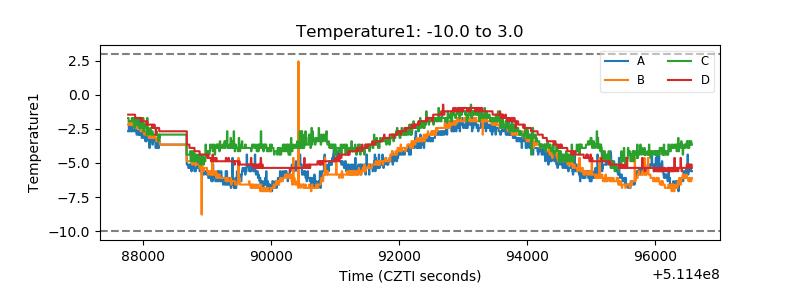 |
| Veto HV Monitor | 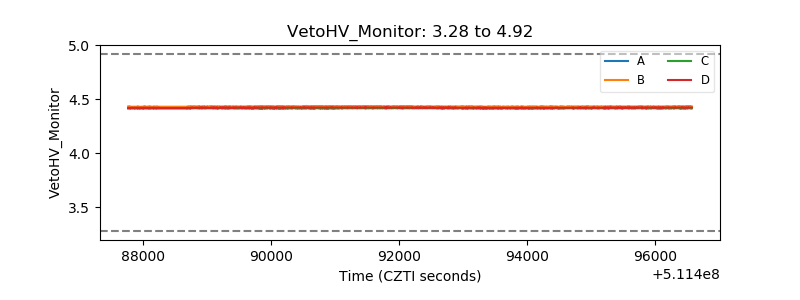 |
| Veto LLD | 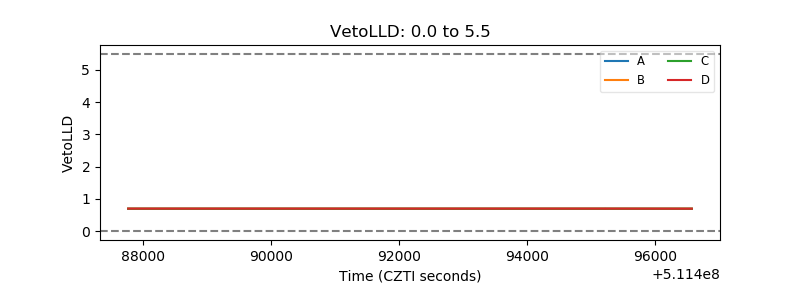 |
| Alpha Counter | 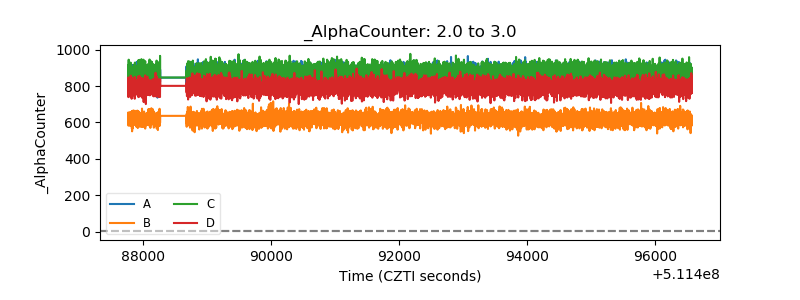 |
| _CPM_Rate | 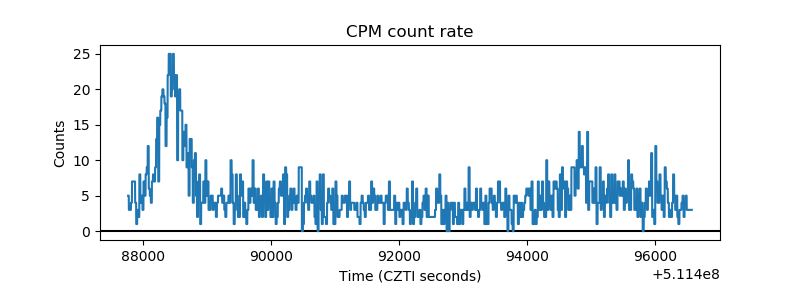 |
| CZT Counter | 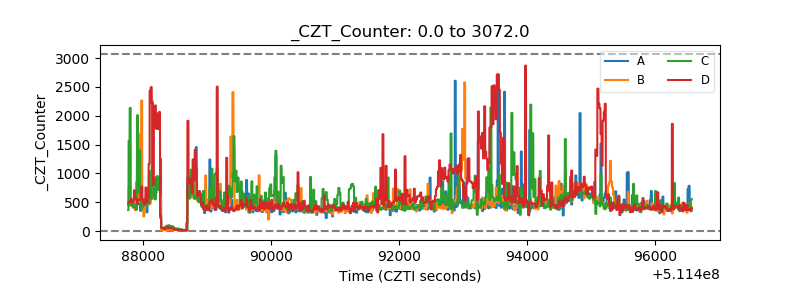 |
| +2.5 Volts monitor |  |
| +5 Volts monitor |  |
| _ROLL_ROT | 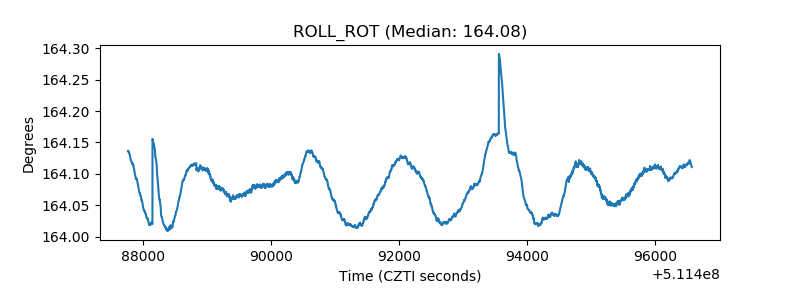 |
| _Roll_DEC | 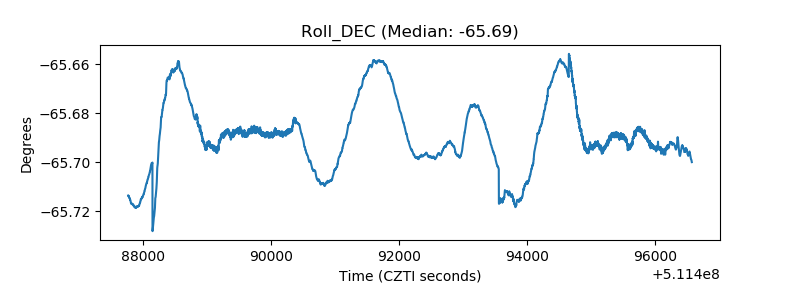 |
| _Roll_RA | 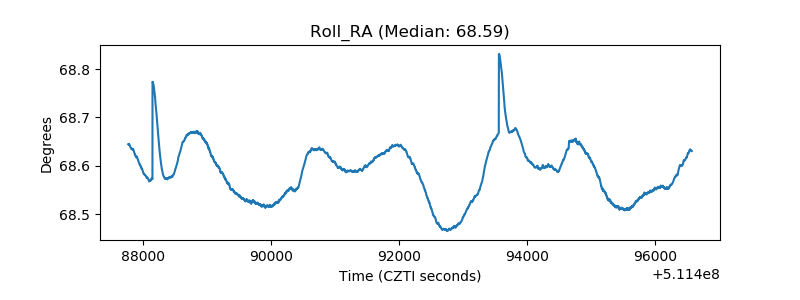 |
| Veto Counter | 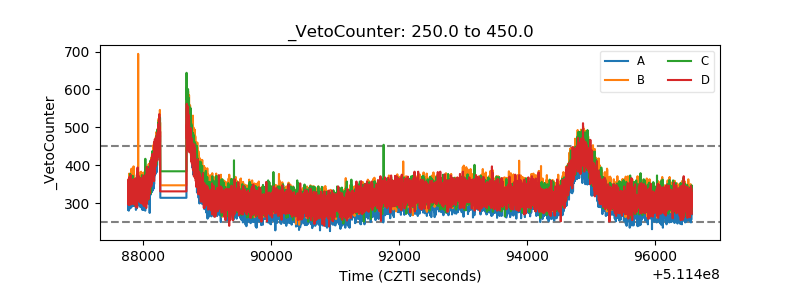 |