| Param | Original file | Final file |
|---|---|---|
| Filename | modeM0/AS1A14_083T06_9000006558_56643cztM0_level2.fits | modeM0/AS1A14_083T06_9000006558_56643cztM0_level2_quad_clean.evt |
| Size (bytes) | 531,743,040 | 129,340,800 |
| Size | 507.1 MB | 123.3 MB |
| Events in quadrant A | 4,465,304 | 846,195 |
| Events in quadrant B | 4,437,292 | 913,019 |
| Events in quadrant C | 5,165,194 | 788,404 |
| Events in quadrant D | 4,913,973 | 741,902 |
| Mode SS | |||
|---|---|---|---|
| Quadrant | BADHDUFLAG | Total packets | Discarded packets |
| A | 0 | 180 | 0 |
| B | 0 | 180 | 0 |
| C | 0 | 180 | 0 |
| D | 0 | 180 | 0 |
| Mode M0 | |||
|---|---|---|---|
| Quadrant | BADHDUFLAG | Total packets | Discarded packets |
| A | 0 | 20085 | 0 |
| B | 0 | 19715 | 0 |
| C | 0 | 21787 | 0 |
| D | 0 | 21113 | 0 |
| Quadrant | Total seconds | Saturated seconds | Saturation percentage |
|---|---|---|---|
| A | 9033 | 76 | 0.841359% |
| B | 9034 | 65 | 0.719504% |
| C | 9034 | 162 | 1.793226% |
| D | 9034 | 103 | 1.140137% |
Noise dominated data is calculated using 1-second bins in cleaned event files. If a bin has >2000 counts, and if more than 50% of those come from <1% of pixels, then it is considered to be noise-dominated and hence unusable.
| Quadrant | # 1 sec bins | Bins with >0 counts | Bins with >2000 counts | High rate bins dominated by noise | Noise dominated (total time) | Noise dominated (detector-on time) | Marked lightcurve |
|---|---|---|---|---|---|---|---|
| A | 9033 | 9033 | 54 | 54 | 0.60% | 0.60% | 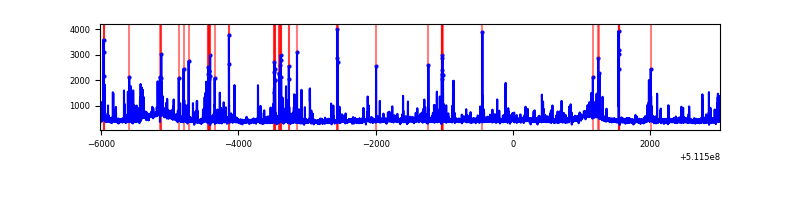 |
| B | 9034 | 9034 | 20 | 20 | 0.22% | 0.22% | 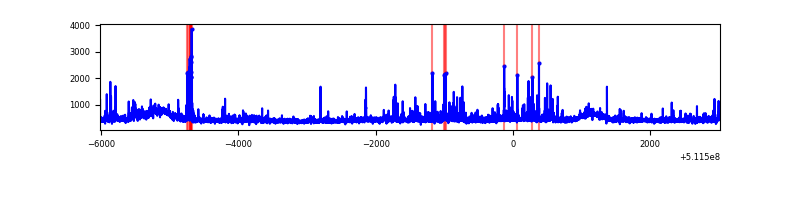 |
| C | 9034 | 9034 | 144 | 144 | 1.59% | 1.59% | 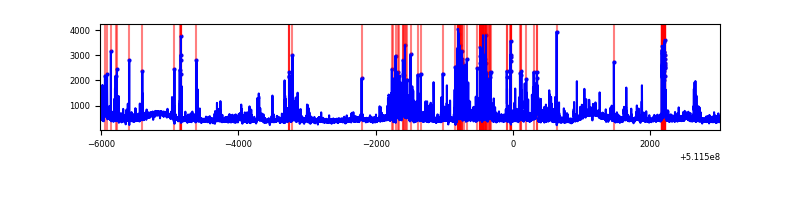 |
| D | 9034 | 9034 | 91 | 91 | 1.01% | 1.01% | 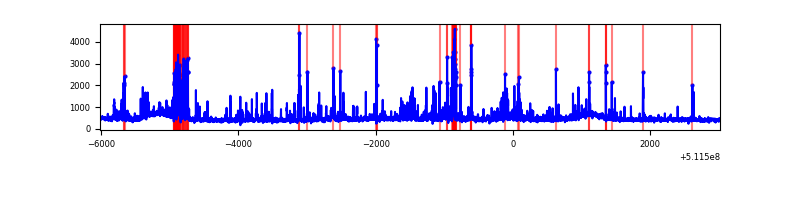 |
Top three noisy pixels from each quadrant. If the there are fewer than three noisy pixels in the level2.evt file, extra rows are filled as -1
| Pixel properties | Quadrant properties | ||||||
|---|---|---|---|---|---|---|---|
| Quadrant | DetID | PixID | Counts | Sigma | Mean | Median | Sigma |
| A | 10 | 251 | 472614 | 1981.72 | 968 | 943 | 238.0 |
| A | 0 | 8 | 96862 | 403.0 | 968 | 943 | 238.0 |
| A | 13 | 248 | 62805 | 259.91 | 968 | 943 | 238.0 |
| B | 4 | 206 | 149090 | 711.68 | 969 | 933 | 208.2 |
| B | 4 | 21 | 128046 | 610.59 | 969 | 933 | 208.2 |
| B | 10 | 247 | 67588 | 320.18 | 969 | 933 | 208.2 |
| C | 13 | 3 | 403249 | 1577.86 | 940 | 932 | 255.0 |
| C | 6 | 223 | 321192 | 1256.04 | 940 | 932 | 255.0 |
| C | 12 | 252 | 150273 | 585.71 | 940 | 932 | 255.0 |
| D | 2 | 249 | 497569 | 1902.77 | 932 | 892 | 261.0 |
| D | 7 | 96 | 170408 | 649.42 | 932 | 892 | 261.0 |
| D | 2 | 62 | 125130 | 475.96 | 932 | 892 | 261.0 |
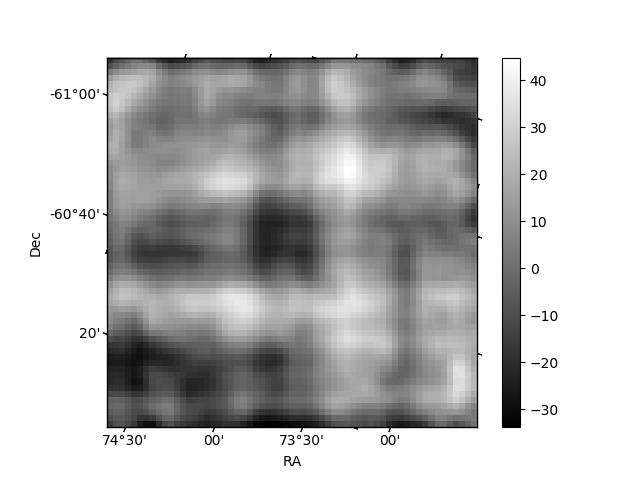
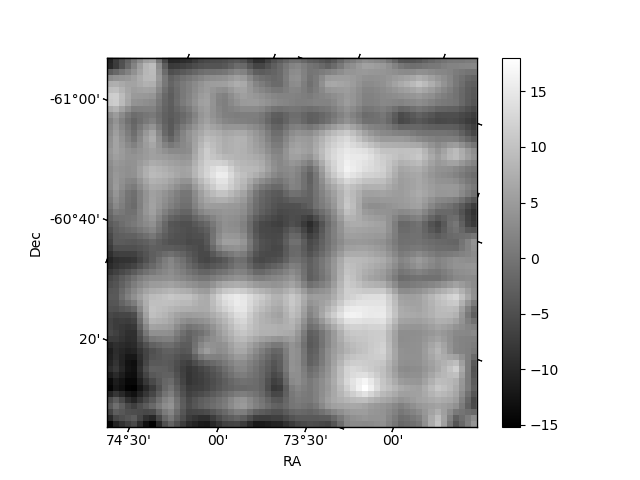
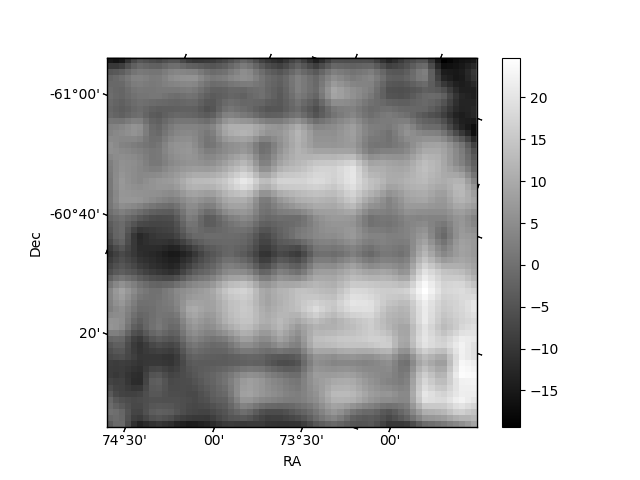
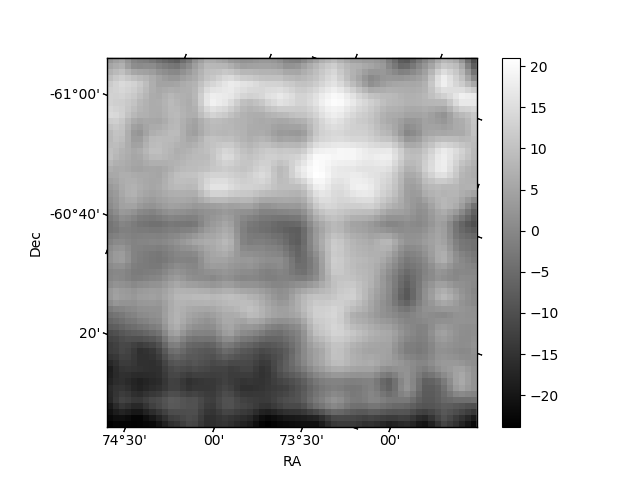
Histogram calculated using DETX and DETY for each event in the final _common_clean file
| Quadrant A | 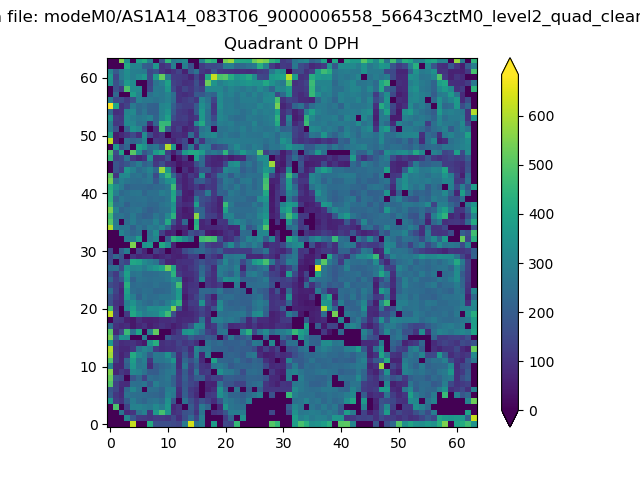 |
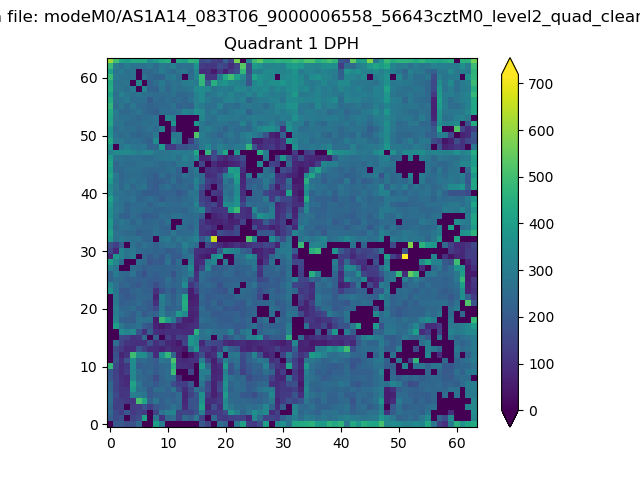 |
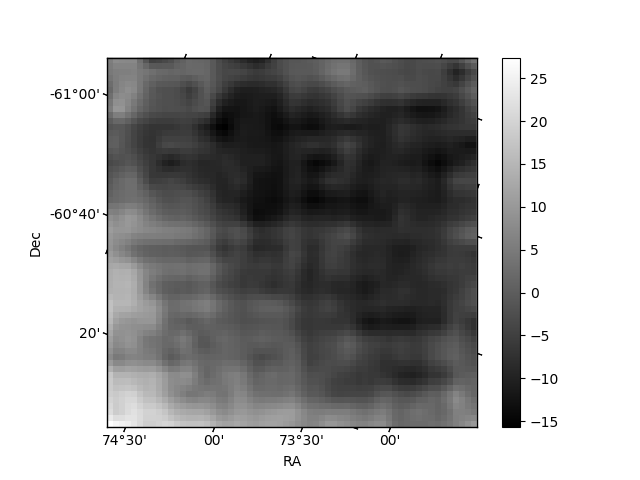
Quadrant B |
|---|---|---|---|
| Quadrant D | 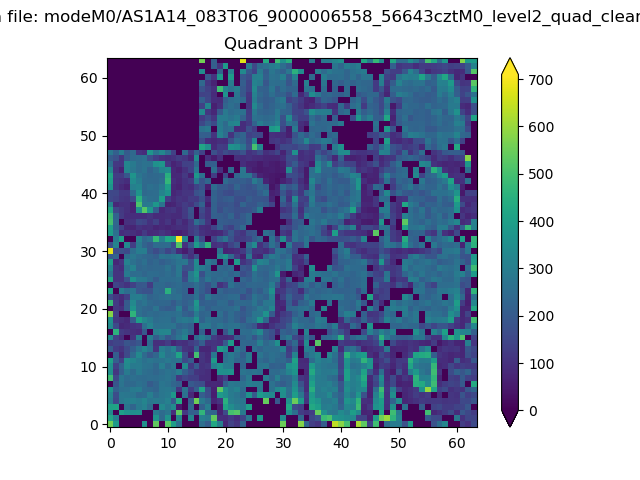 |
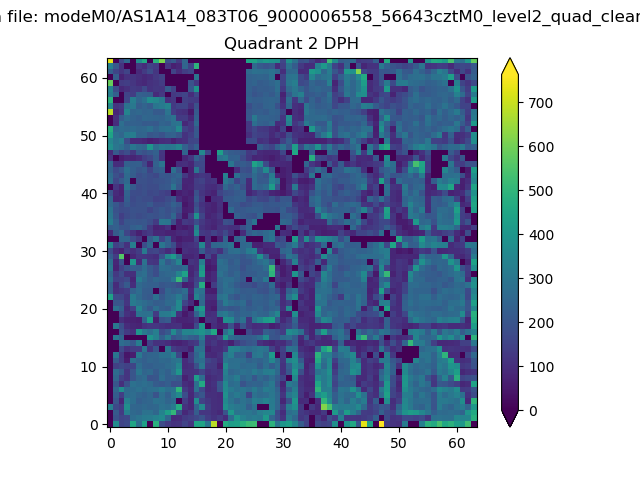 |
Quadrant C |
| Plot type | Count rate plots | Images |
|---|---|---|
| Comparison with Poisson distribution Blue bars denote a histogram of data divided into 1 sec bins. Red curve is a Poisson curve with rate = median count rate of data. |
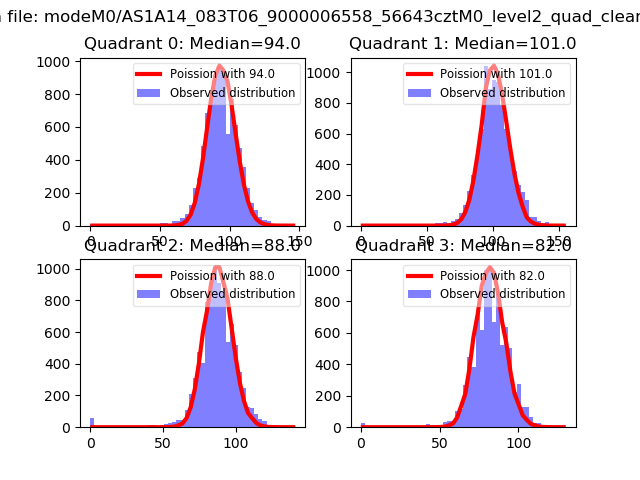 |
 |
| Quadrant-wise count rates Data is divided into 100 sec bins |
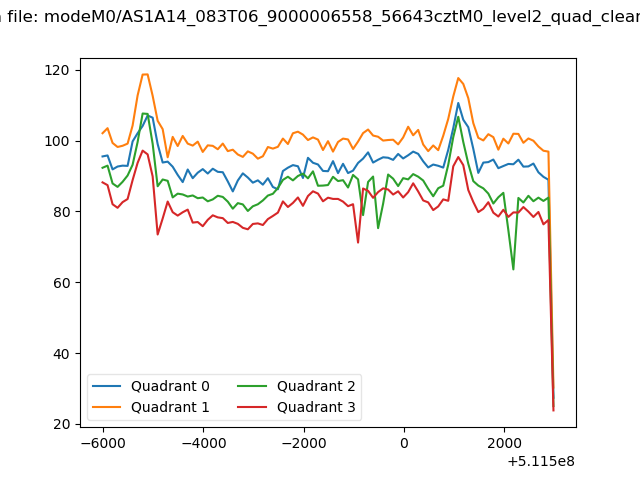 |
|
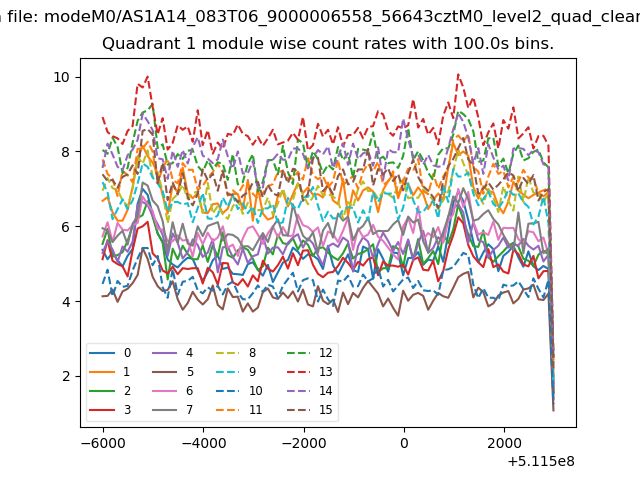
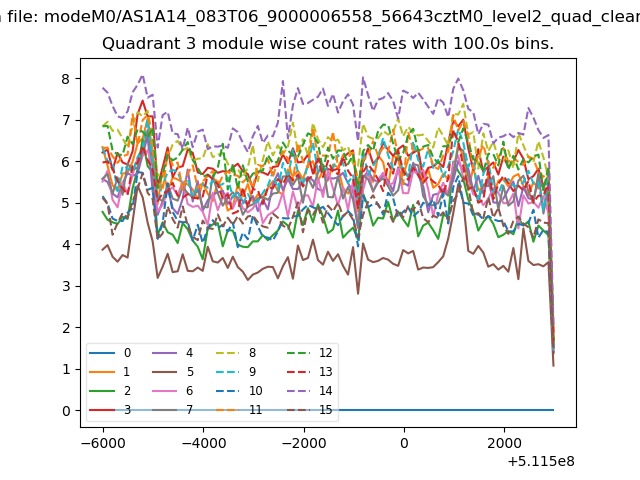
| Module-wise count rates for Quadrant A Data is divided into 100 sec bins |
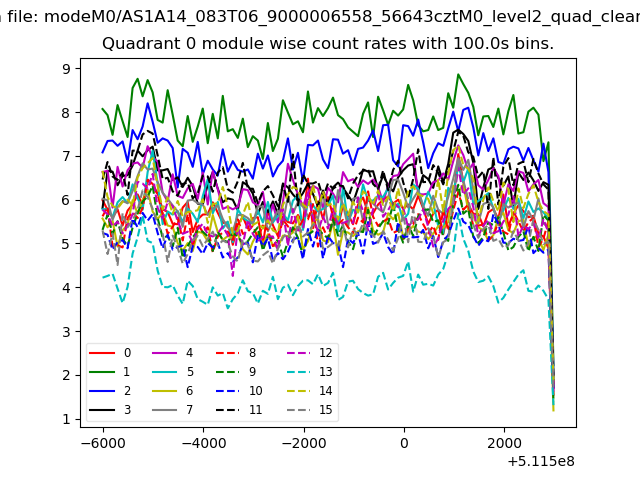 |
 |
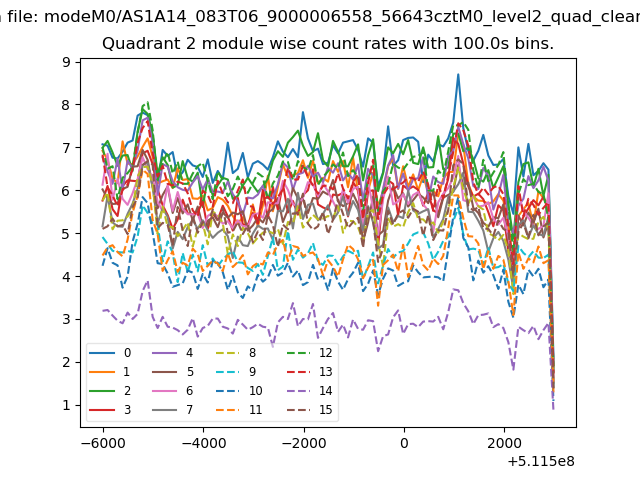
| Module-wise count rates for Quadrant B Data is divided into 100 sec bins |
 |
 |
| Module-wise count rates for Quadrant C Data is divided into 100 sec bins |
 |
 |
| Module-wise count rates for Quadrant D Data is divided into 100 sec bins |
 |
 |
| Parameter | Plot |
|---|---|
| CZT HV Monitor | 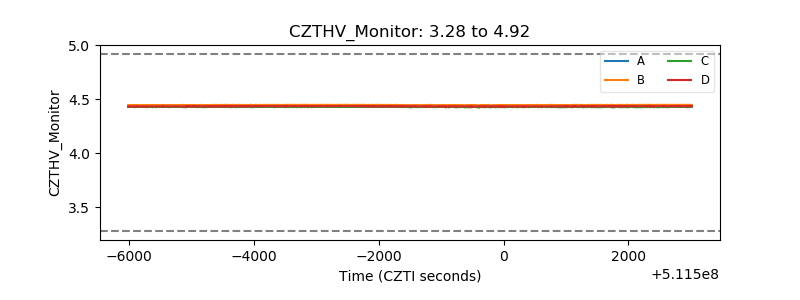 |
| D_VDD | 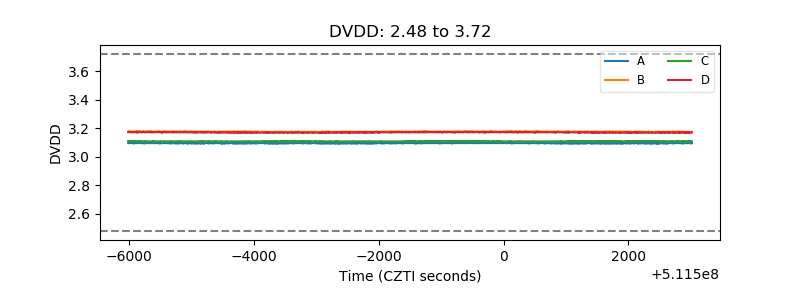 |
| Temperature 1 | 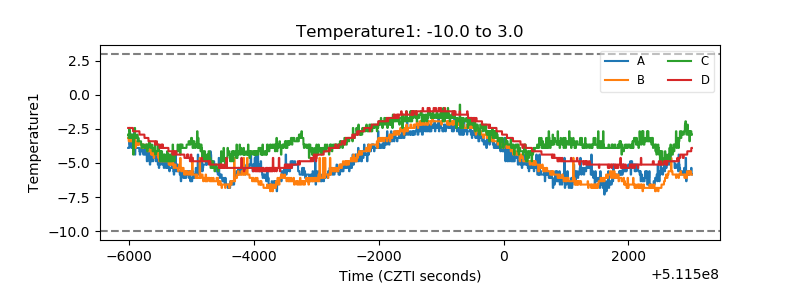 |
| Veto HV Monitor | 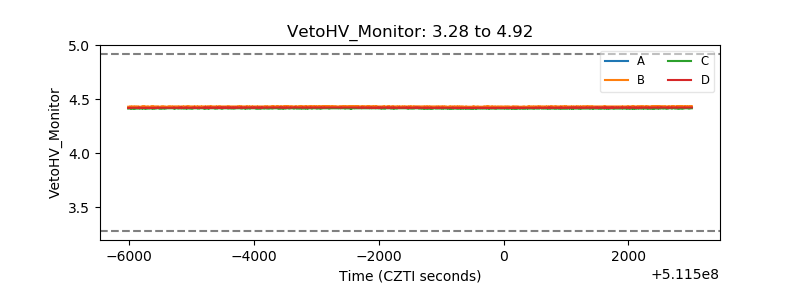 |
| Veto LLD | 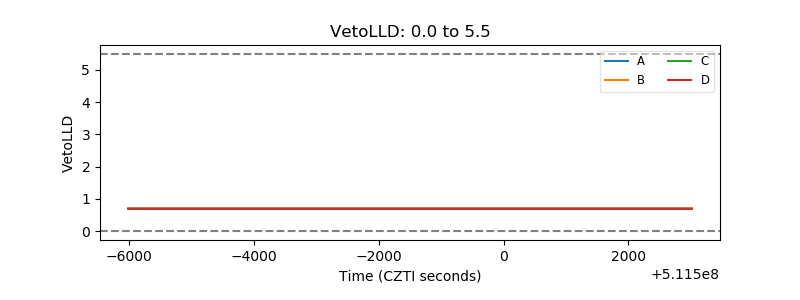 |
| Alpha Counter | 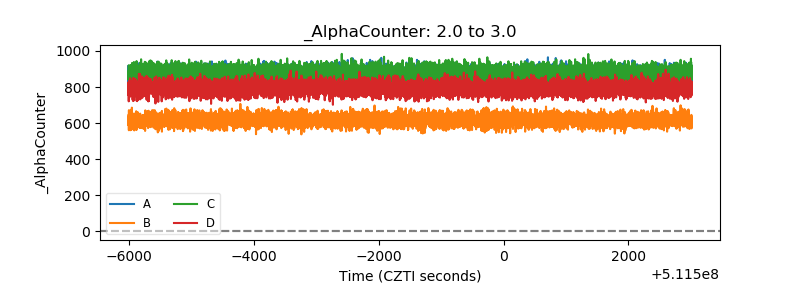 |
| _CPM_Rate | 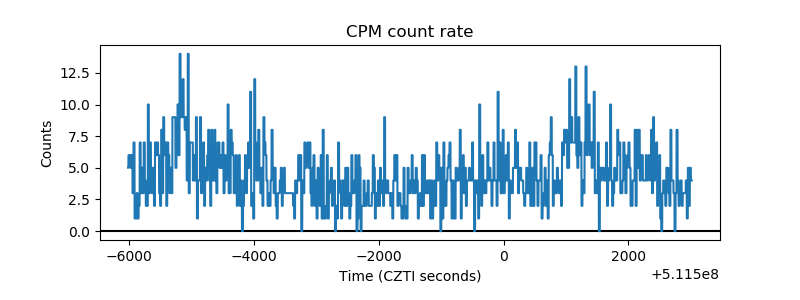 |
| CZT Counter | 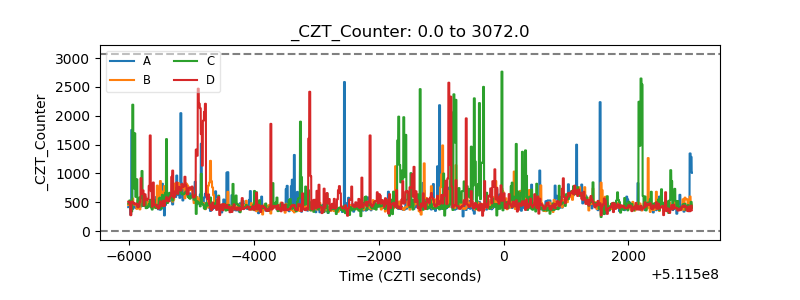 |
| +2.5 Volts monitor |  |
| +5 Volts monitor |  |
| _ROLL_ROT | 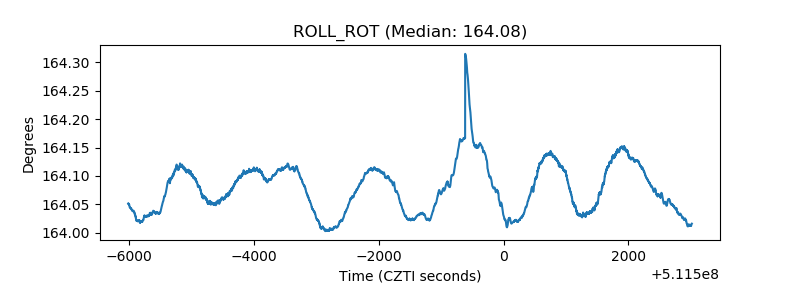 |
| _Roll_DEC | 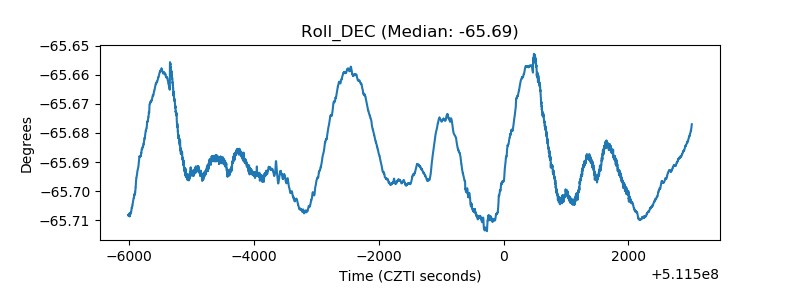 |
| _Roll_RA | 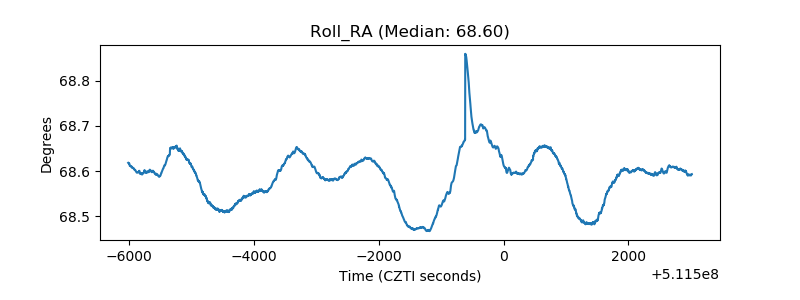 |
| Veto Counter | 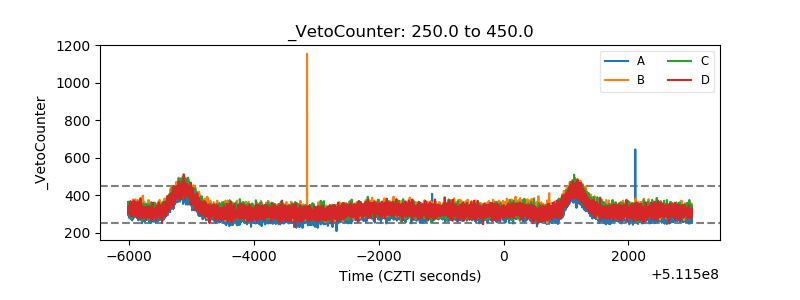 |