| Param | Original file | Final file |
|---|---|---|
| Filename | modeM0/AS1A14_083T06_9000006558_56647cztM0_level2.fits | modeM0/AS1A14_083T06_9000006558_56647cztM0_level2_quad_clean.evt |
| Size (bytes) | 531,244,800 | 94,559,040 |
| Size | 506.6 MB | 90.2 MB |
| Events in quadrant A | 4,236,546 | 610,351 |
| Events in quadrant B | 5,605,133 | 646,690 |
| Events in quadrant C | 3,702,241 | 599,664 |
| Events in quadrant D | 5,591,777 | 531,284 |
| Mode SS | |||
|---|---|---|---|
| Quadrant | BADHDUFLAG | Total packets | Discarded packets |
| A | 0 | 138 | 0 |
| B | 0 | 138 | 0 |
| C | 0 | 138 | 0 |
| D | 0 | 138 | 0 |
| Mode M9 | |||
|---|---|---|---|
| Quadrant | BADHDUFLAG | Total packets | Discarded packets |
| A | 0 | 8 | 0 |
| B | 0 | 8 | 0 |
| C | 0 | 8 | 0 |
| D | 0 | 8 | 0 |
| Mode M0 | |||
|---|---|---|---|
| Quadrant | BADHDUFLAG | Total packets | Discarded packets |
| A | 0 | 17602 | 1 |
| B | 0 | 21311 | 1 |
| C | 0 | 16055 | 1 |
| D | 0 | 21290 | 1 |
| Quadrant | Total seconds | Saturated seconds | Saturation percentage |
|---|---|---|---|
| A | 6816 | 391 | 5.736502% |
| B | 6816 | 571 | 8.377347% |
| C | 6817 | 209 | 3.065865% |
| D | 6817 | 638 | 9.358956% |
Noise dominated data is calculated using 1-second bins in cleaned event files. If a bin has >2000 counts, and if more than 50% of those come from <1% of pixels, then it is considered to be noise-dominated and hence unusable.
| Quadrant | # 1 sec bins | Bins with >0 counts | Bins with >2000 counts | High rate bins dominated by noise | Noise dominated (total time) | Noise dominated (detector-on time) | Marked lightcurve |
|---|---|---|---|---|---|---|---|
| A | 7576 | 6816 | 275 | 275 | 3.63% | 4.03% | 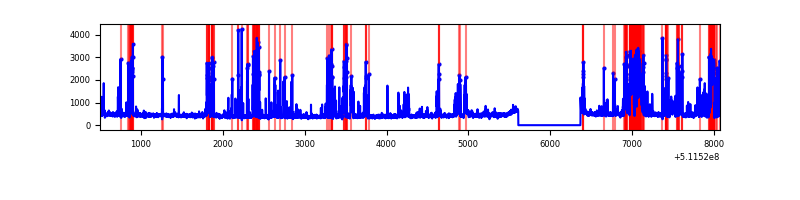 |
| B | 7576 | 6816 | 311 | 311 | 4.11% | 4.56% | 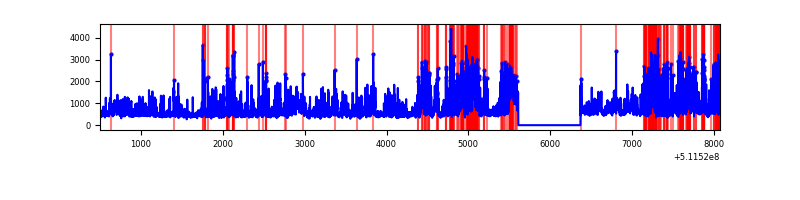 |
| C | 7577 | 6817 | 109 | 109 | 1.44% | 1.60% | 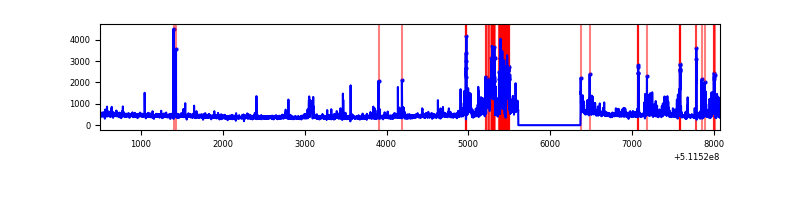 |
| D | 7576 | 6816 | 518 | 518 | 6.84% | 7.60% | 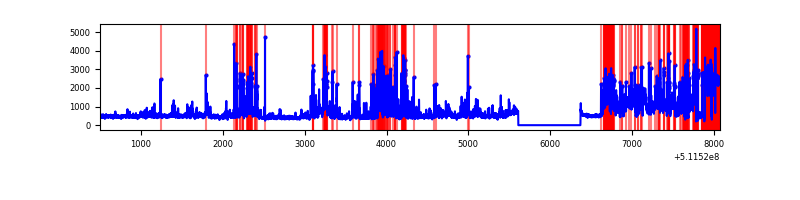 |
Top three noisy pixels from each quadrant. If the there are fewer than three noisy pixels in the level2.evt file, extra rows are filled as -1
| Pixel properties | Quadrant properties | ||||||
|---|---|---|---|---|---|---|---|
| Quadrant | DetID | PixID | Counts | Sigma | Mean | Median | Sigma |
| A | 0 | 8 | 712606 | 4038.01 | 719 | 698 | 176.3 |
| A | 7 | 64 | 341455 | 1932.81 | 719 | 698 | 176.3 |
| A | 4 | 249 | 214821 | 1214.53 | 719 | 698 | 176.3 |
| B | 5 | 185 | 1582917 | 10484.07 | 702 | 676 | 150.9 |
| B | 4 | 206 | 743131 | 4919.57 | 702 | 676 | 150.9 |
| B | 4 | 21 | 293117 | 1937.74 | 702 | 676 | 150.9 |
| C | 12 | 252 | 348933 | 1796.06 | 707 | 699 | 193.9 |
| C | 1 | 16 | 258420 | 1329.23 | 707 | 699 | 193.9 |
| C | 13 | 3 | 108090 | 553.88 | 707 | 699 | 193.9 |
| D | 2 | 62 | 1480549 | 7663.07 | 689 | 658 | 193.1 |
| D | 2 | 249 | 984062 | 5092.19 | 689 | 658 | 193.1 |
| D | 8 | 129 | 146901 | 757.27 | 689 | 658 | 193.1 |
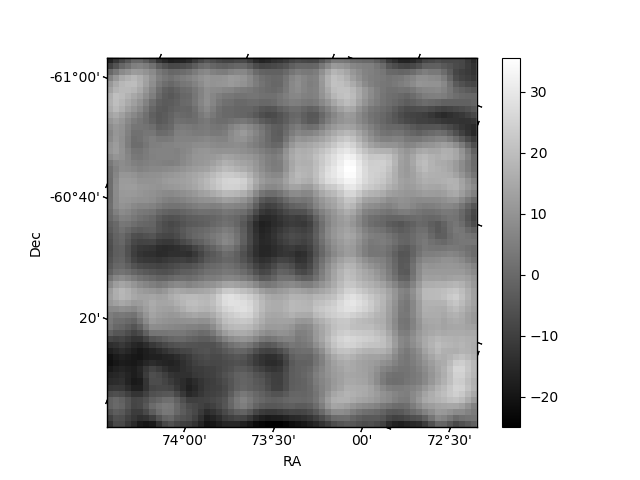
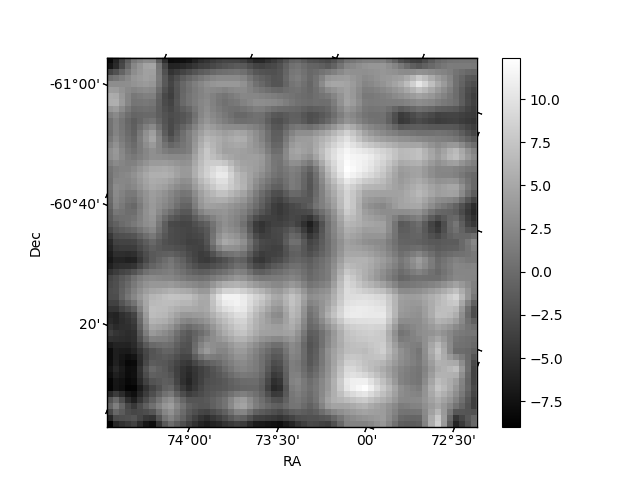
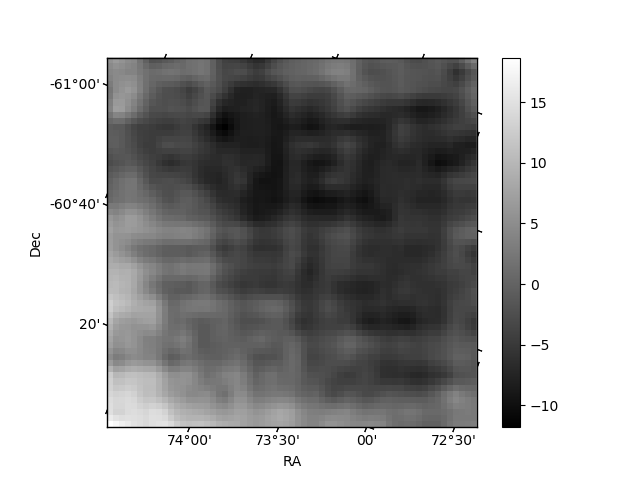
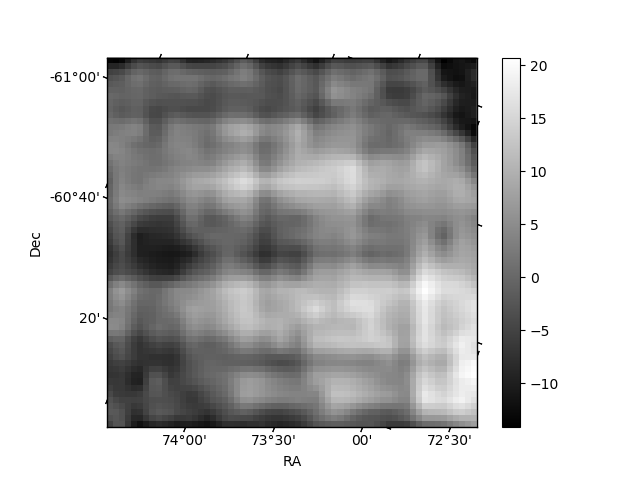
Histogram calculated using DETX and DETY for each event in the final _common_clean file
| Quadrant A | 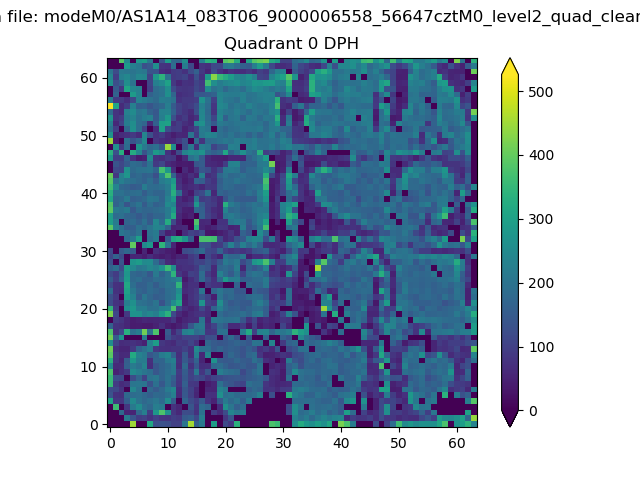 |
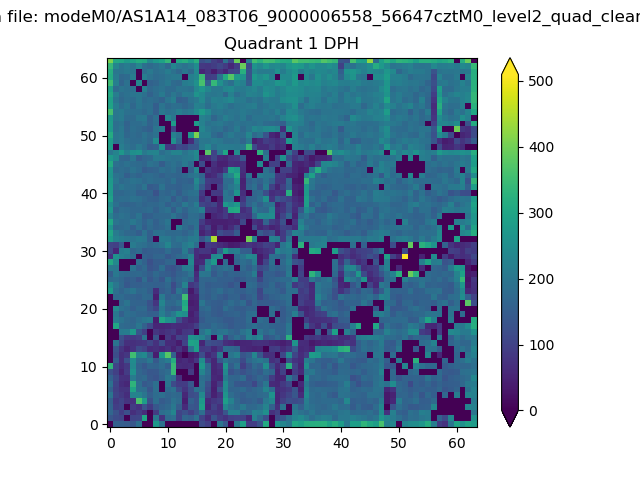 |
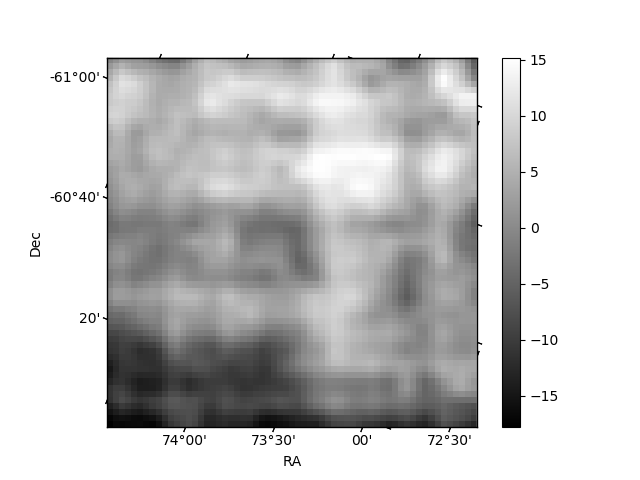
Quadrant B |
|---|---|---|---|
| Quadrant D | 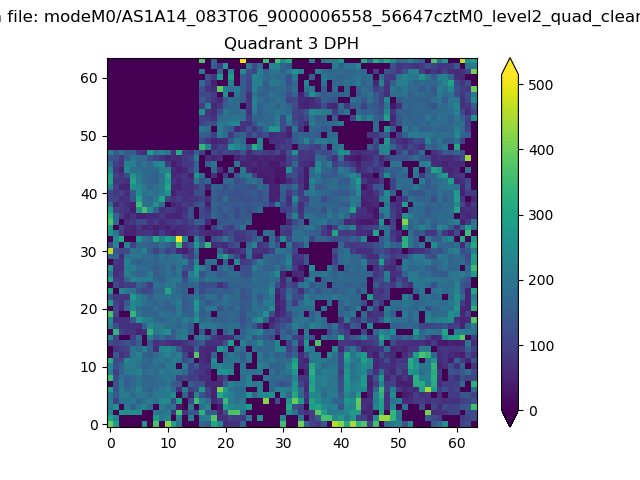 |
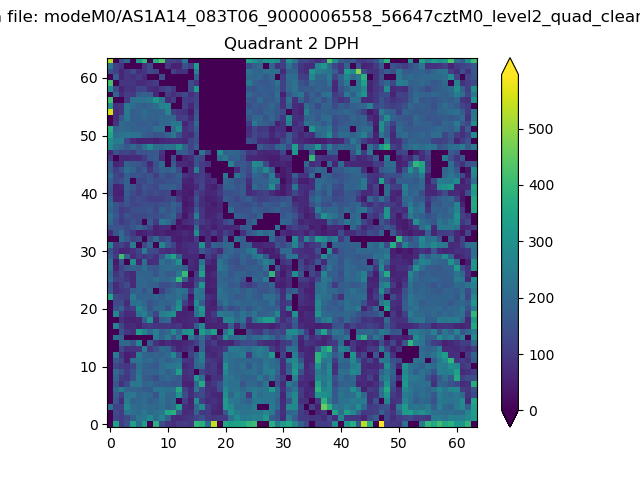 |
Quadrant C |
| Plot type | Count rate plots | Images |
|---|---|---|
| Comparison with Poisson distribution Blue bars denote a histogram of data divided into 1 sec bins. Red curve is a Poisson curve with rate = median count rate of data. |
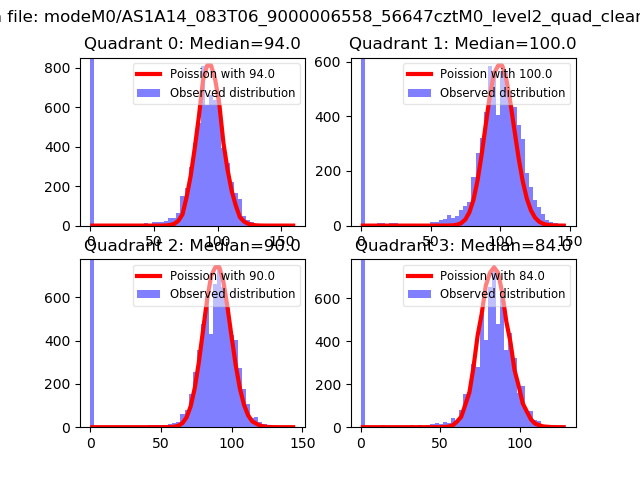 |
 |
| Quadrant-wise count rates Data is divided into 100 sec bins |
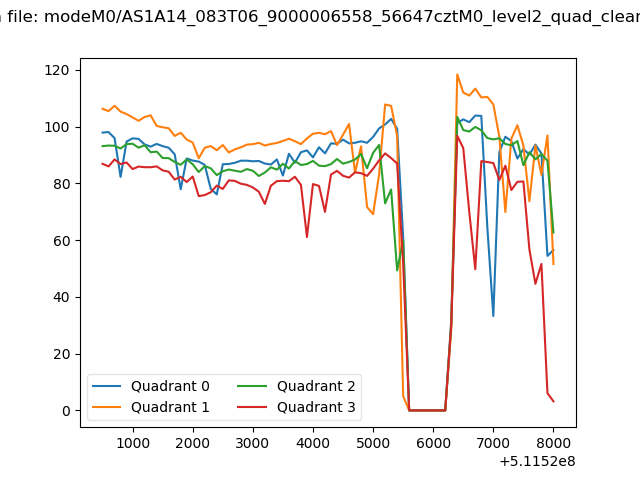 |
|
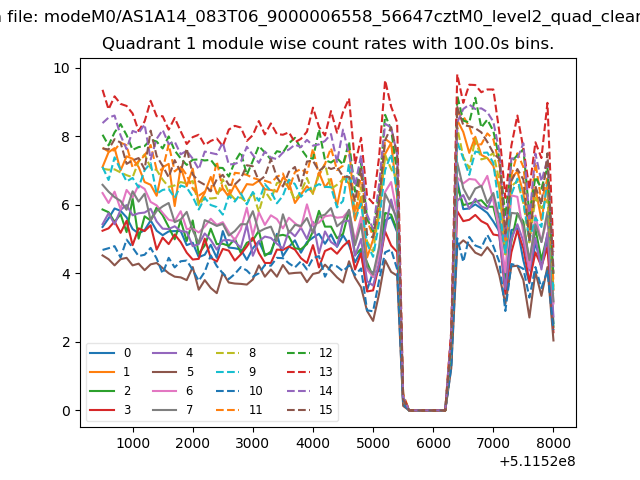
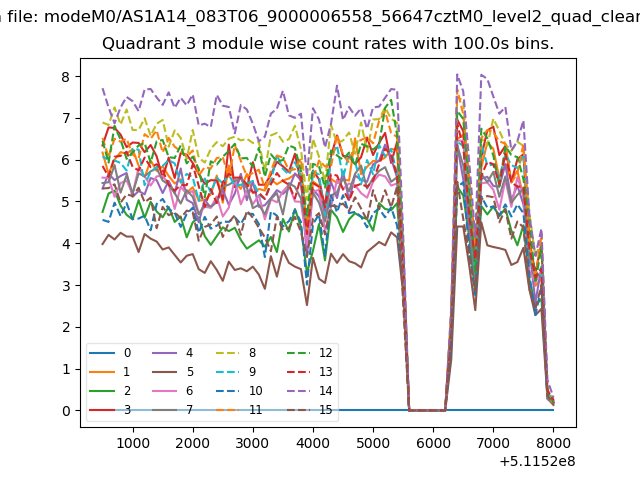
| Module-wise count rates for Quadrant A Data is divided into 100 sec bins |
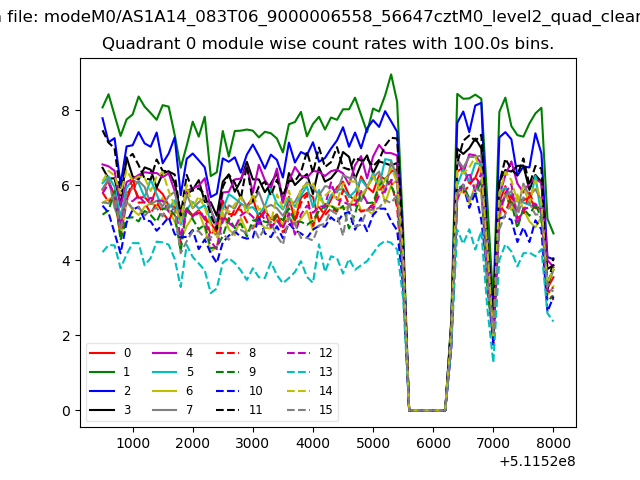 |
 |
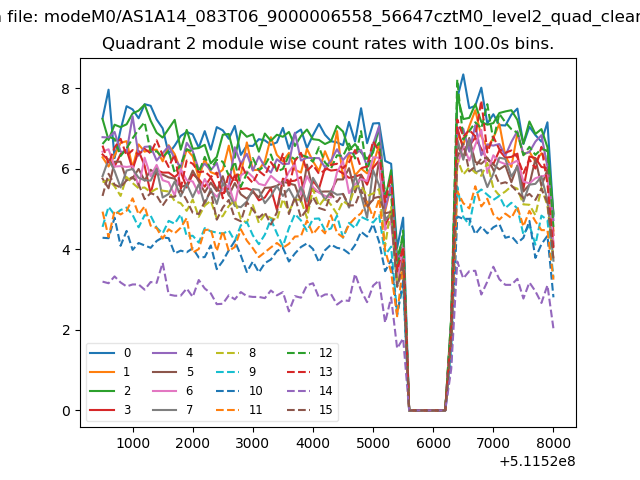
| Module-wise count rates for Quadrant B Data is divided into 100 sec bins |
 |
 |
| Module-wise count rates for Quadrant C Data is divided into 100 sec bins |
 |
 |
| Module-wise count rates for Quadrant D Data is divided into 100 sec bins |
 |
 |
| Parameter | Plot |
|---|---|
| CZT HV Monitor | 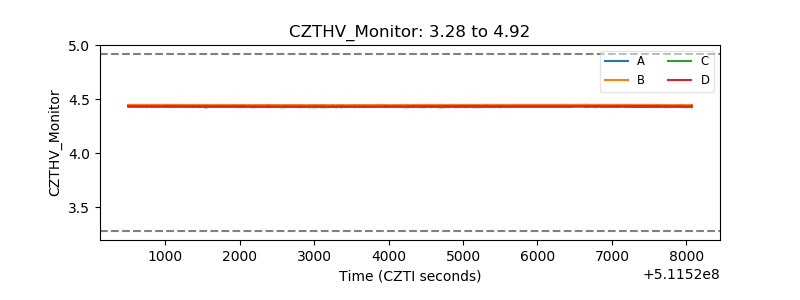 |
| D_VDD | 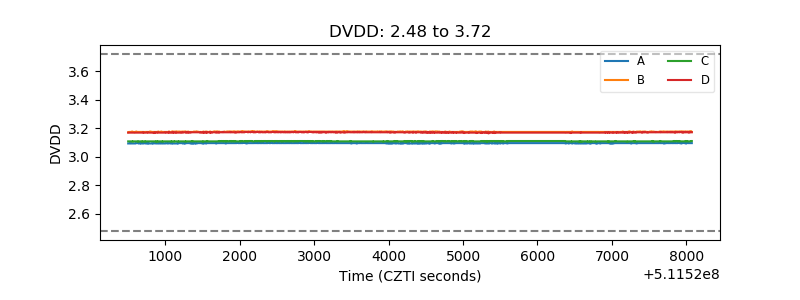 |
| Temperature 1 | 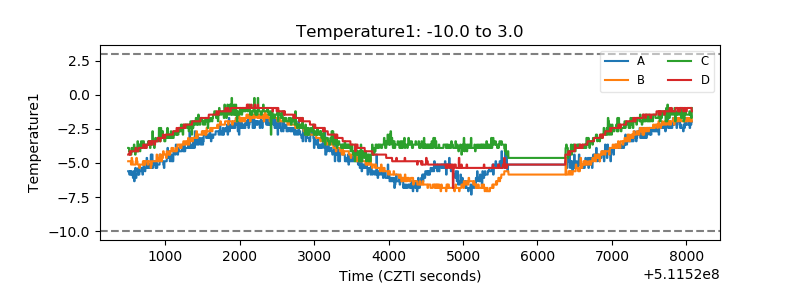 |
| Veto HV Monitor | 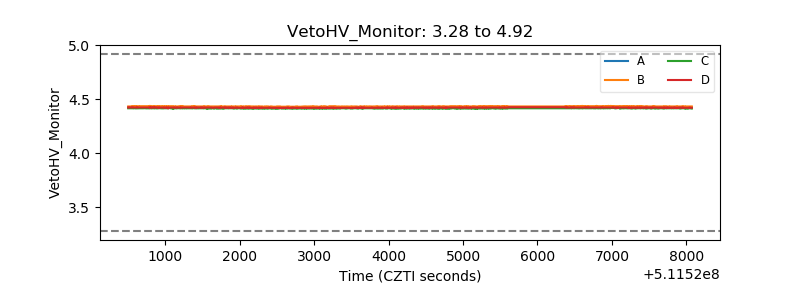 |
| Veto LLD | 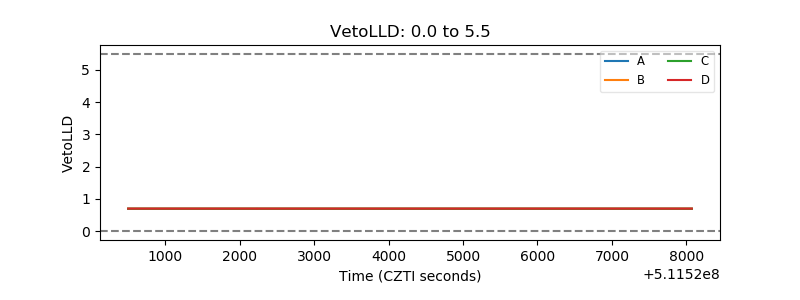 |
| Alpha Counter | 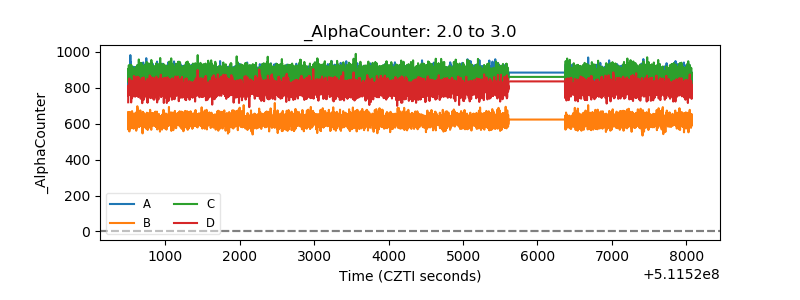 |
| _CPM_Rate | 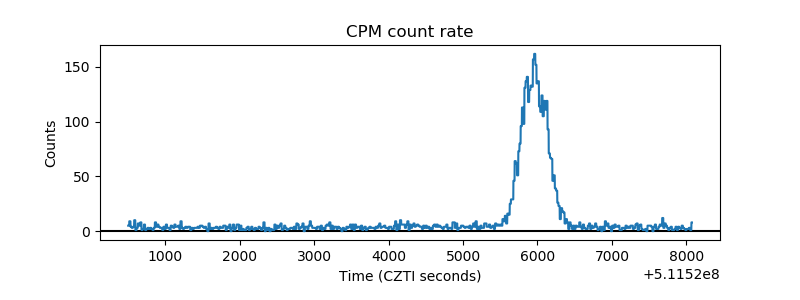 |
| CZT Counter | 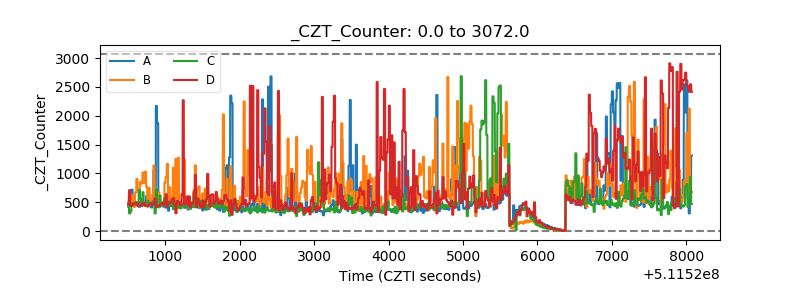 |
| +2.5 Volts monitor |  |
| +5 Volts monitor |  |
| _ROLL_ROT | 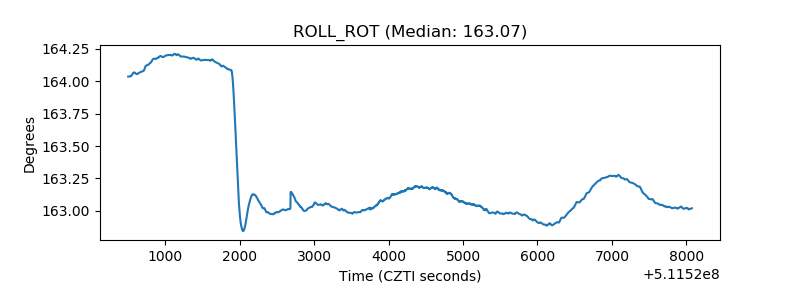 |
| _Roll_DEC | 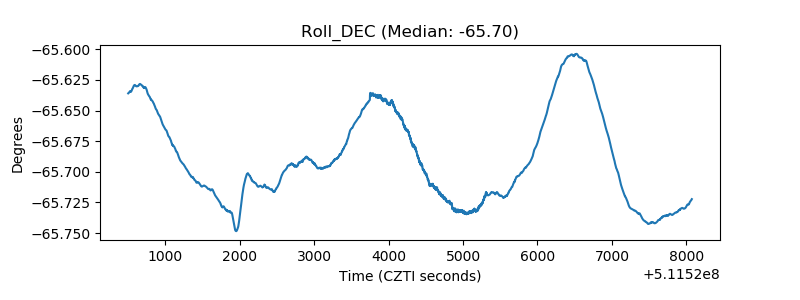 |
| _Roll_RA | 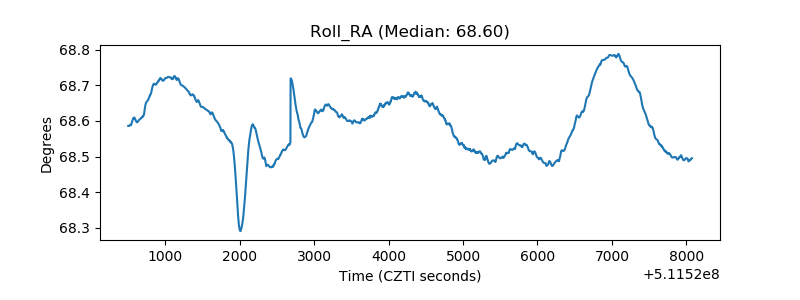 |
| Veto Counter | 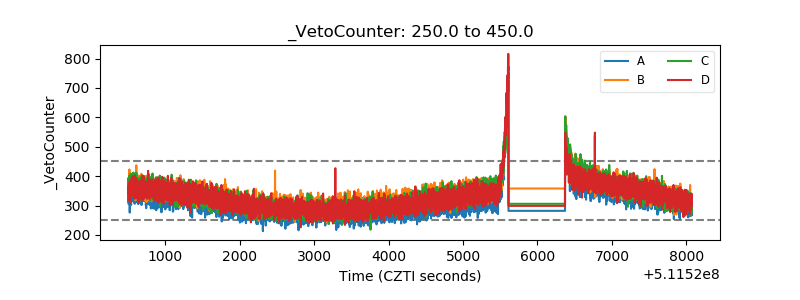 |