| Param | Original file | Final file |
|---|---|---|
| Filename | modeM0/AS1A14_083T06_9000006558_56650cztM0_level2.fits | modeM0/AS1A14_083T06_9000006558_56650cztM0_level2_quad_clean.evt |
| Size (bytes) | 399,355,200 | 86,166,720 |
| Size | 380.9 MB | 82.2 MB |
| Events in quadrant A | 2,760,306 | 569,697 |
| Events in quadrant B | 3,766,140 | 601,233 |
| Events in quadrant C | 3,113,111 | 539,561 |
| Events in quadrant D | 4,681,082 | 483,834 |
| Mode SS | |||
|---|---|---|---|
| Quadrant | BADHDUFLAG | Total packets | Discarded packets |
| A | 0 | 120 | 0 |
| B | 0 | 120 | 0 |
| C | 0 | 120 | 0 |
| D | 0 | 120 | 0 |
| Mode M9 | |||
|---|---|---|---|
| Quadrant | BADHDUFLAG | Total packets | Discarded packets |
| A | 0 | 11 | 0 |
| B | 0 | 11 | 0 |
| C | 0 | 11 | 0 |
| D | 0 | 11 | 0 |
| Mode M0 | |||
|---|---|---|---|
| Quadrant | BADHDUFLAG | Total packets | Discarded packets |
| A | 0 | 12677 | 1 |
| B | 0 | 15250 | 1 |
| C | 0 | 13697 | 1 |
| D | 0 | 18005 | 1 |
| Quadrant | Total seconds | Saturated seconds | Saturation percentage |
|---|---|---|---|
| A | 5941 | 95 | 1.599057% |
| B | 5941 | 220 | 3.703080% |
| C | 5941 | 80 | 1.346575% |
| D | 5941 | 429 | 7.221007% |
Noise dominated data is calculated using 1-second bins in cleaned event files. If a bin has >2000 counts, and if more than 50% of those come from <1% of pixels, then it is considered to be noise-dominated and hence unusable.
| Quadrant | # 1 sec bins | Bins with >0 counts | Bins with >2000 counts | High rate bins dominated by noise | Noise dominated (total time) | Noise dominated (detector-on time) | Marked lightcurve |
|---|---|---|---|---|---|---|---|
| A | 6981 | 5942 | 38 | 38 | 0.54% | 0.64% | 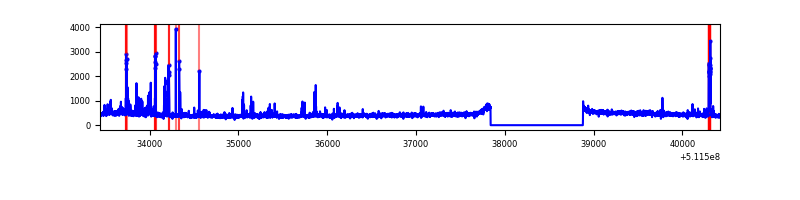 |
| B | 6981 | 5941 | 130 | 130 | 1.86% | 2.19% | 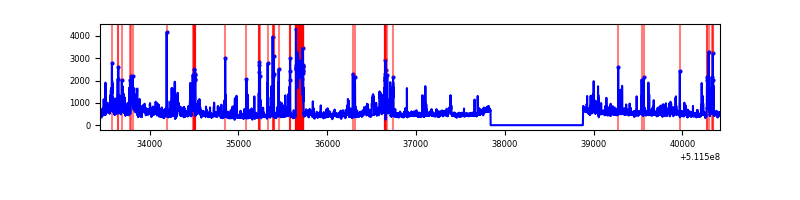 |
| C | 6981 | 5942 | 37 | 37 | 0.53% | 0.62% | 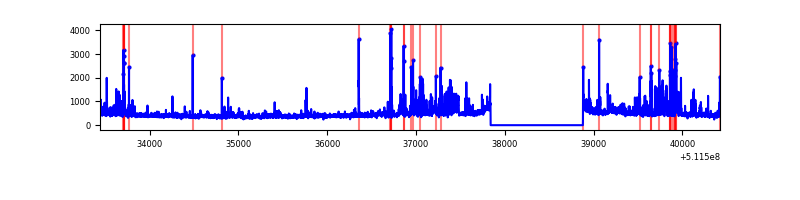 |
| D | 6981 | 5941 | 401 | 401 | 5.74% | 6.75% | 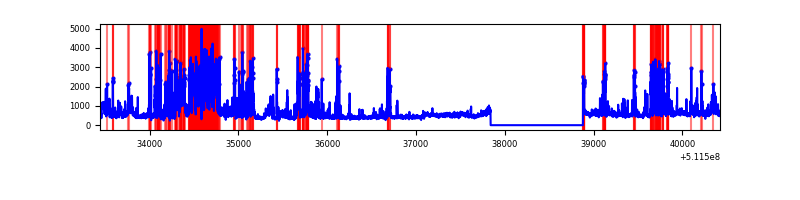 |
Top three noisy pixels from each quadrant. If the there are fewer than three noisy pixels in the level2.evt file, extra rows are filled as -1
| Pixel properties | Quadrant properties | ||||||
|---|---|---|---|---|---|---|---|
| Quadrant | DetID | PixID | Counts | Sigma | Mean | Median | Sigma |
| A | 0 | 8 | 74350 | 472.45 | 634 | 617 | 156.1 |
| A | 13 | 248 | 66455 | 421.87 | 634 | 617 | 156.1 |
| A | 10 | 251 | 54588 | 345.83 | 634 | 617 | 156.1 |
| B | 4 | 21 | 510834 | 3854.05 | 621 | 601 | 132.4 |
| B | 5 | 185 | 389014 | 2933.88 | 621 | 601 | 132.4 |
| B | 8 | 128 | 106213 | 797.74 | 621 | 601 | 132.4 |
| C | 12 | 252 | 491163 | 2953.01 | 606 | 598 | 166.1 |
| C | 1 | 16 | 120395 | 721.13 | 606 | 598 | 166.1 |
| C | 14 | 254 | 55841 | 332.54 | 606 | 598 | 166.1 |
| D | 2 | 62 | 728917 | 4340.5 | 593 | 566 | 167.8 |
| D | 2 | 120 | 688085 | 4097.17 | 593 | 566 | 167.8 |
| D | 2 | 31 | 315295 | 1875.58 | 593 | 566 | 167.8 |
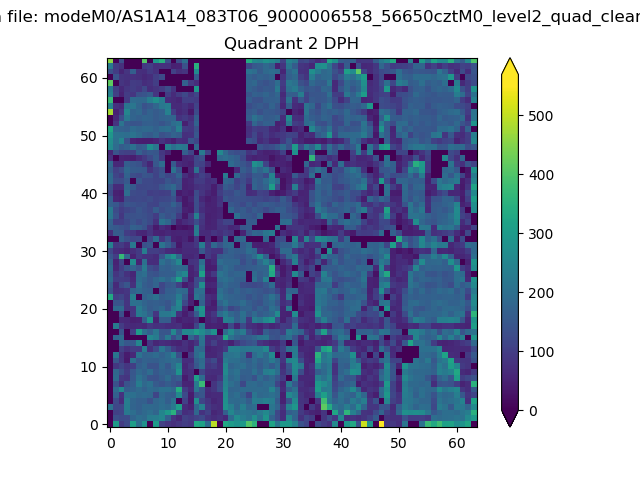
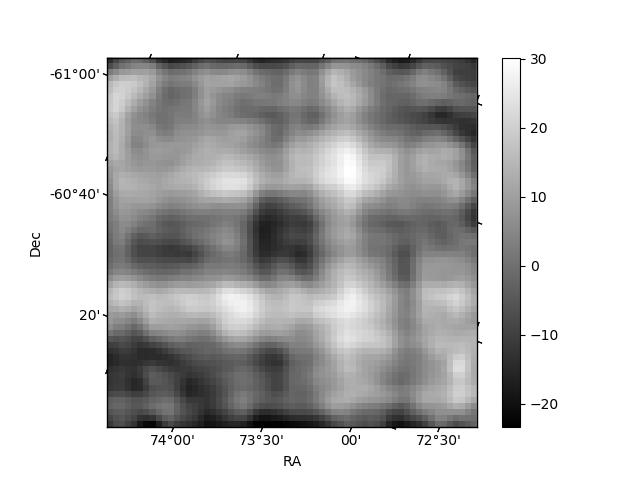
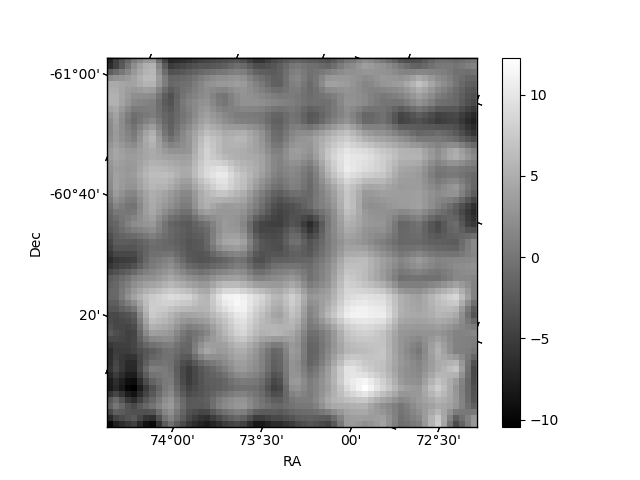
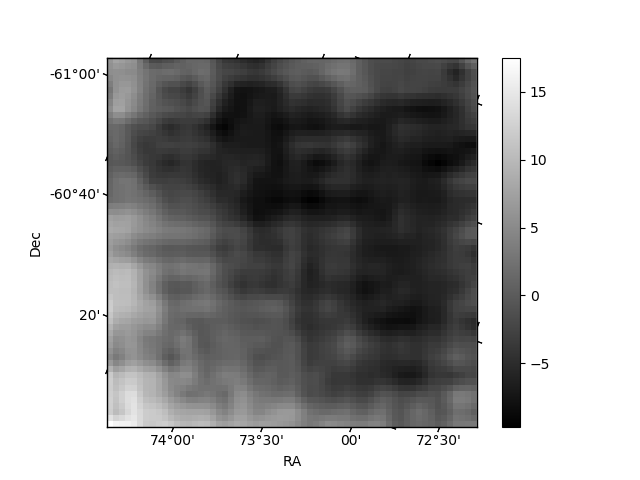
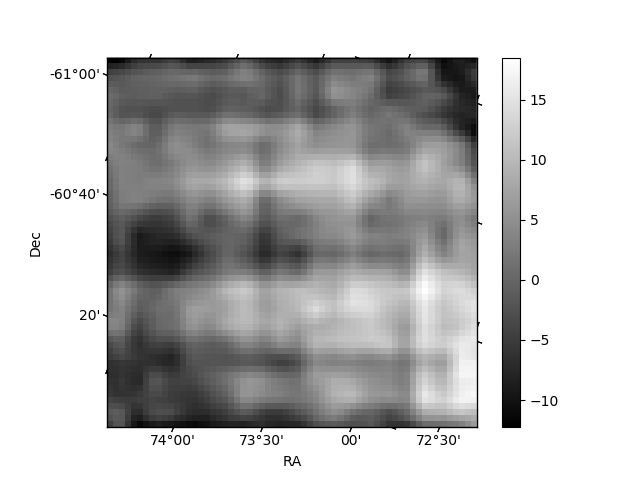
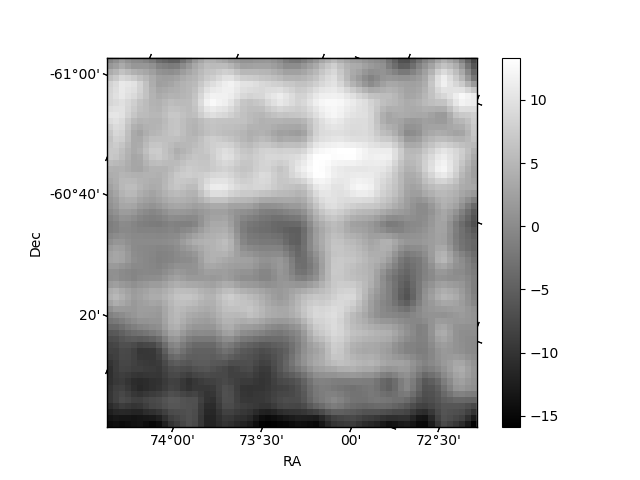
Histogram calculated using DETX and DETY for each event in the final _common_clean file
| Quadrant A | 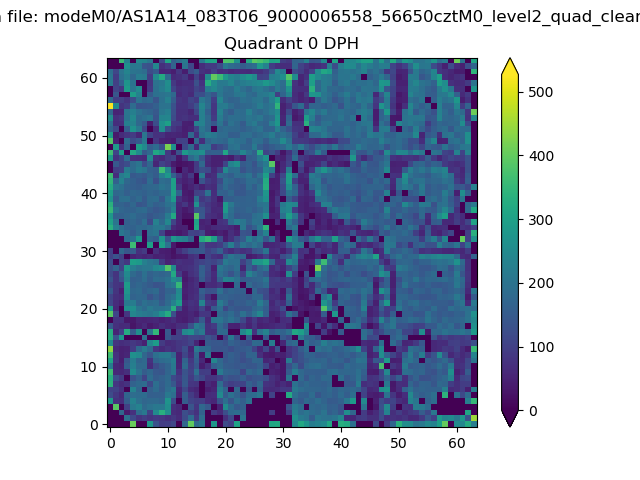 |
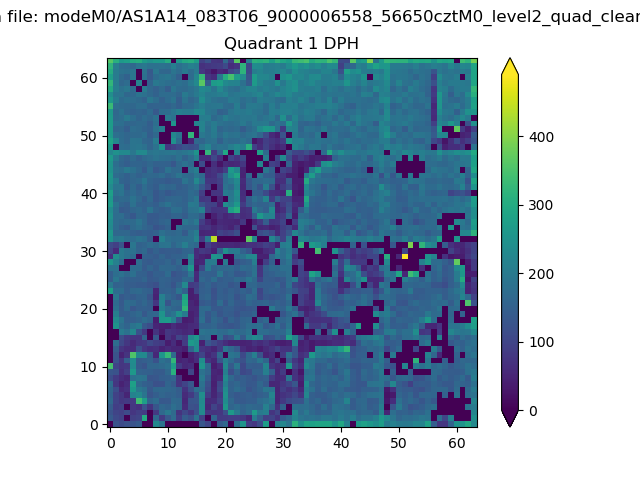 |
Quadrant B |
|---|---|---|---|
| Quadrant D | 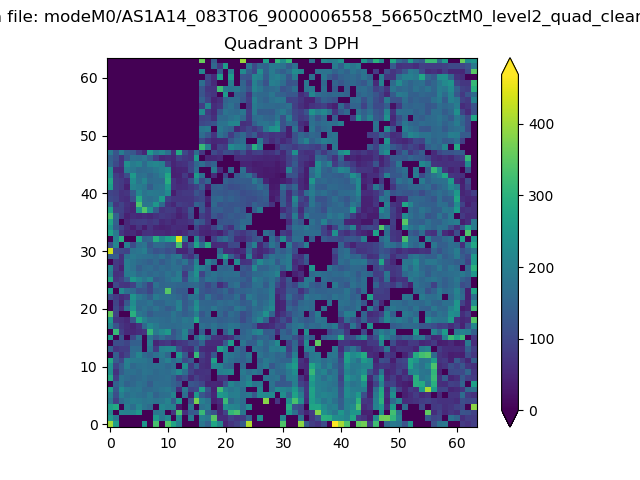 |
 |
Quadrant C |
| Plot type | Count rate plots | Images |
|---|---|---|
| Comparison with Poisson distribution Blue bars denote a histogram of data divided into 1 sec bins. Red curve is a Poisson curve with rate = median count rate of data. |
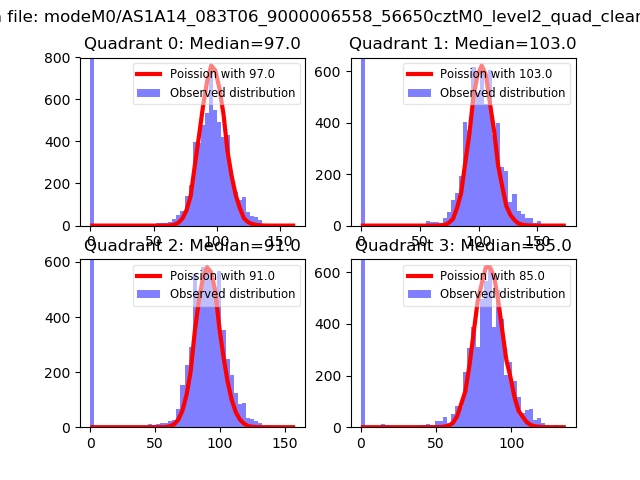 |
 |
| Quadrant-wise count rates Data is divided into 100 sec bins |
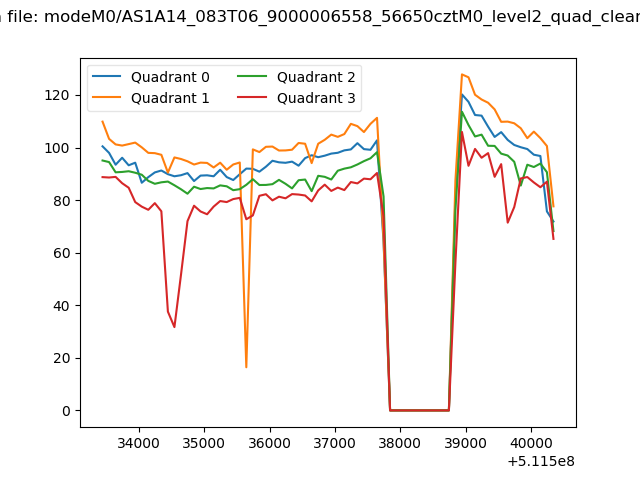 |
|
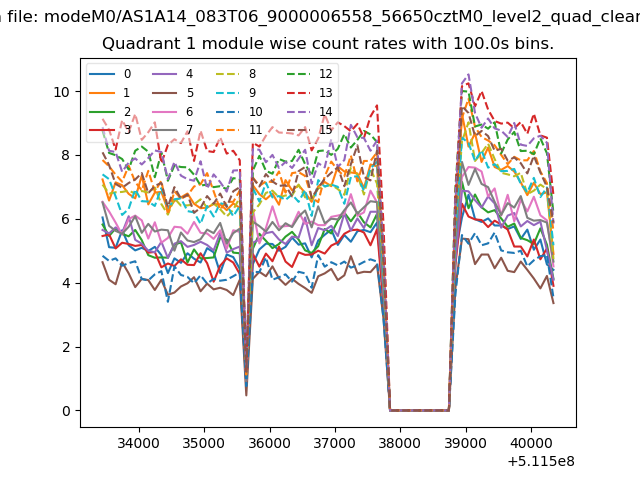
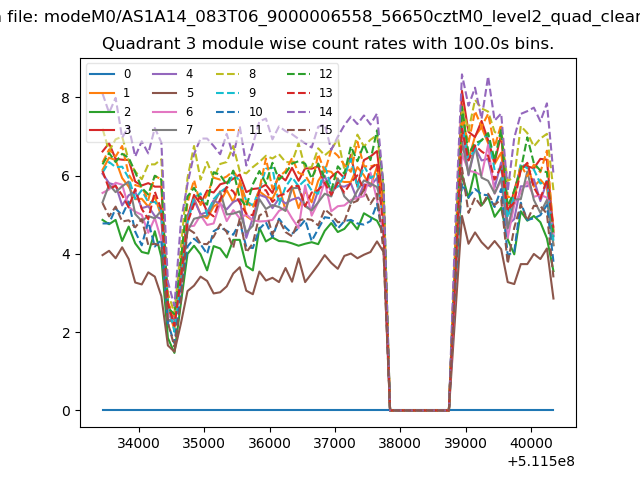
| Module-wise count rates for Quadrant A Data is divided into 100 sec bins |
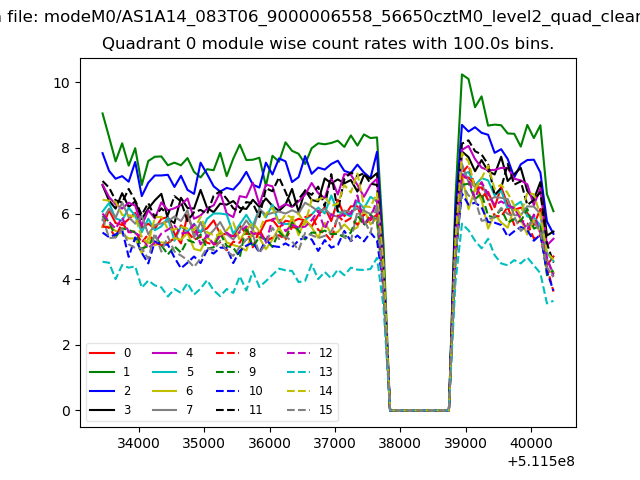 |
 |
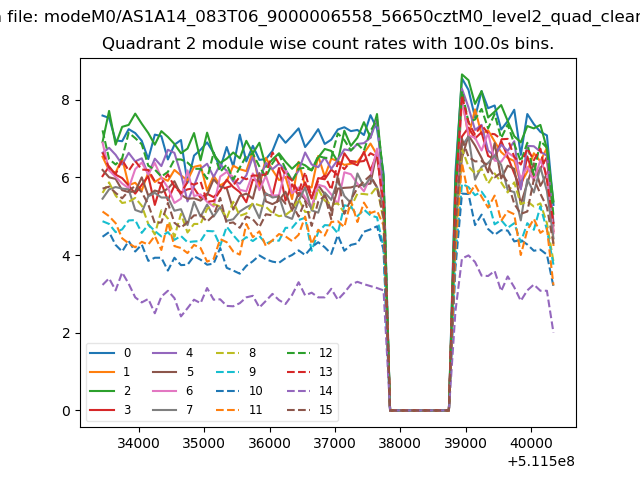
| Module-wise count rates for Quadrant B Data is divided into 100 sec bins |
 |
 |
| Module-wise count rates for Quadrant C Data is divided into 100 sec bins |
 |
 |
| Module-wise count rates for Quadrant D Data is divided into 100 sec bins |
 |
 |
| Parameter | Plot |
|---|---|
| CZT HV Monitor |  |
| D_VDD | 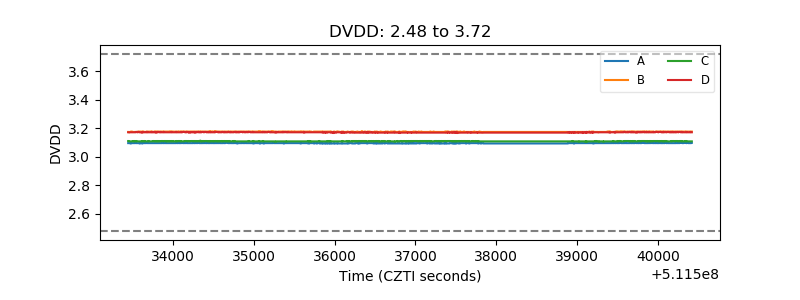 |
| Temperature 1 | 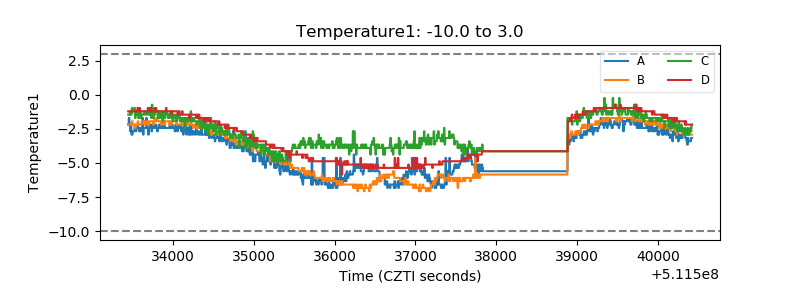 |
| Veto HV Monitor | 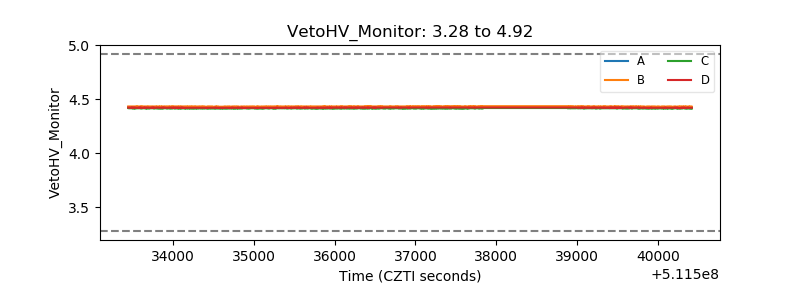 |
| Veto LLD | 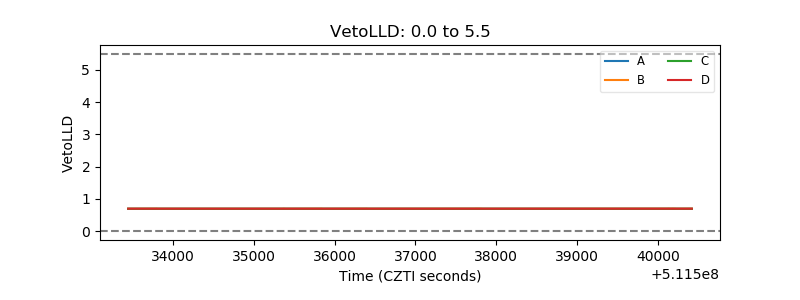 |
| Alpha Counter | 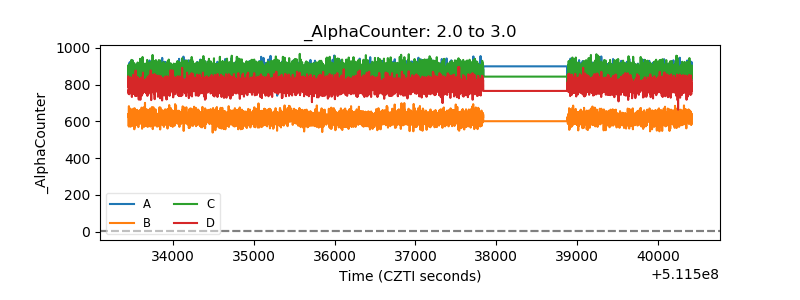 |
| _CPM_Rate | 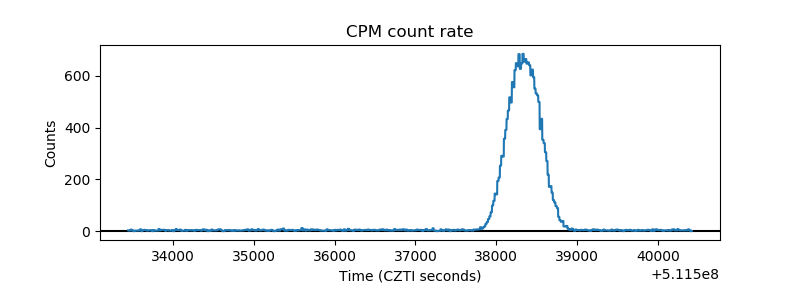 |
| CZT Counter | 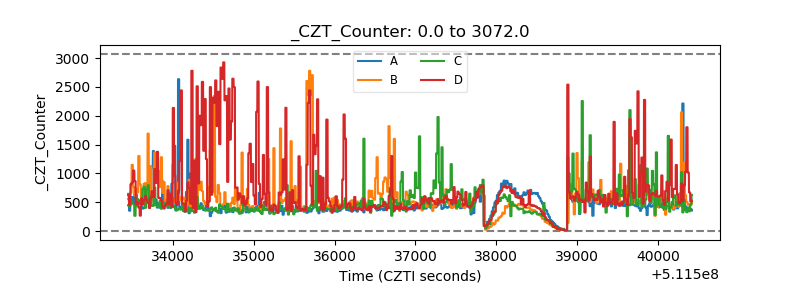 |
| +2.5 Volts monitor |  |
| +5 Volts monitor |  |
| _ROLL_ROT | 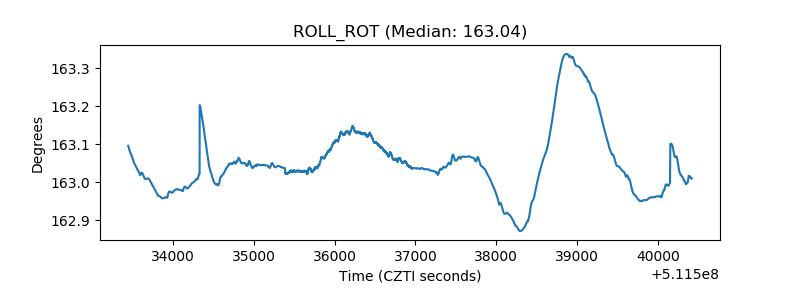 |
| _Roll_DEC | 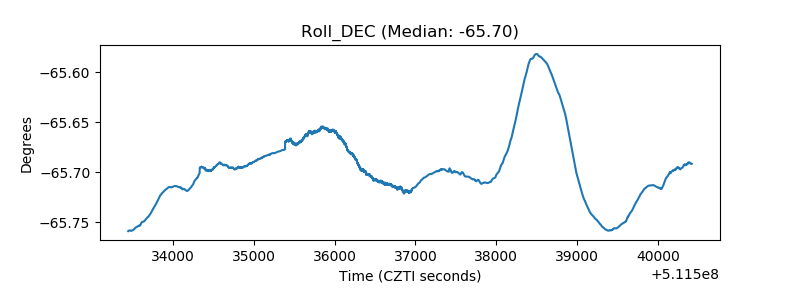 |
| _Roll_RA | 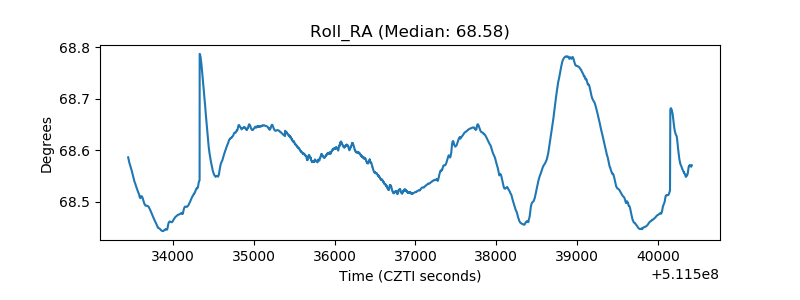 |
| Veto Counter | 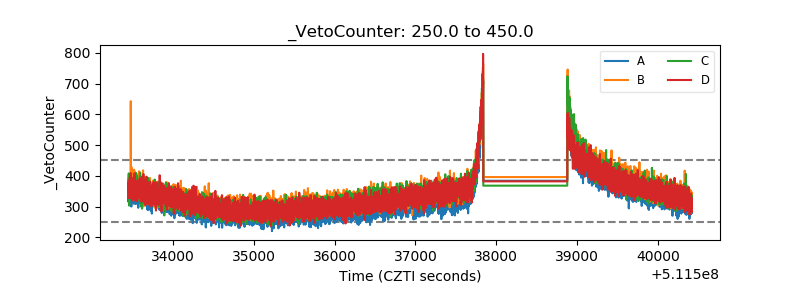 |