| Param | Original file | Final file |
|---|---|---|
| Filename | modeM0/AS1A14_083T06_9000006558_56651cztM0_level2.fits | modeM0/AS1A14_083T06_9000006558_56651cztM0_level2_quad_clean.evt |
| Size (bytes) | 450,506,880 | 96,111,360 |
| Size | 429.6 MB | 91.7 MB |
| Events in quadrant A | 2,943,512 | 647,005 |
| Events in quadrant B | 4,834,180 | 653,344 |
| Events in quadrant C | 3,980,989 | 599,206 |
| Events in quadrant D | 4,414,263 | 558,967 |
| Mode SS | |||
|---|---|---|---|
| Quadrant | BADHDUFLAG | Total packets | Discarded packets |
| A | 0 | 132 | 0 |
| B | 0 | 132 | 0 |
| C | 0 | 132 | 0 |
| D | 0 | 132 | 0 |
| Mode M9 | |||
|---|---|---|---|
| Quadrant | BADHDUFLAG | Total packets | Discarded packets |
| A | 0 | 12 | 0 |
| B | 0 | 12 | 0 |
| C | 0 | 12 | 0 |
| D | 0 | 12 | 0 |
| Mode M0 | |||
|---|---|---|---|
| Quadrant | BADHDUFLAG | Total packets | Discarded packets |
| A | 0 | 13498 | 2 |
| B | 0 | 18810 | 2 |
| C | 0 | 16473 | 2 |
| D | 0 | 17593 | 2 |
| Quadrant | Total seconds | Saturated seconds | Saturation percentage |
|---|---|---|---|
| A | 6475 | 37 | 0.571429% |
| B | 6475 | 512 | 7.907336% |
| C | 6476 | 158 | 2.439778% |
| D | 6476 | 257 | 3.968499% |
Noise dominated data is calculated using 1-second bins in cleaned event files. If a bin has >2000 counts, and if more than 50% of those come from <1% of pixels, then it is considered to be noise-dominated and hence unusable.
| Quadrant | # 1 sec bins | Bins with >0 counts | Bins with >2000 counts | High rate bins dominated by noise | Noise dominated (total time) | Noise dominated (detector-on time) | Marked lightcurve |
|---|---|---|---|---|---|---|---|
| A | 7645 | 6476 | 25 | 25 | 0.33% | 0.39% | 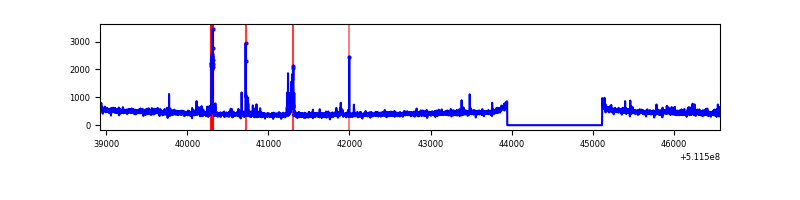 |
| B | 7645 | 6476 | 366 | 366 | 4.79% | 5.65% | 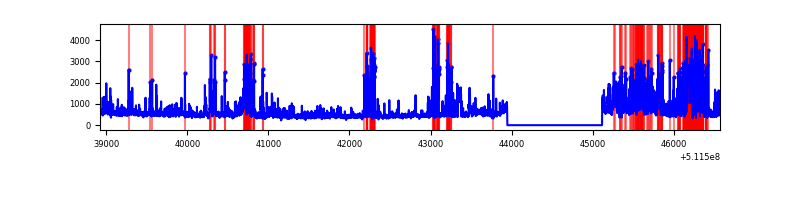 |
| C | 7646 | 6477 | 127 | 127 | 1.66% | 1.96% | 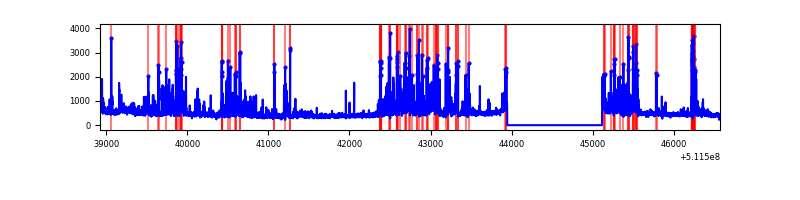 |
| D | 7646 | 6477 | 250 | 250 | 3.27% | 3.86% | 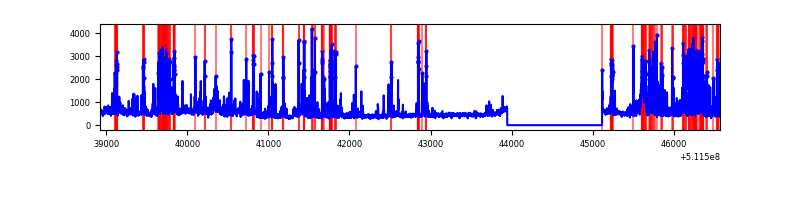 |
Top three noisy pixels from each quadrant. If the there are fewer than three noisy pixels in the level2.evt file, extra rows are filled as -1
| Pixel properties | Quadrant properties | ||||||
|---|---|---|---|---|---|---|---|
| Quadrant | DetID | PixID | Counts | Sigma | Mean | Median | Sigma |
| A | 10 | 251 | 60814 | 344.29 | 709 | 690 | 174.6 |
| A | 13 | 248 | 58071 | 328.58 | 709 | 690 | 174.6 |
| A | 8 | 249 | 38652 | 217.38 | 709 | 690 | 174.6 |
| B | 4 | 21 | 1151436 | 8012.43 | 675 | 652 | 143.6 |
| B | 5 | 185 | 507177 | 3526.72 | 675 | 652 | 143.6 |
| B | 4 | 206 | 147783 | 1024.41 | 675 | 652 | 143.6 |
| C | 12 | 252 | 702369 | 3794.88 | 670 | 665 | 184.9 |
| C | 13 | 3 | 402177 | 2171.42 | 670 | 665 | 184.9 |
| C | 1 | 16 | 143096 | 770.28 | 670 | 665 | 184.9 |
| D | 12 | 3 | 533776 | 2847.41 | 666 | 636 | 187.2 |
| D | 2 | 249 | 278581 | 1484.46 | 666 | 636 | 187.2 |
| D | 2 | 31 | 229441 | 1222.01 | 666 | 636 | 187.2 |
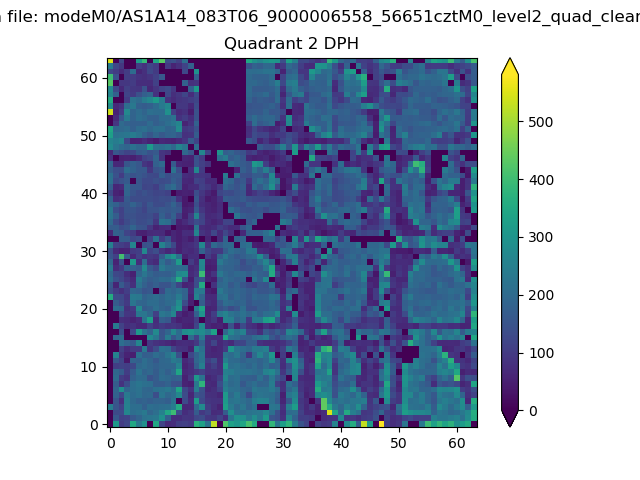
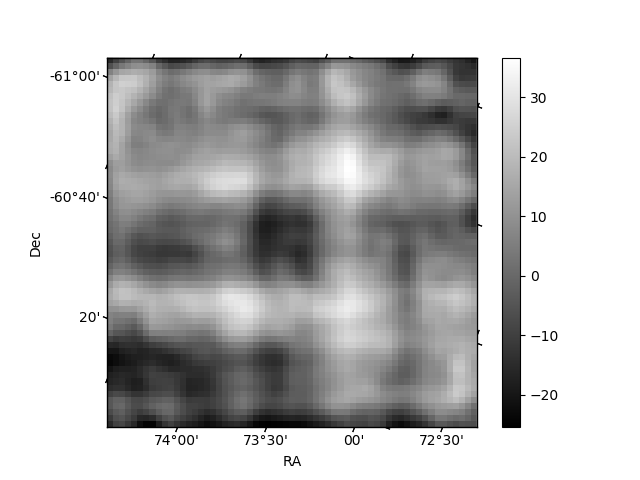
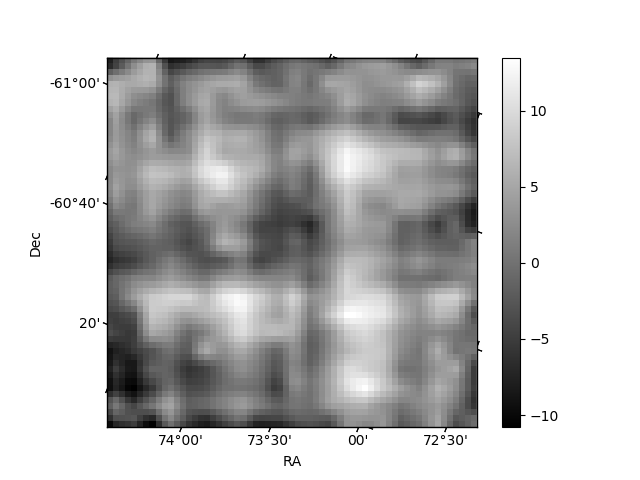
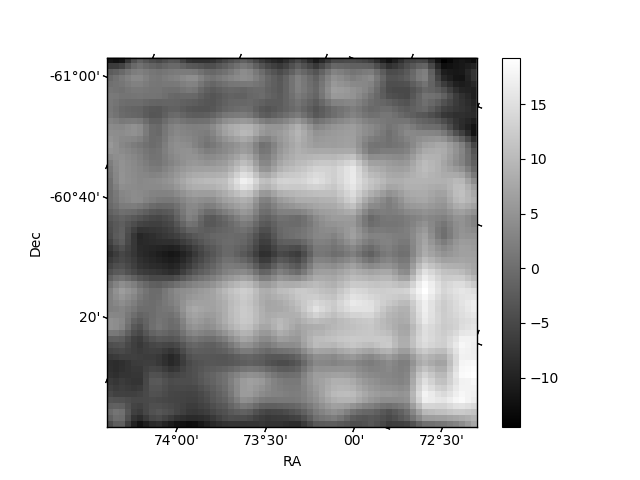
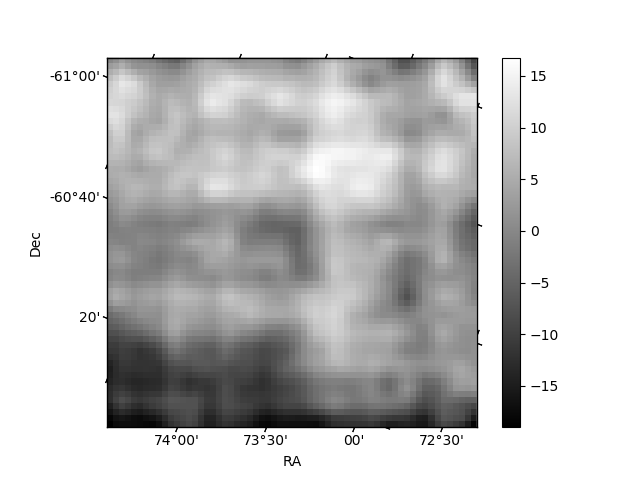
Histogram calculated using DETX and DETY for each event in the final _common_clean file
| Quadrant A | 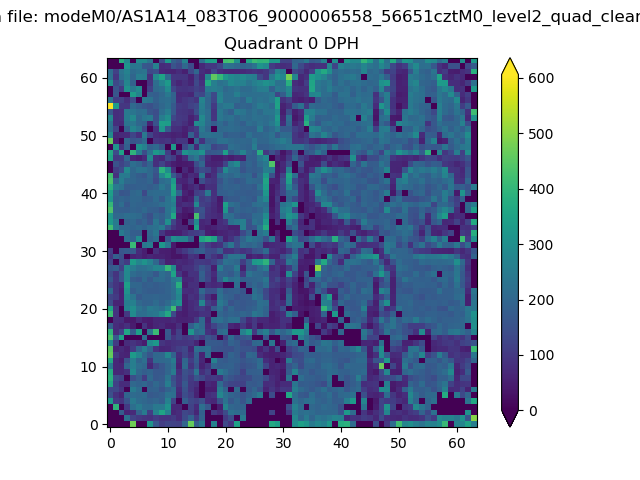 |
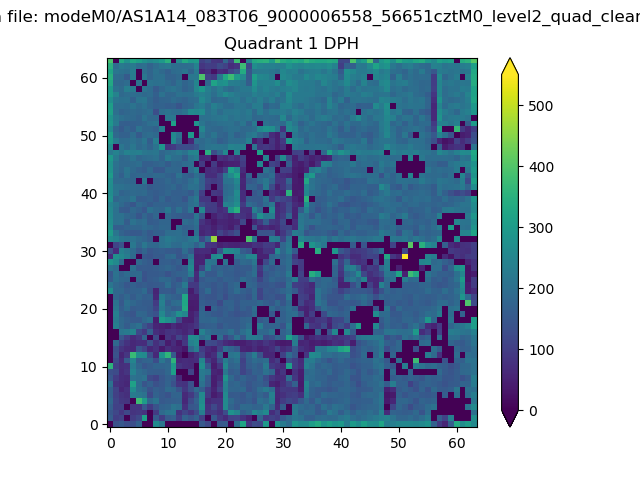 |
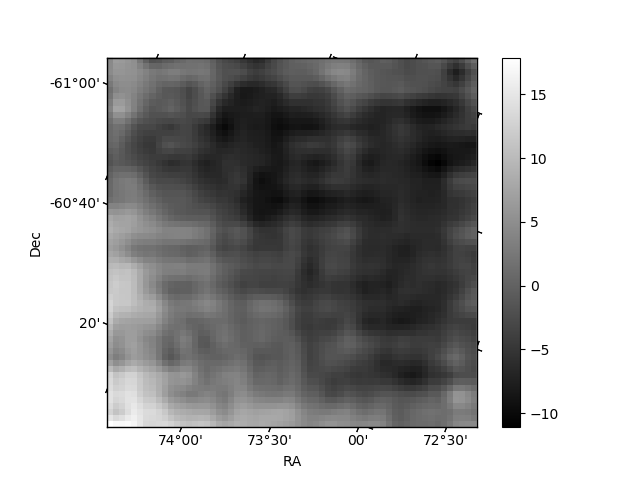
Quadrant B |
|---|---|---|---|
| Quadrant D | 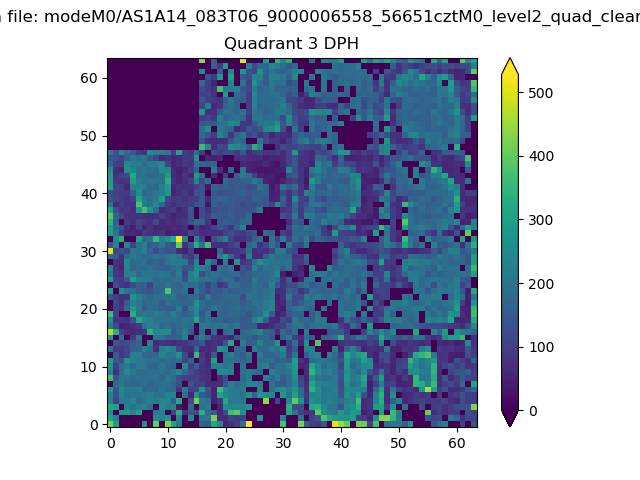 |
 |
Quadrant C |
| Plot type | Count rate plots | Images |
|---|---|---|
| Comparison with Poisson distribution Blue bars denote a histogram of data divided into 1 sec bins. Red curve is a Poisson curve with rate = median count rate of data. |
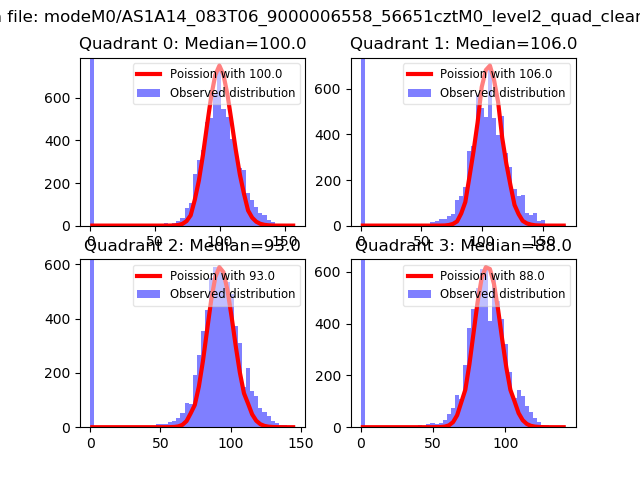 |
 |
| Quadrant-wise count rates Data is divided into 100 sec bins |
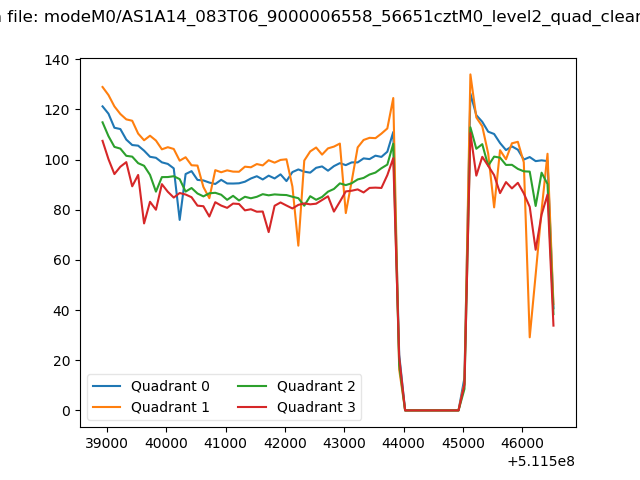 |
|
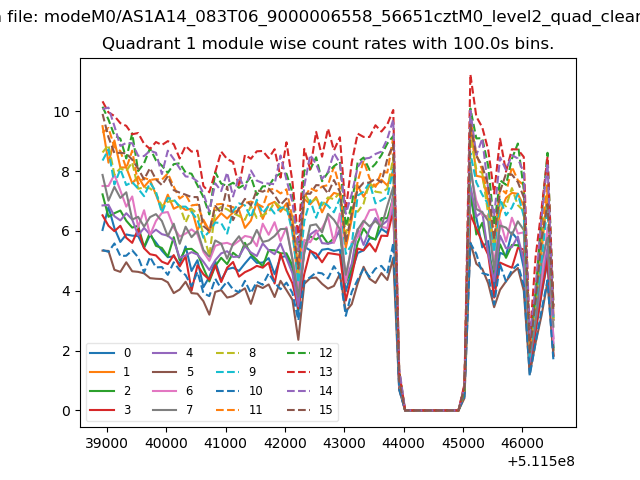
| Module-wise count rates for Quadrant A Data is divided into 100 sec bins |
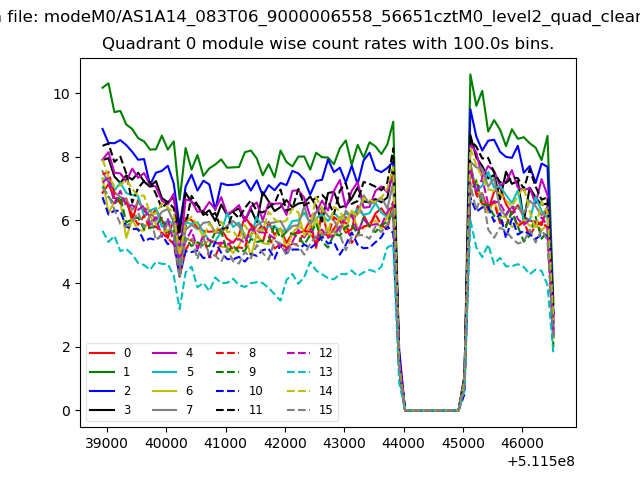 |
 |
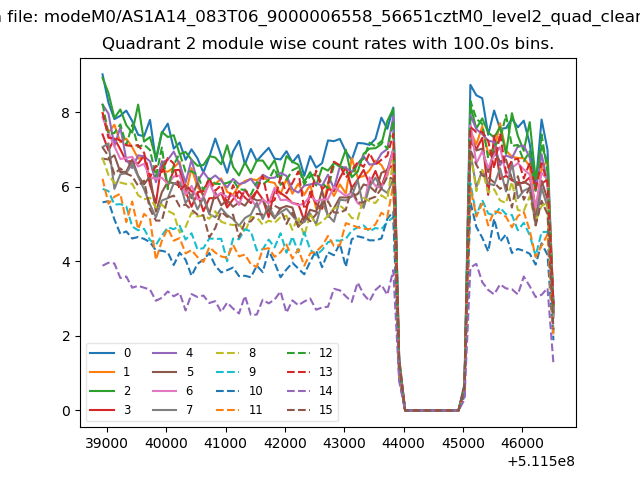
| Module-wise count rates for Quadrant B Data is divided into 100 sec bins |
 |
 |
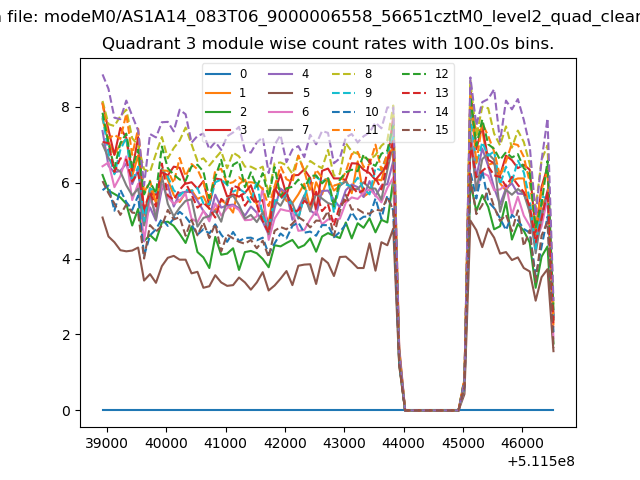
| Module-wise count rates for Quadrant C Data is divided into 100 sec bins |
 |
 |
| Module-wise count rates for Quadrant D Data is divided into 100 sec bins |
 |
 |
| Parameter | Plot |
|---|---|
| CZT HV Monitor | 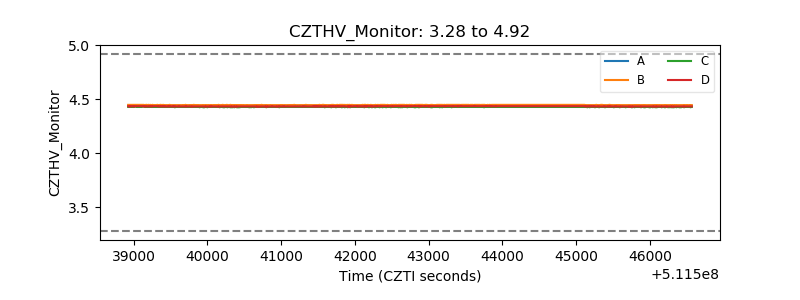 |
| D_VDD | 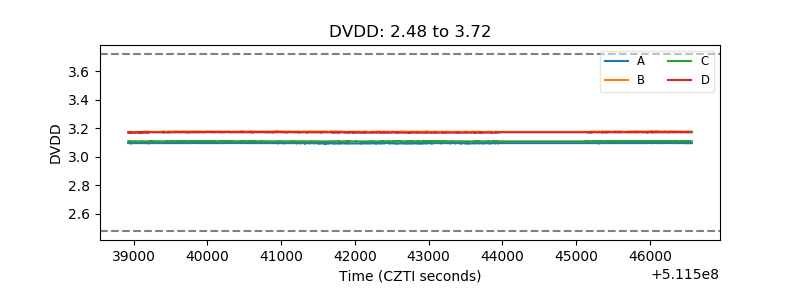 |
| Temperature 1 | 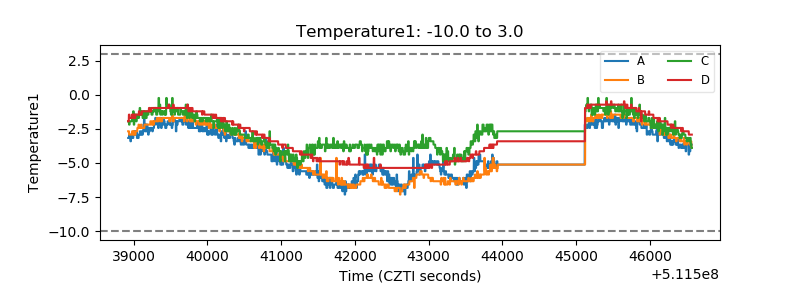 |
| Veto HV Monitor |  |
| Veto LLD | 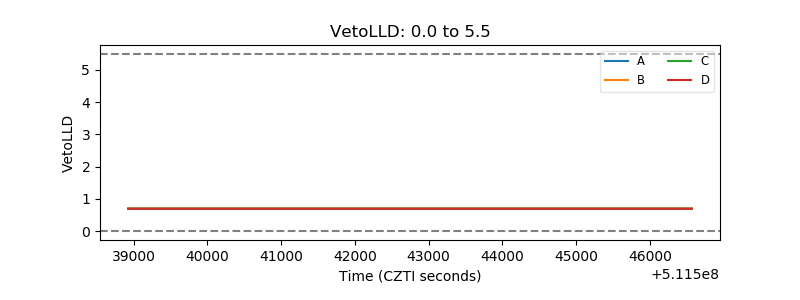 |
| Alpha Counter | 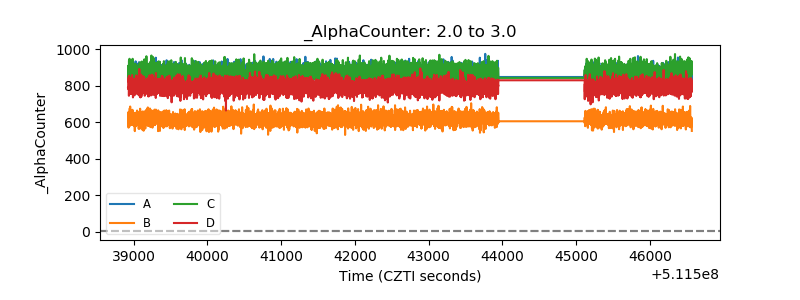 |
| _CPM_Rate | 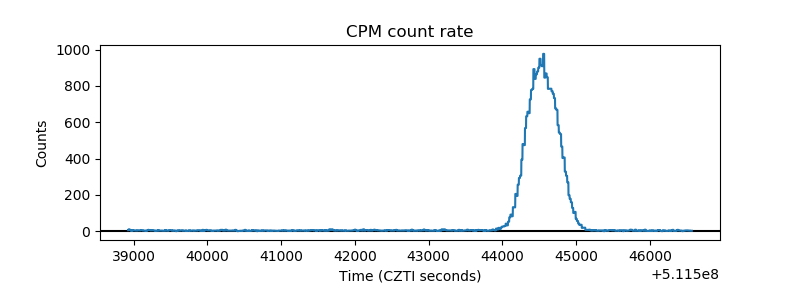 |
| CZT Counter | 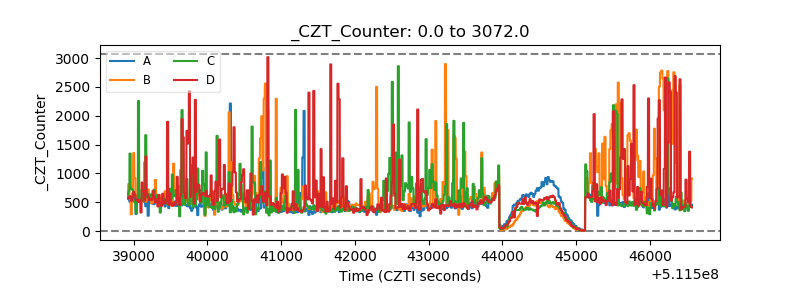 |
| +2.5 Volts monitor | 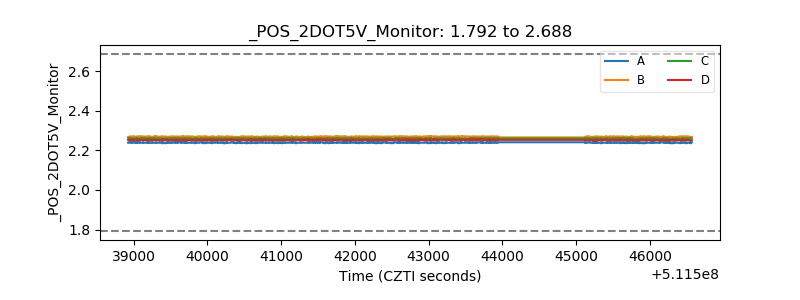 |
| +5 Volts monitor | 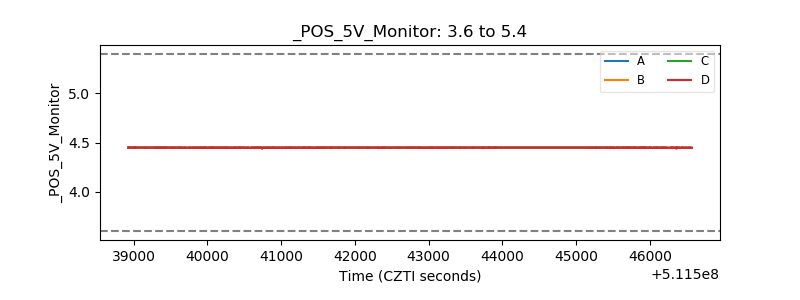 |
| _ROLL_ROT | 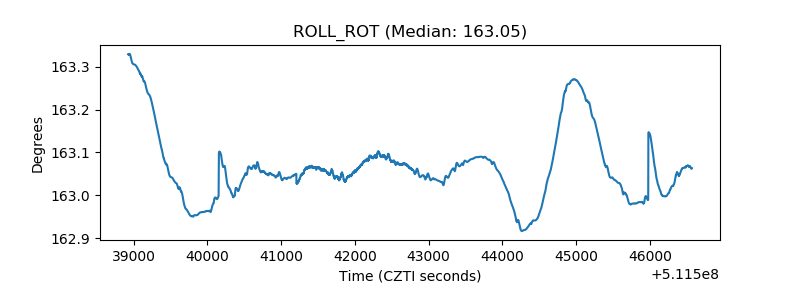 |
| _Roll_DEC | 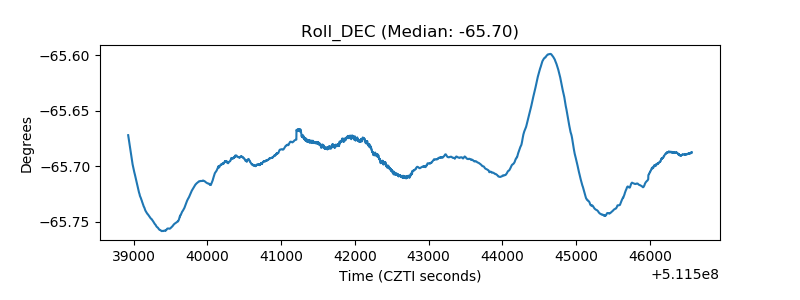 |
| _Roll_RA | 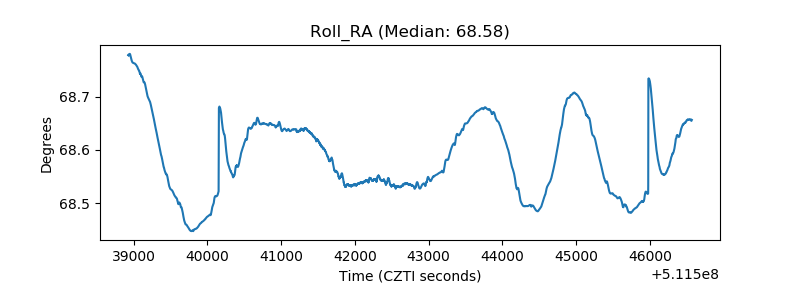 |
| Veto Counter | 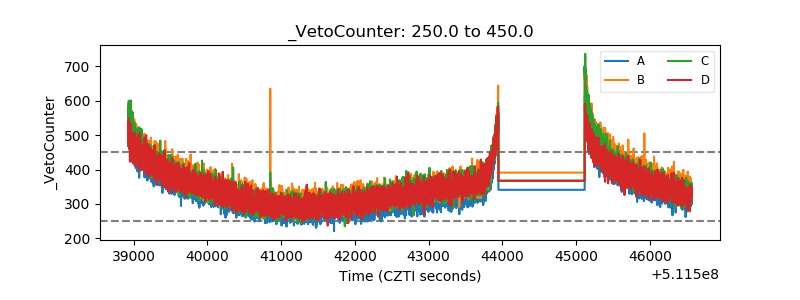 |