| Param | Original file | Final file |
|---|---|---|
| Filename | modeM0/AS1A14_083T06_9000006558_56652cztM0_level2.fits | modeM0/AS1A14_083T06_9000006558_56652cztM0_level2_quad_clean.evt |
| Size (bytes) | 509,857,920 | 87,857,280 |
| Size | 486.2 MB | 83.8 MB |
| Events in quadrant A | 3,118,599 | 608,649 |
| Events in quadrant B | 5,591,557 | 583,442 |
| Events in quadrant C | 4,855,103 | 528,185 |
| Events in quadrant D | 4,830,951 | 510,900 |
| Mode SS | |||
|---|---|---|---|
| Quadrant | BADHDUFLAG | Total packets | Discarded packets |
| A | 0 | 126 | 0 |
| B | 0 | 126 | 0 |
| C | 0 | 126 | 0 |
| D | 0 | 126 | 0 |
| Mode M9 | |||
|---|---|---|---|
| Quadrant | BADHDUFLAG | Total packets | Discarded packets |
| A | 0 | 11 | 0 |
| B | 0 | 11 | 0 |
| C | 0 | 11 | 0 |
| D | 0 | 11 | 0 |
| Mode M0 | |||
|---|---|---|---|
| Quadrant | BADHDUFLAG | Total packets | Discarded packets |
| A | 0 | 13740 | 1 |
| B | 0 | 20838 | 1 |
| C | 0 | 18702 | 1 |
| D | 0 | 18641 | 1 |
| Quadrant | Total seconds | Saturated seconds | Saturation percentage |
|---|---|---|---|
| A | 6140 | 134 | 2.182410% |
| B | 6141 | 918 | 14.948705% |
| C | 6141 | 571 | 9.298160% |
| D | 6141 | 450 | 7.327797% |
Noise dominated data is calculated using 1-second bins in cleaned event files. If a bin has >2000 counts, and if more than 50% of those come from <1% of pixels, then it is considered to be noise-dominated and hence unusable.
| Quadrant | # 1 sec bins | Bins with >0 counts | Bins with >2000 counts | High rate bins dominated by noise | Noise dominated (total time) | Noise dominated (detector-on time) | Marked lightcurve |
|---|---|---|---|---|---|---|---|
| A | 7300 | 6141 | 82 | 82 | 1.12% | 1.34% | 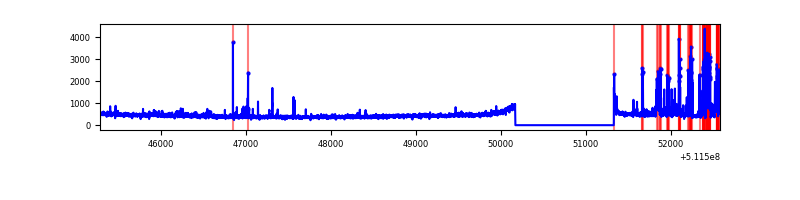 |
| B | 7301 | 6142 | 679 | 679 | 9.30% | 11.06% | 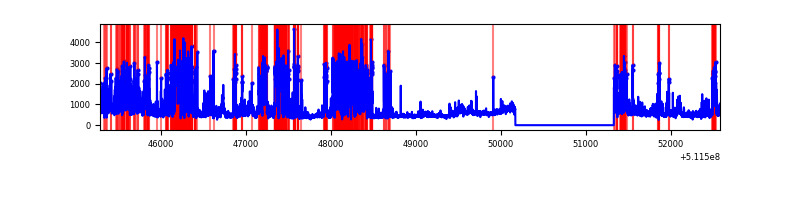 |
| C | 7301 | 6142 | 573 | 573 | 7.85% | 9.33% | 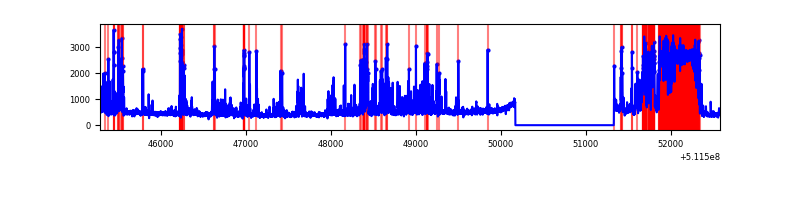 |
| D | 7301 | 6142 | 407 | 407 | 5.57% | 6.63% | 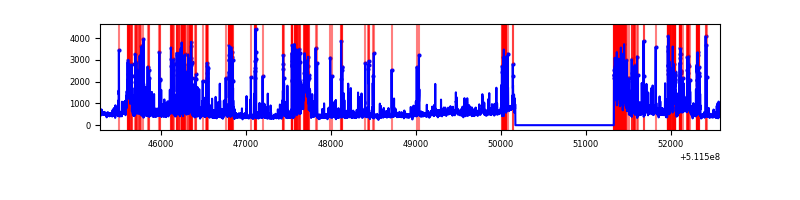 |
Top three noisy pixels from each quadrant. If the there are fewer than three noisy pixels in the level2.evt file, extra rows are filled as -1
| Pixel properties | Quadrant properties | ||||||
|---|---|---|---|---|---|---|---|
| Quadrant | DetID | PixID | Counts | Sigma | Mean | Median | Sigma |
| A | 10 | 251 | 340849 | 2050.43 | 672 | 656 | 165.9 |
| A | 4 | 95 | 44564 | 264.64 | 672 | 656 | 165.9 |
| A | 7 | 64 | 40758 | 241.7 | 672 | 656 | 165.9 |
| B | 4 | 21 | 1958435 | 14586.9 | 629 | 607 | 134.2 |
| B | 5 | 185 | 738018 | 5494.12 | 629 | 607 | 134.2 |
| B | 4 | 206 | 185568 | 1378.06 | 629 | 607 | 134.2 |
| C | 15 | 230 | 1395360 | 8283.31 | 616 | 609 | 168.4 |
| C | 12 | 252 | 522904 | 3101.86 | 616 | 609 | 168.4 |
| C | 13 | 3 | 262584 | 1555.85 | 616 | 609 | 168.4 |
| D | 12 | 3 | 1026859 | 5834.19 | 619 | 591 | 175.9 |
| D | 2 | 249 | 561258 | 3187.31 | 619 | 591 | 175.9 |
| D | 2 | 31 | 222420 | 1261.06 | 619 | 591 | 175.9 |
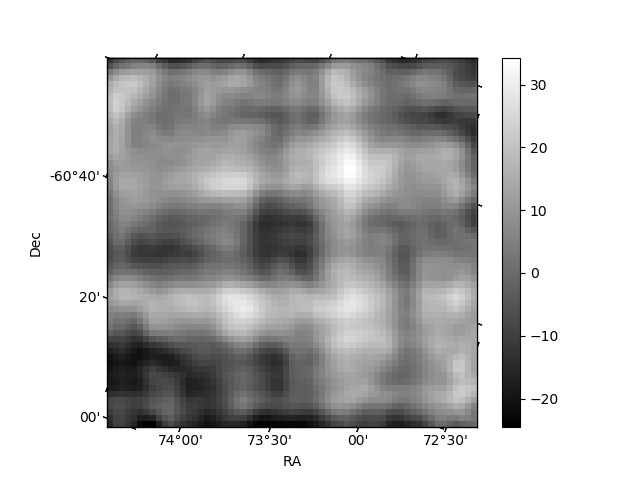
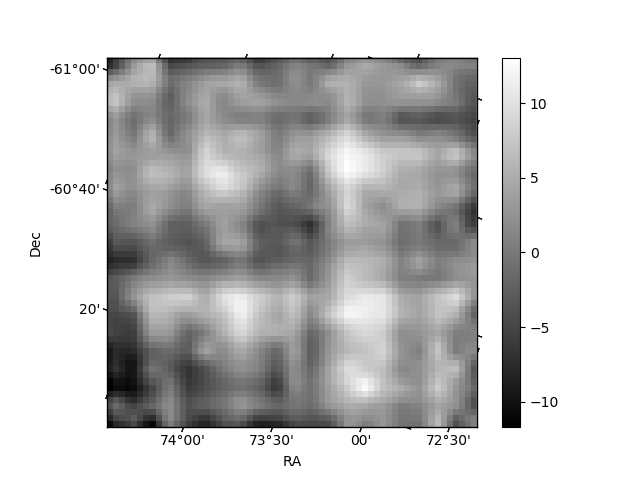
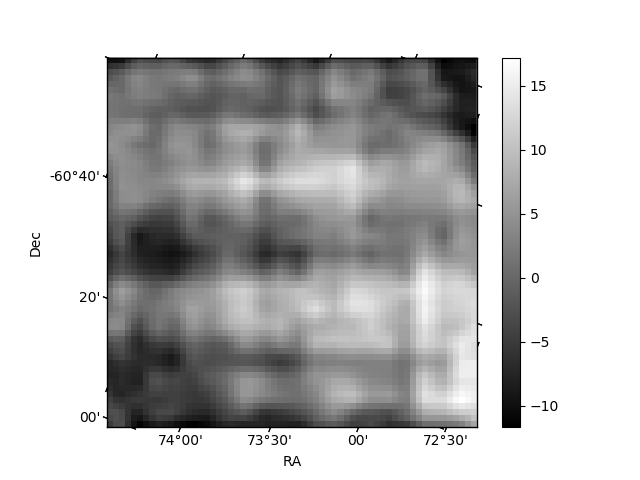
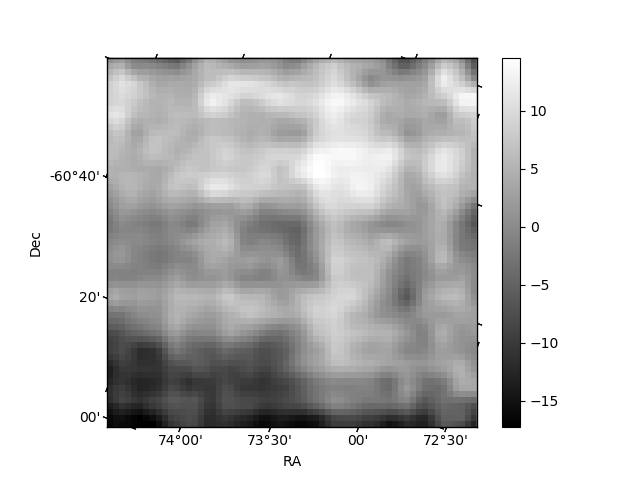
Histogram calculated using DETX and DETY for each event in the final _common_clean file
| Quadrant A | 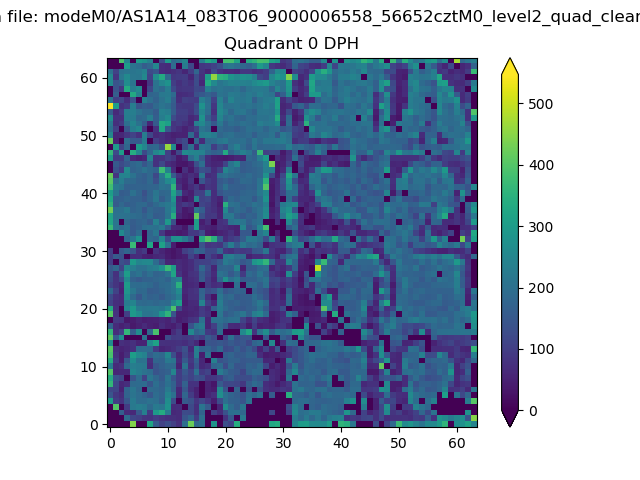 |
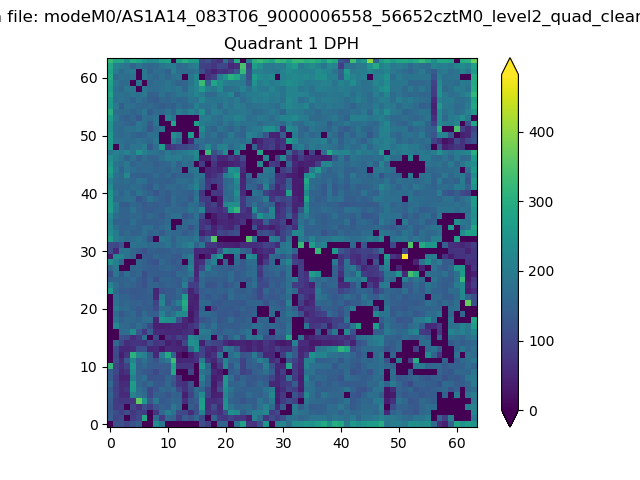 |
Quadrant B |
|---|---|---|---|
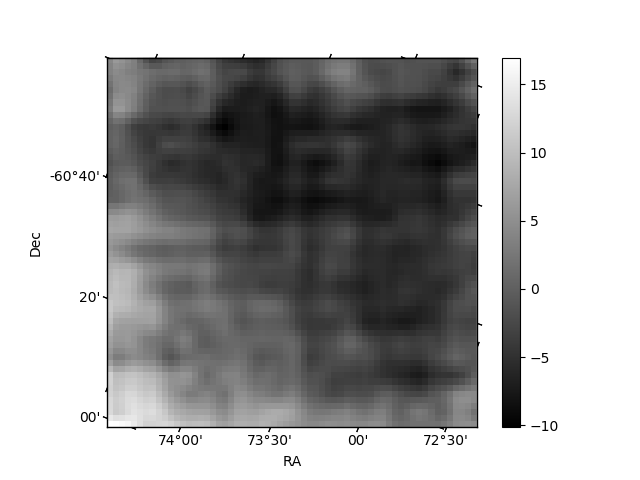
| Quadrant D | 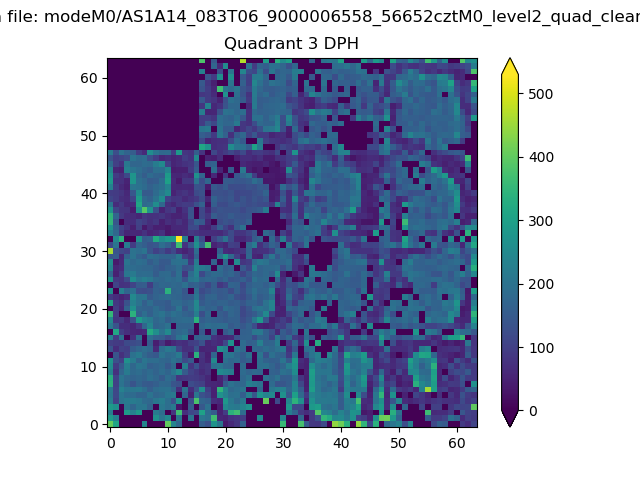 |
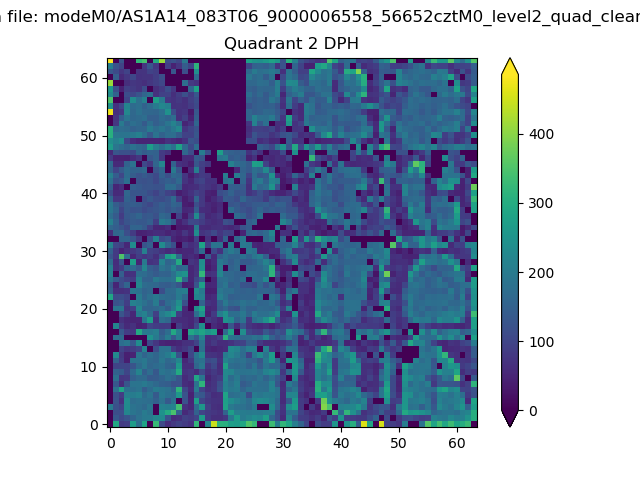 |
Quadrant C |
| Plot type | Count rate plots | Images |
|---|---|---|
| Comparison with Poisson distribution Blue bars denote a histogram of data divided into 1 sec bins. Red curve is a Poisson curve with rate = median count rate of data. |
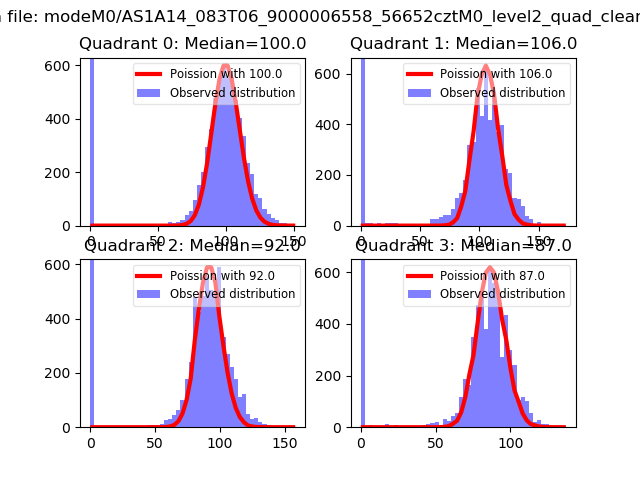 |
 |
| Quadrant-wise count rates Data is divided into 100 sec bins |
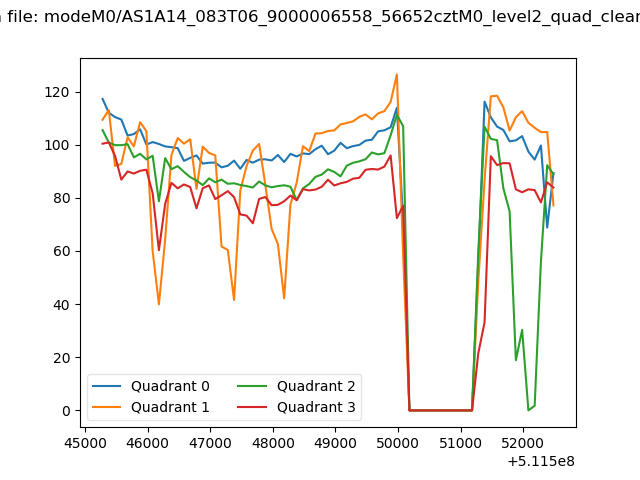 |
|
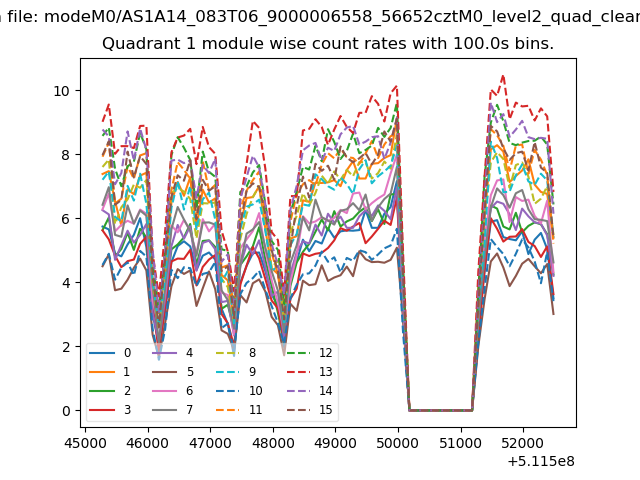
| Module-wise count rates for Quadrant A Data is divided into 100 sec bins |
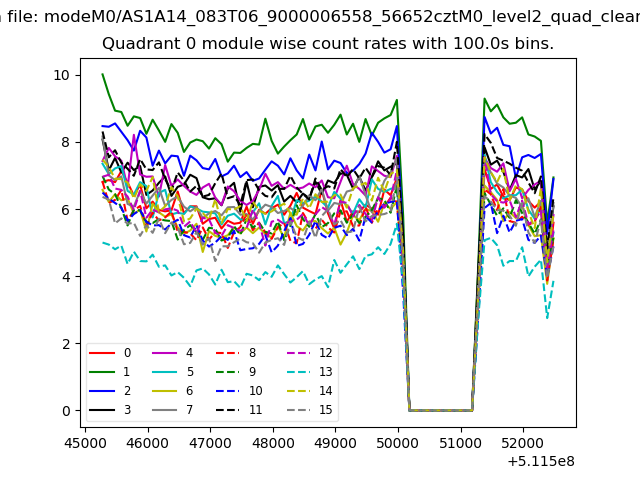 |
 |
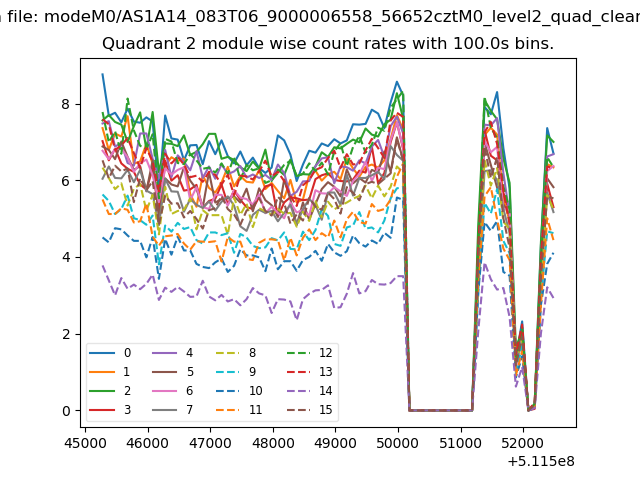
| Module-wise count rates for Quadrant B Data is divided into 100 sec bins |
 |
 |
| Module-wise count rates for Quadrant C Data is divided into 100 sec bins |
 |
 |
| Module-wise count rates for Quadrant D Data is divided into 100 sec bins |
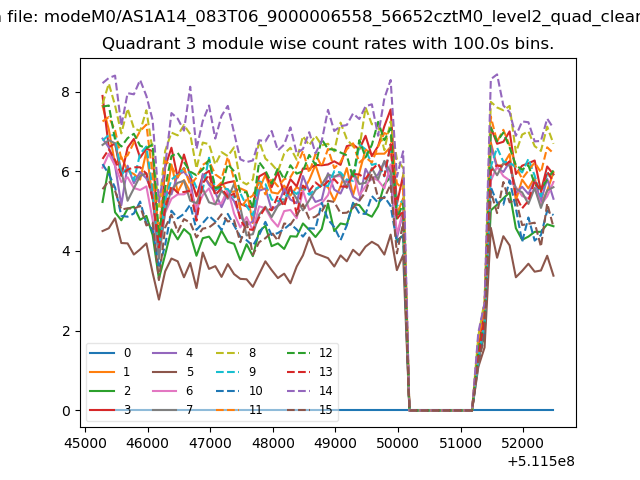 |
 |
| Parameter | Plot |
|---|---|
| CZT HV Monitor | 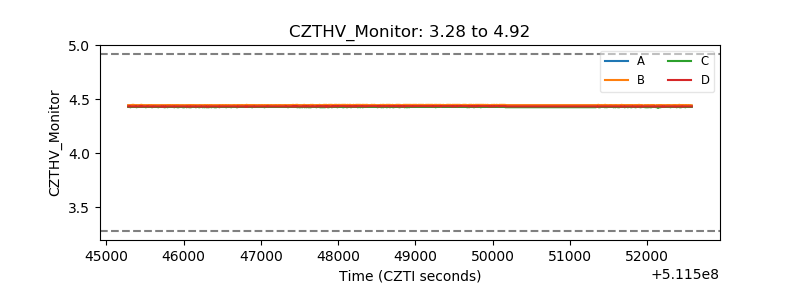 |
| D_VDD | 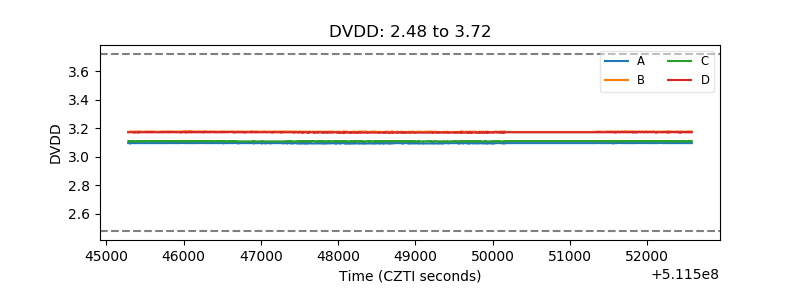 |
| Temperature 1 | 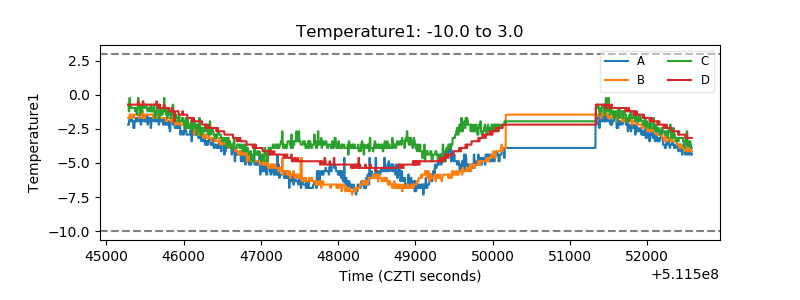 |
| Veto HV Monitor | 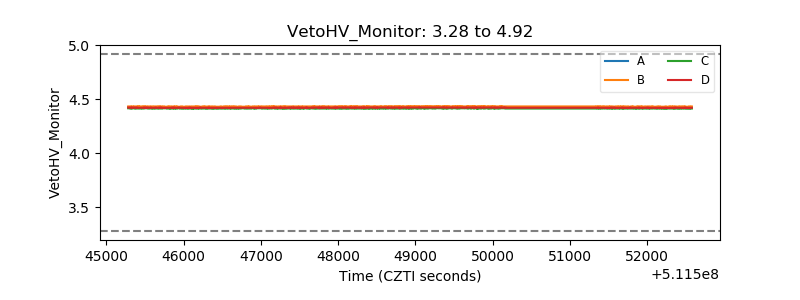 |
| Veto LLD | 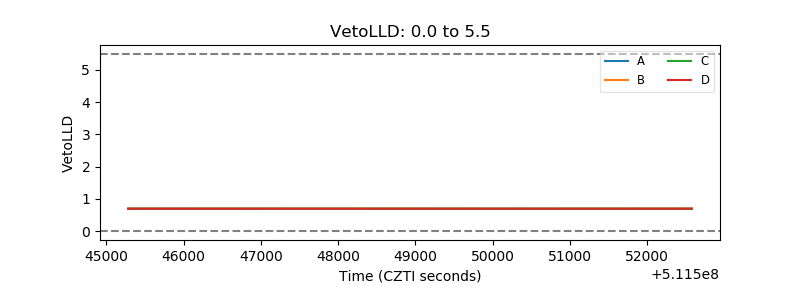 |
| Alpha Counter | 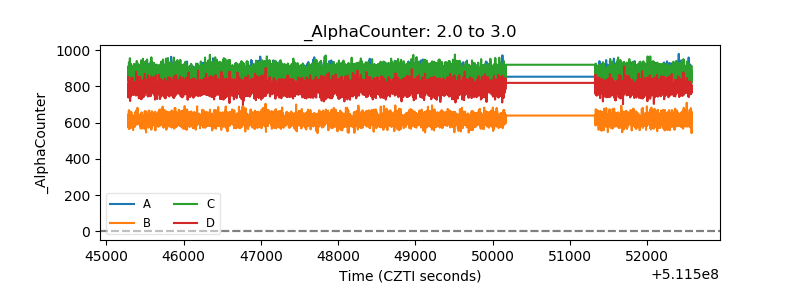 |
| _CPM_Rate | 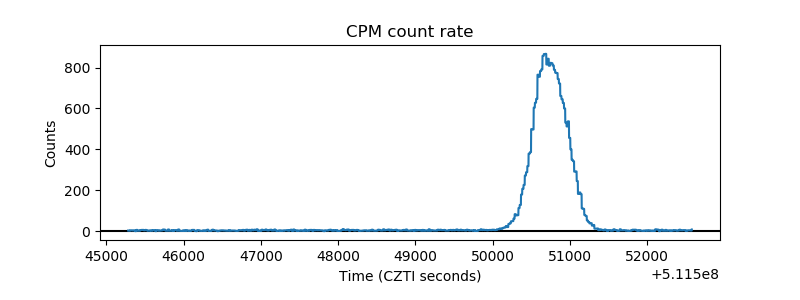 |
| CZT Counter | 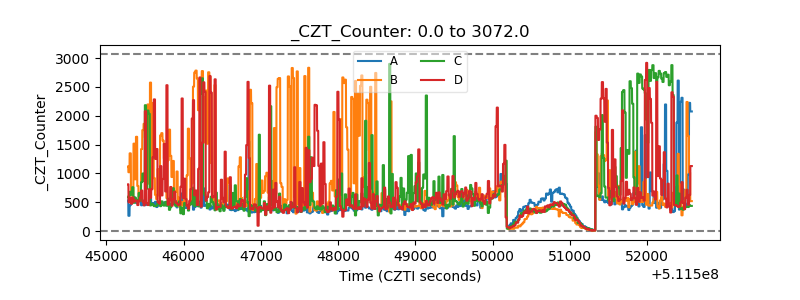 |
| +2.5 Volts monitor |  |
| +5 Volts monitor |  |
| _ROLL_ROT | 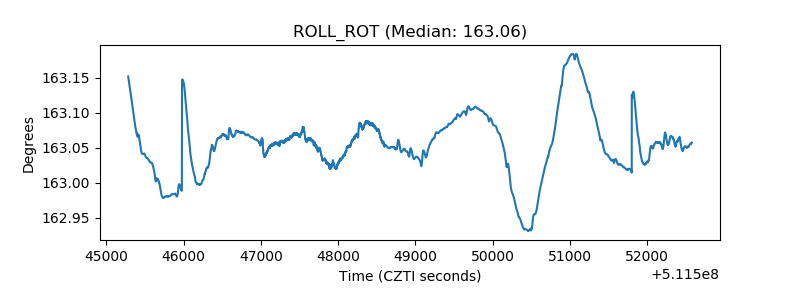 |
| _Roll_DEC | 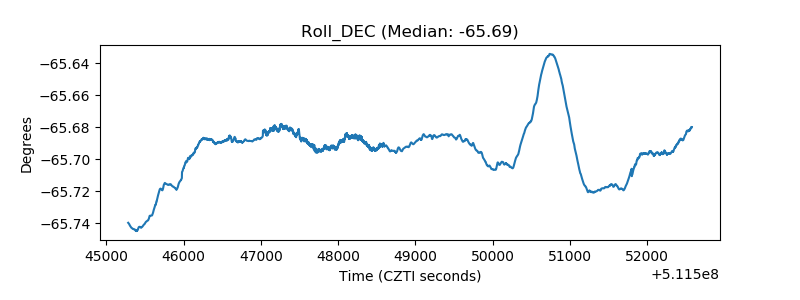 |
| _Roll_RA | 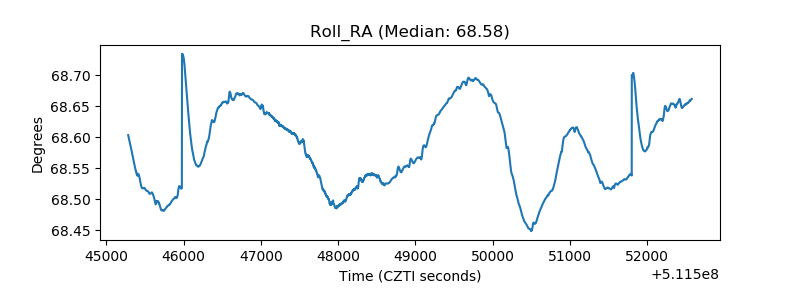 |
| Veto Counter | 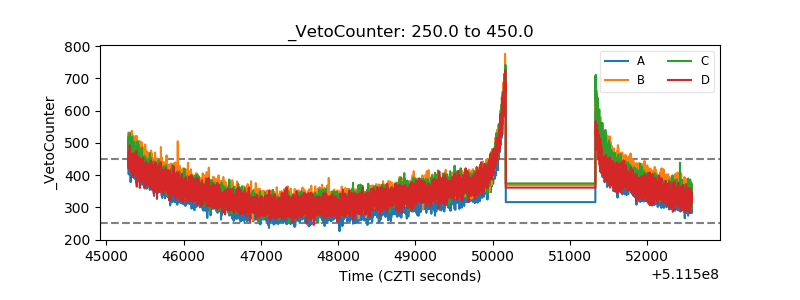 |