| Param | Original file | Final file |
|---|---|---|
| Filename | modeM0/AS1A14_083T06_9000006558_56653cztM0_level2.fits | modeM0/AS1A14_083T06_9000006558_56653cztM0_level2_quad_clean.evt |
| Size (bytes) | 484,859,520 | 90,311,040 |
| Size | 462.4 MB | 86.1 MB |
| Events in quadrant A | 3,578,453 | 612,827 |
| Events in quadrant B | 4,787,788 | 621,387 |
| Events in quadrant C | 4,387,365 | 534,228 |
| Events in quadrant D | 4,705,657 | 526,716 |
| Mode SS | |||
|---|---|---|---|
| Quadrant | BADHDUFLAG | Total packets | Discarded packets |
| A | 0 | 130 | 0 |
| B | 0 | 130 | 0 |
| C | 0 | 130 | 0 |
| D | 0 | 130 | 0 |
| Mode M9 | |||
|---|---|---|---|
| Quadrant | BADHDUFLAG | Total packets | Discarded packets |
| A | 0 | 11 | 0 |
| B | 0 | 11 | 0 |
| C | 0 | 11 | 0 |
| D | 0 | 11 | 0 |
| Mode M0 | |||
|---|---|---|---|
| Quadrant | BADHDUFLAG | Total packets | Discarded packets |
| A | 0 | 15378 | 1 |
| B | 0 | 18548 | 1 |
| C | 0 | 17501 | 1 |
| D | 0 | 18492 | 7 |
| Quadrant | Total seconds | Saturated seconds | Saturation percentage |
|---|---|---|---|
| A | 6287 | 161 | 2.560840% |
| B | 6287 | 595 | 9.463973% |
| C | 6288 | 533 | 8.476463% |
| D | 6287 | 368 | 5.853348% |
Noise dominated data is calculated using 1-second bins in cleaned event files. If a bin has >2000 counts, and if more than 50% of those come from <1% of pixels, then it is considered to be noise-dominated and hence unusable.
| Quadrant | # 1 sec bins | Bins with >0 counts | Bins with >2000 counts | High rate bins dominated by noise | Noise dominated (total time) | Noise dominated (detector-on time) | Marked lightcurve |
|---|---|---|---|---|---|---|---|
| A | 7472 | 6288 | 129 | 129 | 1.73% | 2.05% | 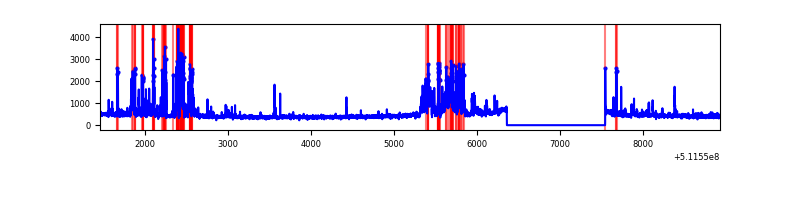 |
| B | 7472 | 6288 | 506 | 506 | 6.77% | 8.05% | 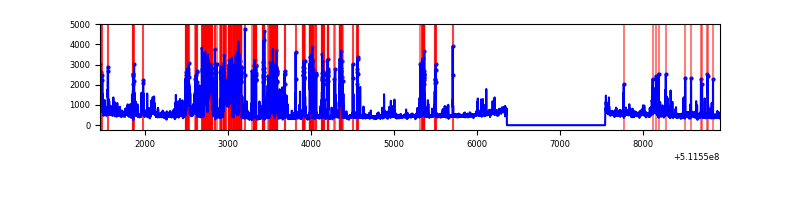 |
| C | 7473 | 6289 | 538 | 538 | 7.20% | 8.55% | 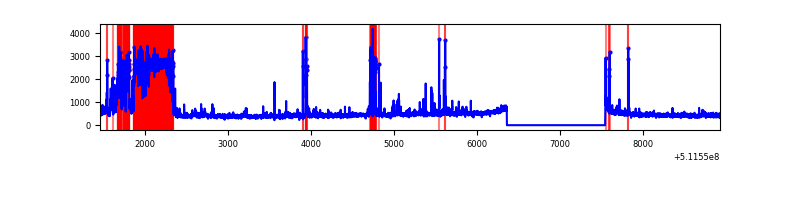 |
| D | 7472 | 6288 | 387 | 387 | 5.18% | 6.15% | 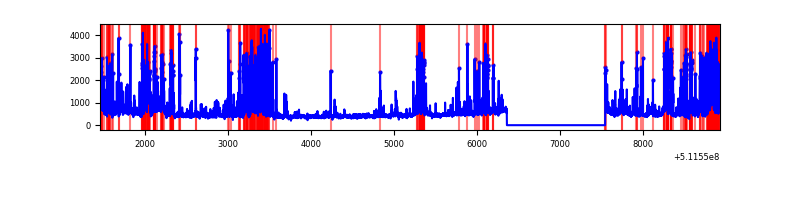 |
Top three noisy pixels from each quadrant. If the there are fewer than three noisy pixels in the level2.evt file, extra rows are filled as -1
| Pixel properties | Quadrant properties | ||||||
|---|---|---|---|---|---|---|---|
| Quadrant | DetID | PixID | Counts | Sigma | Mean | Median | Sigma |
| A | 12 | 3 | 384847 | 2332.69 | 668 | 651 | 164.7 |
| A | 10 | 251 | 369961 | 2242.31 | 668 | 651 | 164.7 |
| A | 12 | 194 | 60900 | 365.81 | 668 | 651 | 164.7 |
| B | 4 | 21 | 1685664 | 12175.1 | 648 | 625 | 138.4 |
| B | 5 | 185 | 141984 | 1021.38 | 648 | 625 | 138.4 |
| B | 10 | 247 | 103267 | 741.63 | 648 | 625 | 138.4 |
| C | 15 | 230 | 1360028 | 8025.32 | 618 | 612 | 169.4 |
| C | 1 | 16 | 219257 | 1290.77 | 618 | 612 | 169.4 |
| C | 12 | 112 | 129790 | 762.6 | 618 | 612 | 169.4 |
| D | 2 | 249 | 957735 | 5389.64 | 624 | 596 | 177.6 |
| D | 12 | 3 | 452590 | 2545.17 | 624 | 596 | 177.6 |
| D | 3 | 12 | 209513 | 1176.41 | 624 | 596 | 177.6 |
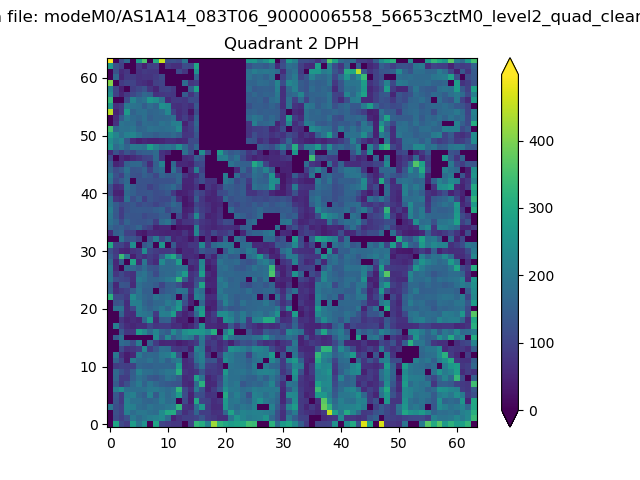
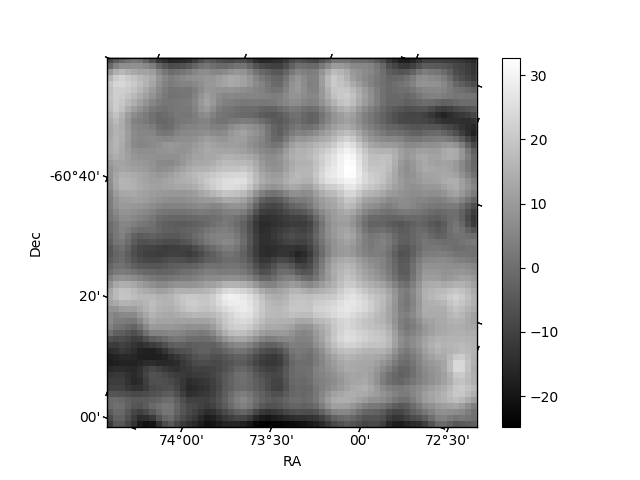
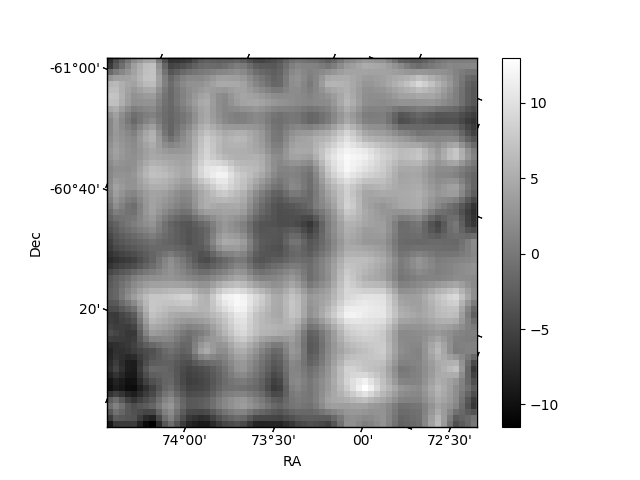
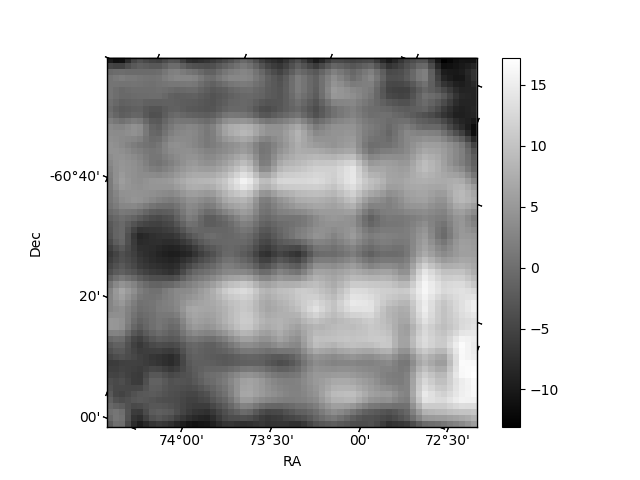
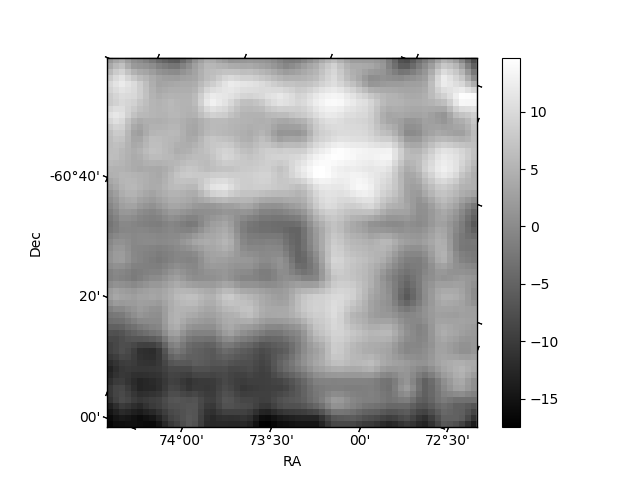
Histogram calculated using DETX and DETY for each event in the final _common_clean file
| Quadrant A | 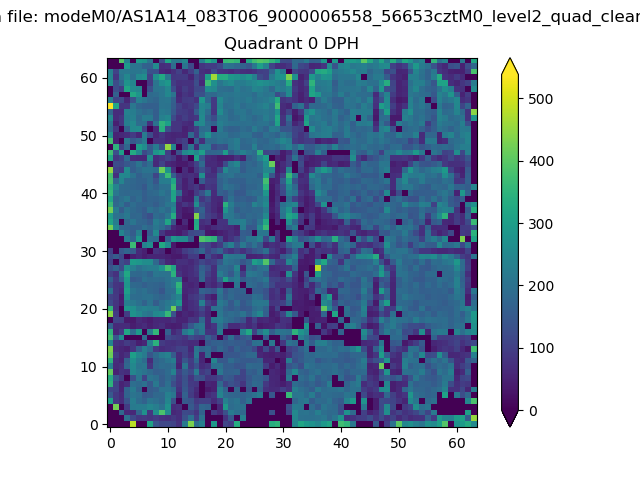 |
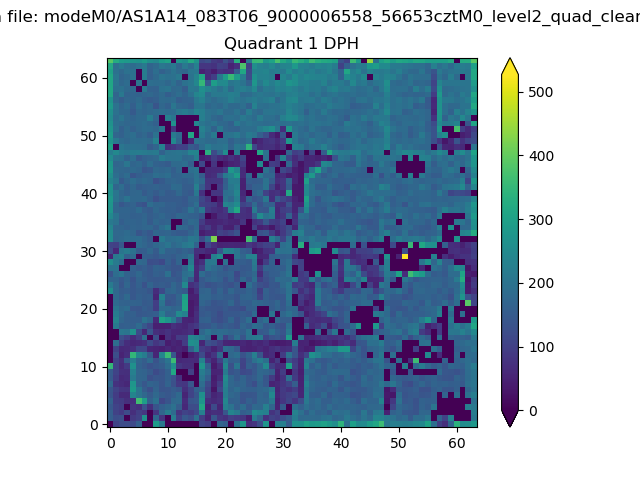 |
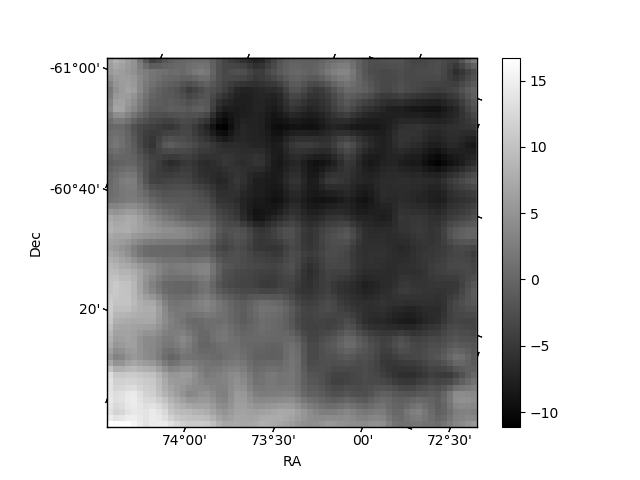
Quadrant B |
|---|---|---|---|
| Quadrant D | 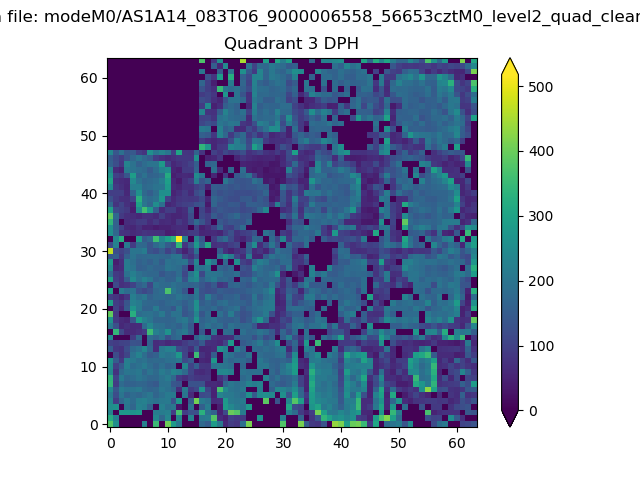 |
 |
Quadrant C |
| Plot type | Count rate plots | Images |
|---|---|---|
| Comparison with Poisson distribution Blue bars denote a histogram of data divided into 1 sec bins. Red curve is a Poisson curve with rate = median count rate of data. |
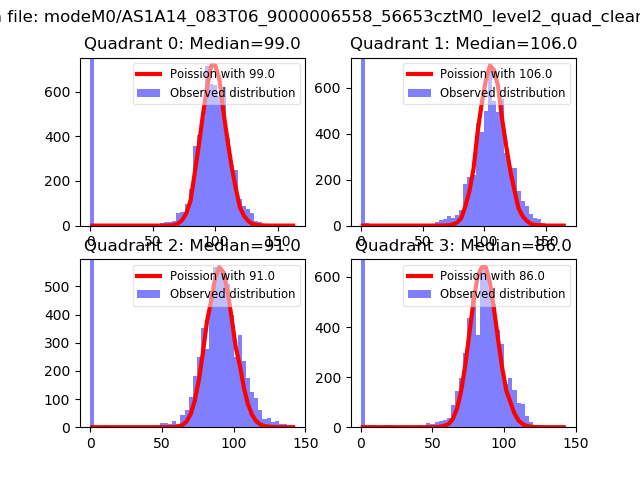 |
 |
| Quadrant-wise count rates Data is divided into 100 sec bins |
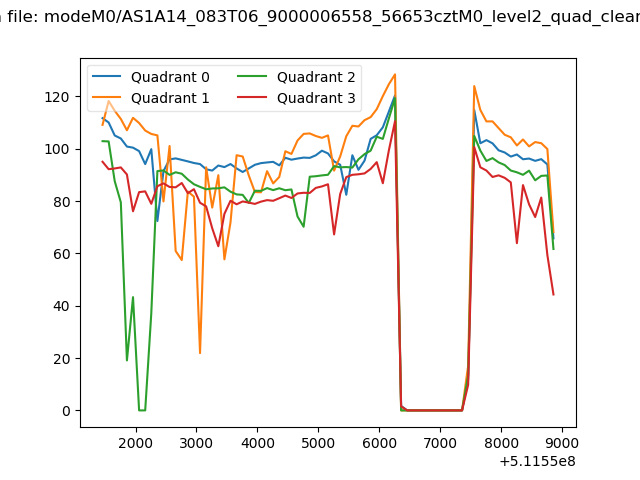 |
|
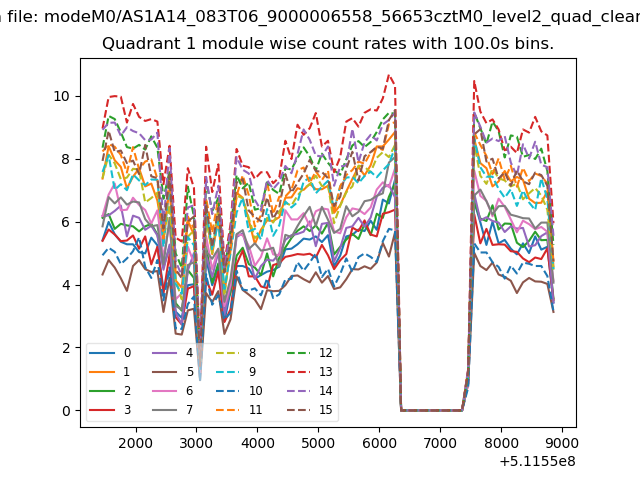
| Module-wise count rates for Quadrant A Data is divided into 100 sec bins |
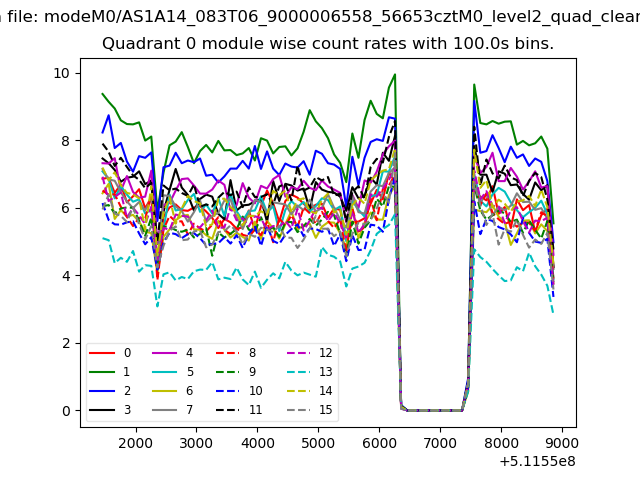 |
 |
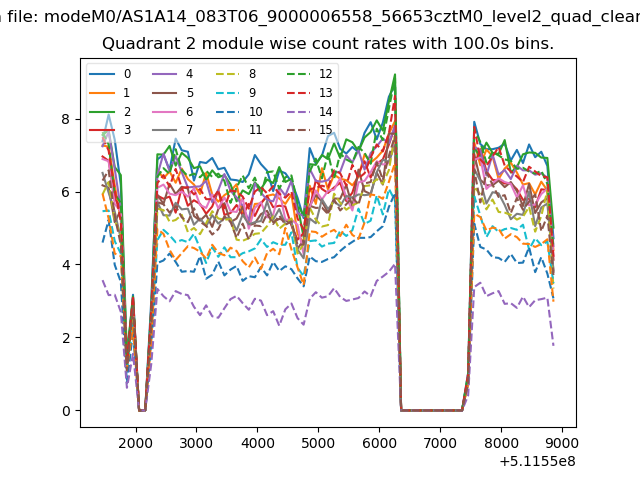
| Module-wise count rates for Quadrant B Data is divided into 100 sec bins |
 |
 |
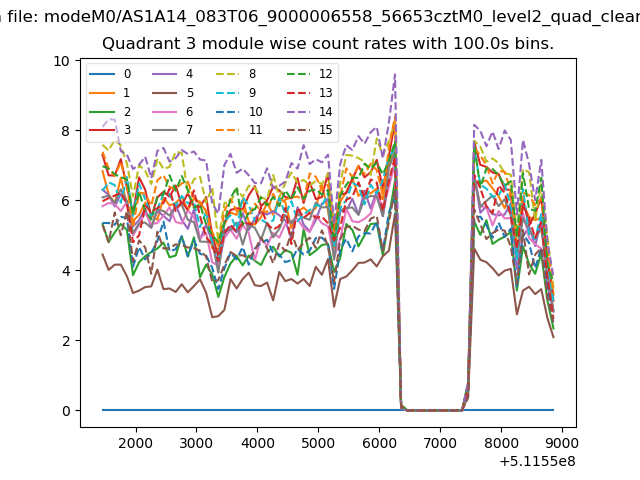
| Module-wise count rates for Quadrant C Data is divided into 100 sec bins |
 |
 |
| Module-wise count rates for Quadrant D Data is divided into 100 sec bins |
 |
 |
| Parameter | Plot |
|---|---|
| CZT HV Monitor | 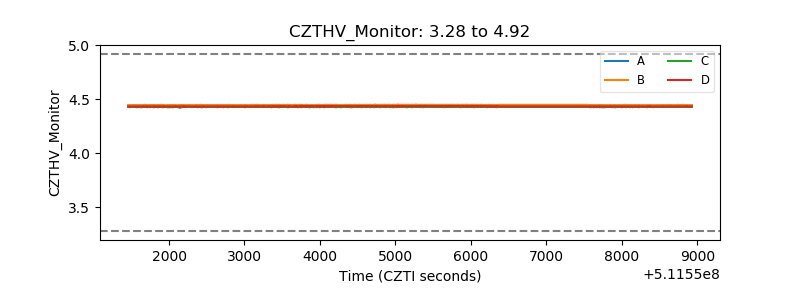 |
| D_VDD | 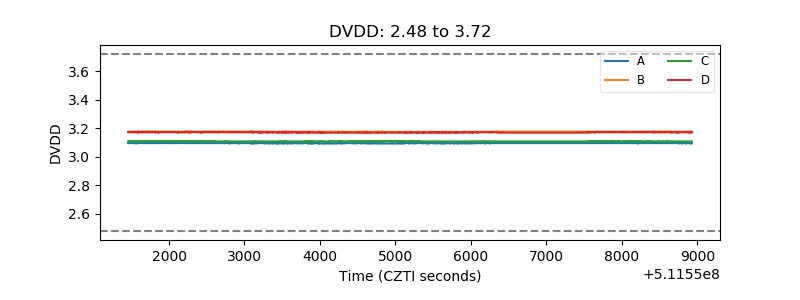 |
| Temperature 1 | 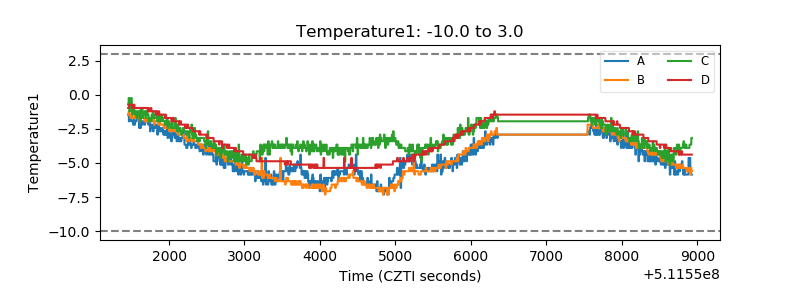 |
| Veto HV Monitor | 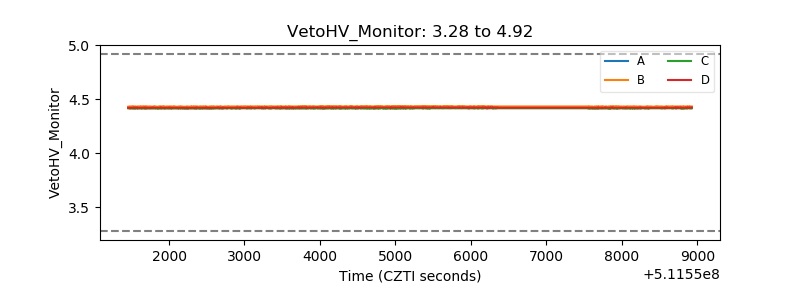 |
| Veto LLD | 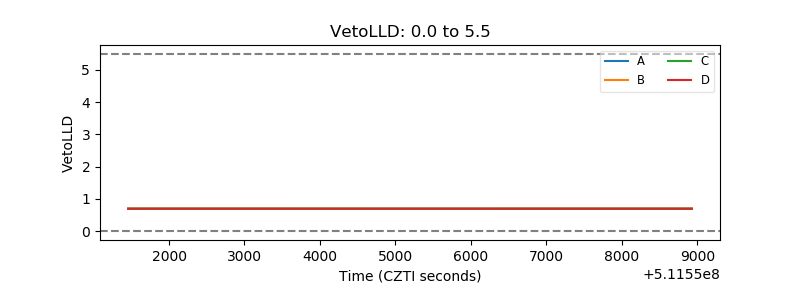 |
| Alpha Counter | 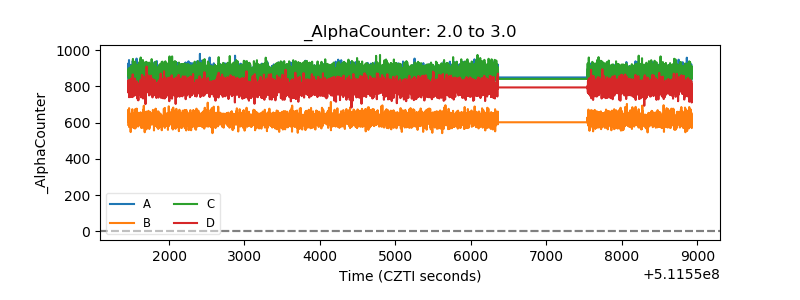 |
| _CPM_Rate | 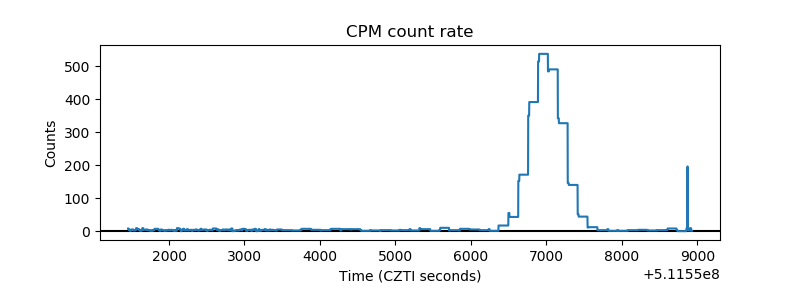 |
| CZT Counter | 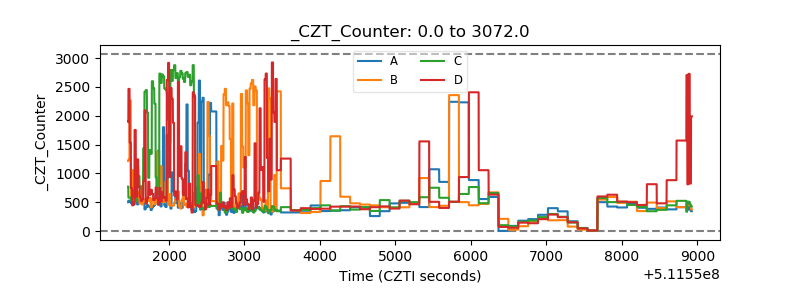 |
| +2.5 Volts monitor |  |
| +5 Volts monitor |  |
| _ROLL_ROT | 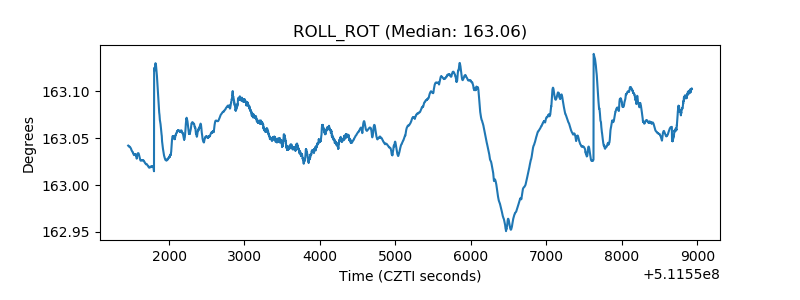 |
| _Roll_DEC | 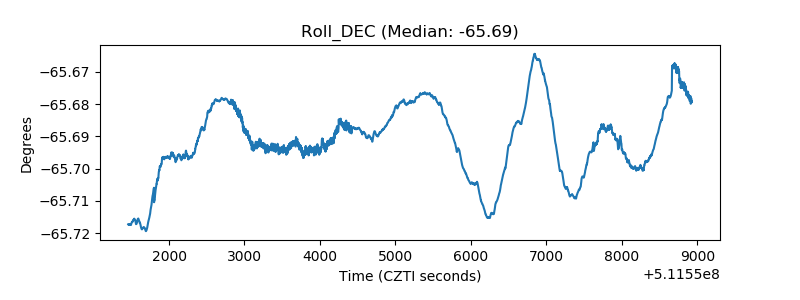 |
| _Roll_RA | 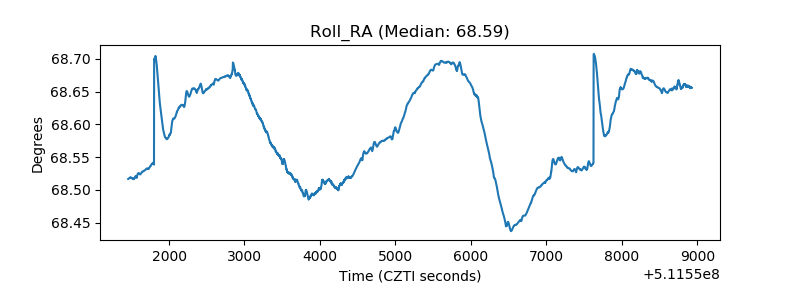 |
| Veto Counter | 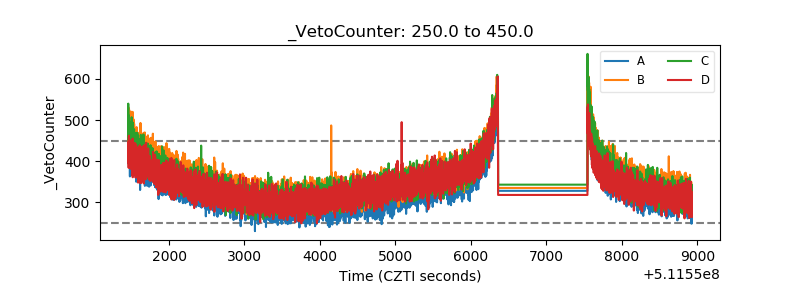 |