| Param | Original file | Final file |
|---|---|---|
| Filename | modeM0/AS1A14_083T06_9000006558_56657cztM0_level2.fits | modeM0/AS1A14_083T06_9000006558_56657cztM0_level2_quad_clean.evt |
| Size (bytes) | 648,201,600 | 119,594,880 |
| Size | 618.2 MB | 114.1 MB |
| Events in quadrant A | 4,841,950 | 803,997 |
| Events in quadrant B | 7,346,548 | 766,287 |
| Events in quadrant C | 4,950,645 | 762,469 |
| Events in quadrant D | 6,180,748 | 685,133 |
| Mode SS | |||
|---|---|---|---|
| Quadrant | BADHDUFLAG | Total packets | Discarded packets |
| A | 0 | 174 | 0 |
| B | 0 | 174 | 0 |
| C | 0 | 174 | 0 |
| D | 0 | 174 | 0 |
| Mode M9 | |||
|---|---|---|---|
| Quadrant | BADHDUFLAG | Total packets | Discarded packets |
| A | 0 | 1 | 0 |
| B | 0 | 1 | 0 |
| C | 0 | 1 | 0 |
| D | 0 | 1 | 0 |
| Mode M0 | |||
|---|---|---|---|
| Quadrant | BADHDUFLAG | Total packets | Discarded packets |
| A | 0 | 20929 | 1 |
| B | 0 | 28024 | 1 |
| C | 0 | 21299 | 1 |
| D | 0 | 24656 | 1 |
| Quadrant | Total seconds | Saturated seconds | Saturation percentage |
|---|---|---|---|
| A | 8691 | 265 | 3.049131% |
| B | 8691 | 1310 | 15.073064% |
| C | 8692 | 243 | 2.795674% |
| D | 8692 | 538 | 6.189600% |
Noise dominated data is calculated using 1-second bins in cleaned event files. If a bin has >2000 counts, and if more than 50% of those come from <1% of pixels, then it is considered to be noise-dominated and hence unusable.
| Quadrant | # 1 sec bins | Bins with >0 counts | Bins with >2000 counts | High rate bins dominated by noise | Noise dominated (total time) | Noise dominated (detector-on time) | Marked lightcurve |
|---|---|---|---|---|---|---|---|
| A | 8706 | 8692 | 161 | 161 | 1.85% | 1.85% | 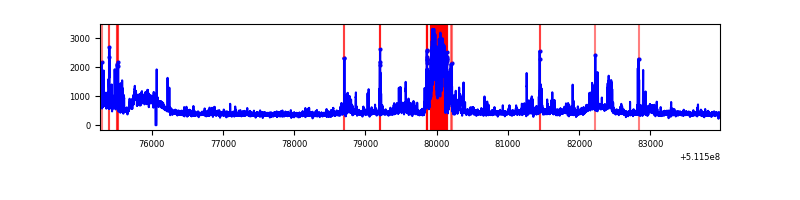 |
| B | 8706 | 8692 | 965 | 965 | 11.08% | 11.10% | 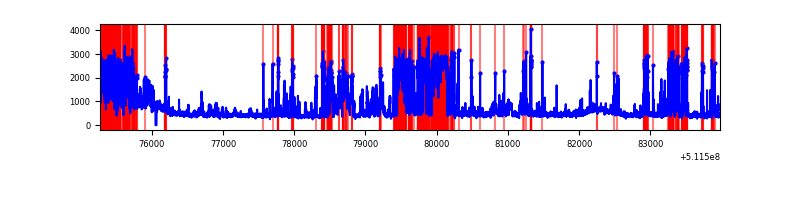 |
| C | 8707 | 8693 | 133 | 133 | 1.53% | 1.53% | 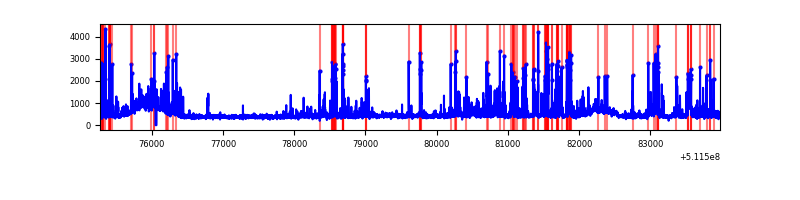 |
| D | 8707 | 8693 | 538 | 538 | 6.18% | 6.19% | 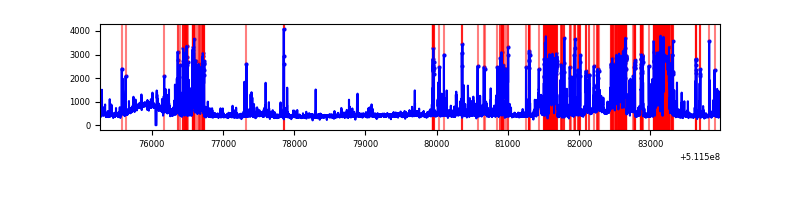 |
Top three noisy pixels from each quadrant. If the there are fewer than three noisy pixels in the level2.evt file, extra rows are filled as -1
| Pixel properties | Quadrant properties | ||||||
|---|---|---|---|---|---|---|---|
| Quadrant | DetID | PixID | Counts | Sigma | Mean | Median | Sigma |
| A | 12 | 3 | 577119 | 2466.86 | 950 | 923 | 233.6 |
| A | 8 | 249 | 146200 | 621.97 | 950 | 923 | 233.6 |
| A | 12 | 194 | 90232 | 382.36 | 950 | 923 | 233.6 |
| B | 4 | 206 | 3400449 | 17817.86 | 897 | 865 | 190.8 |
| B | 8 | 128 | 161456 | 841.69 | 897 | 865 | 190.8 |
| B | 4 | 21 | 84153 | 436.53 | 897 | 865 | 190.8 |
| C | 12 | 252 | 522947 | 2081.54 | 926 | 916 | 250.8 |
| C | 13 | 3 | 461337 | 1835.88 | 926 | 916 | 250.8 |
| C | 6 | 223 | 121449 | 480.61 | 926 | 916 | 250.8 |
| D | 3 | 12 | 973557 | 3873.54 | 900 | 859 | 251.1 |
| D | 2 | 249 | 790838 | 3145.91 | 900 | 859 | 251.1 |
| D | 2 | 31 | 222850 | 884.03 | 900 | 859 | 251.1 |
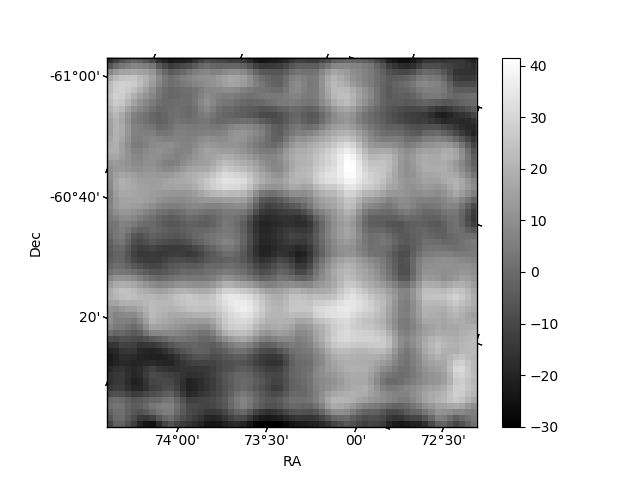
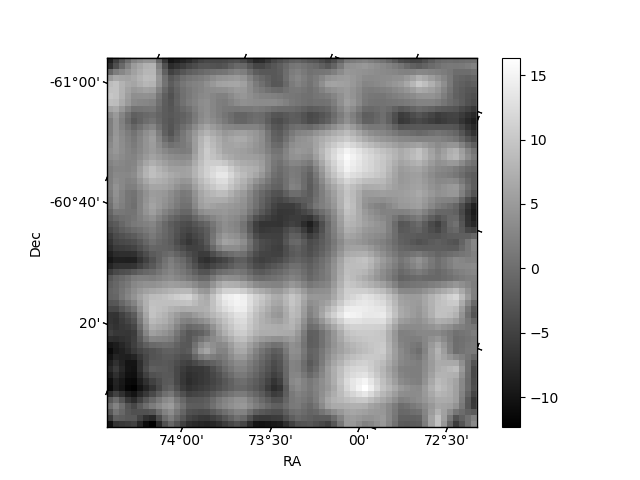
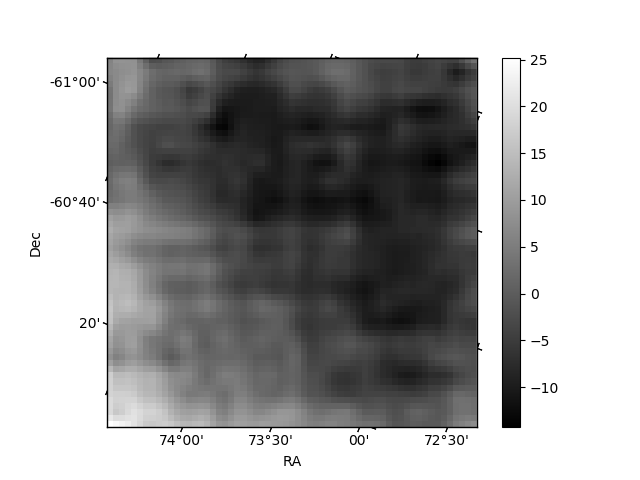
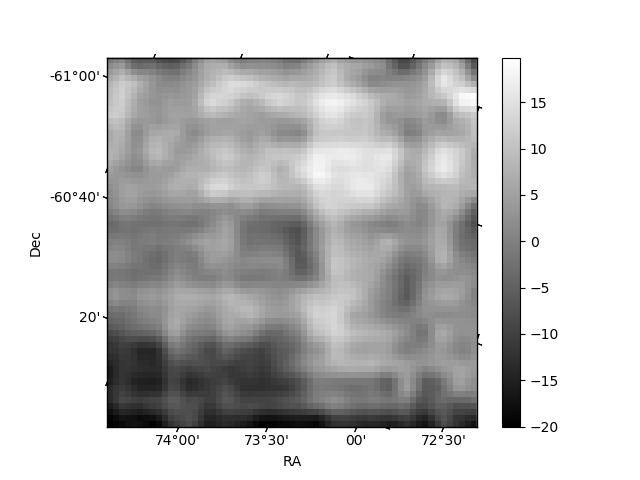
Histogram calculated using DETX and DETY for each event in the final _common_clean file
| Quadrant A | 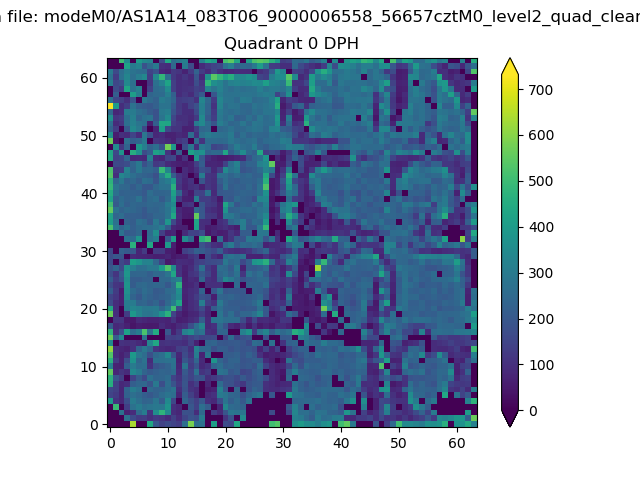 |
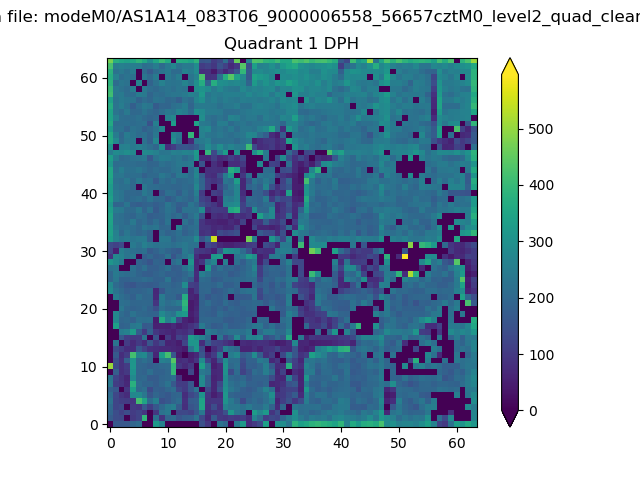 |
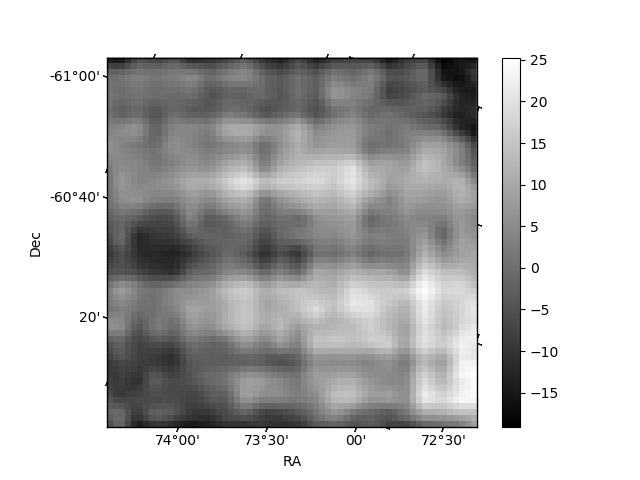
Quadrant B |
|---|---|---|---|
| Quadrant D | 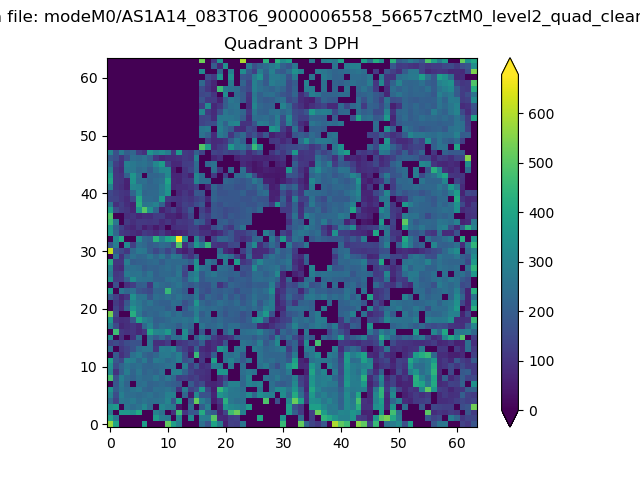 |
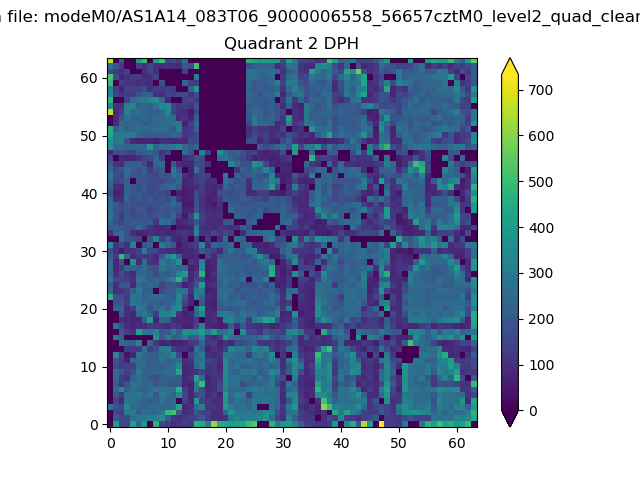 |
Quadrant C |
| Plot type | Count rate plots | Images |
|---|---|---|
| Comparison with Poisson distribution Blue bars denote a histogram of data divided into 1 sec bins. Red curve is a Poisson curve with rate = median count rate of data. |
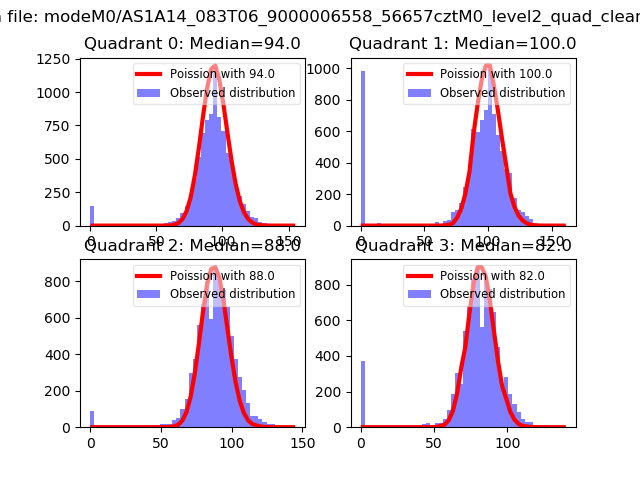 |
 |
| Quadrant-wise count rates Data is divided into 100 sec bins |
 |
|
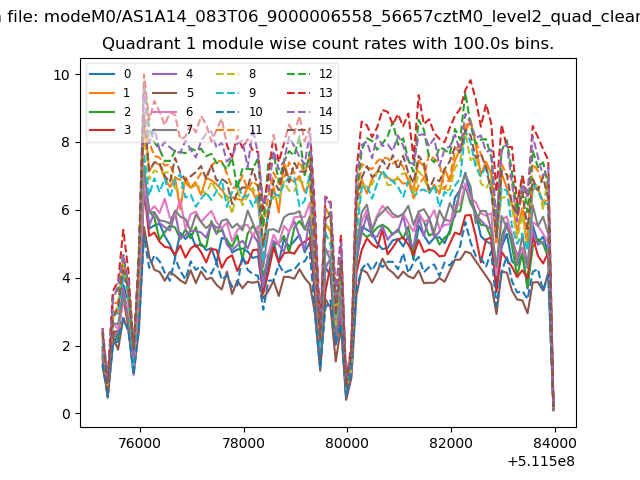
| Module-wise count rates for Quadrant A Data is divided into 100 sec bins |
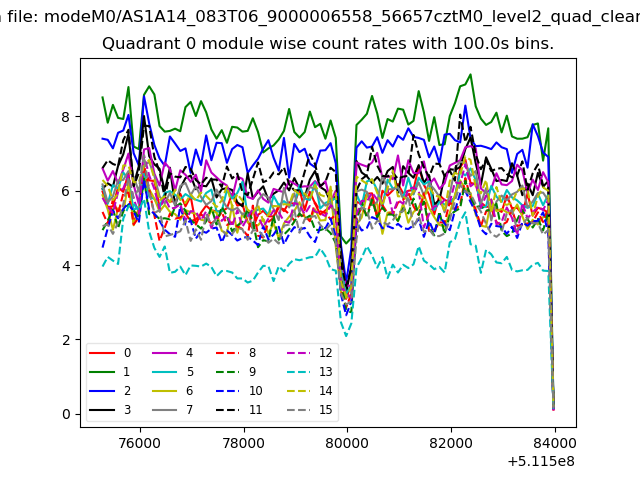 |
 |
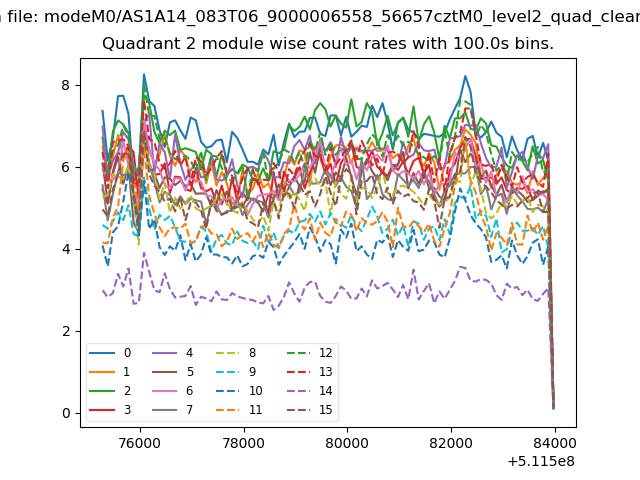
| Module-wise count rates for Quadrant B Data is divided into 100 sec bins |
 |
 |
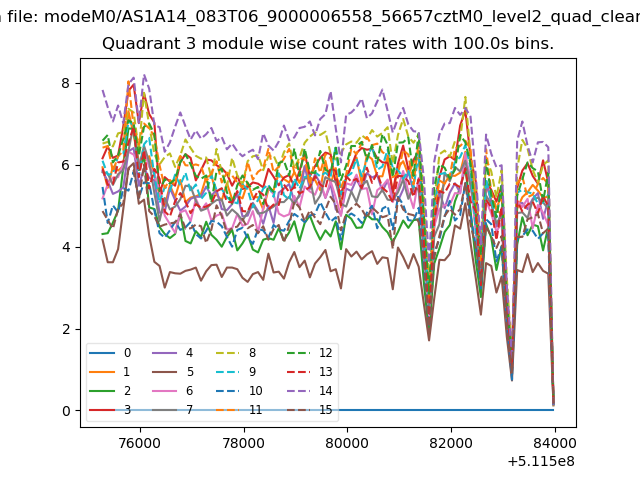
| Module-wise count rates for Quadrant C Data is divided into 100 sec bins |
 |
 |
| Module-wise count rates for Quadrant D Data is divided into 100 sec bins |
 |
 |
| Parameter | Plot |
|---|---|
| CZT HV Monitor | 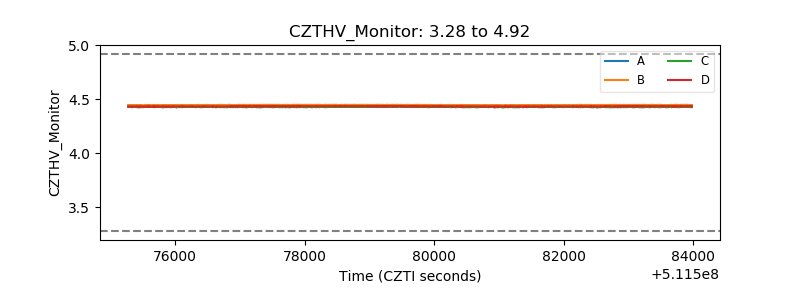 |
| D_VDD | 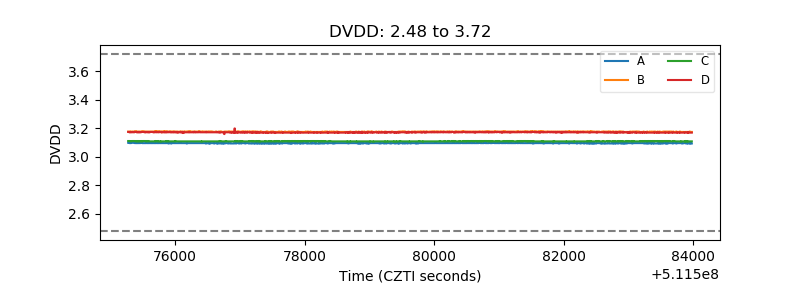 |
| Temperature 1 | 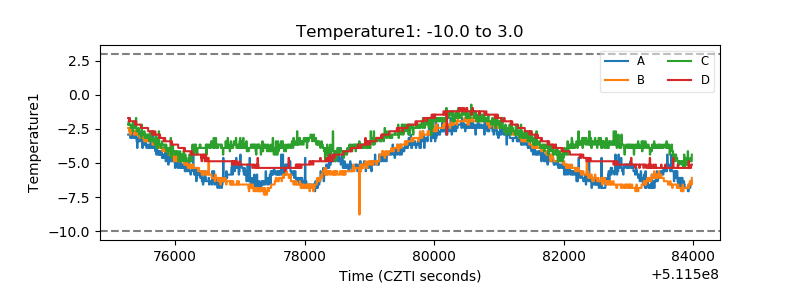 |
| Veto HV Monitor |  |
| Veto LLD | 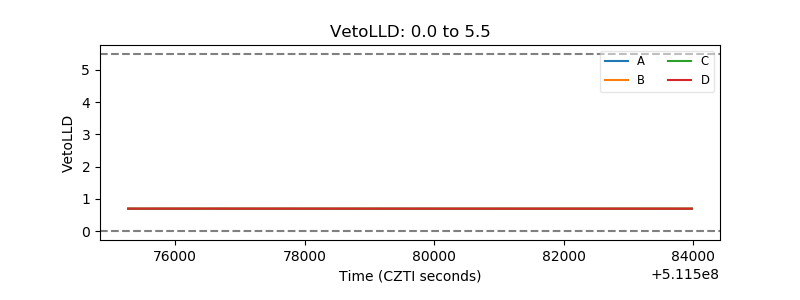 |
| Alpha Counter | 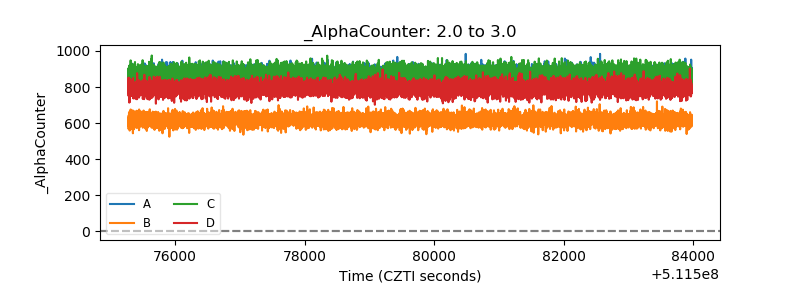 |
| _CPM_Rate | 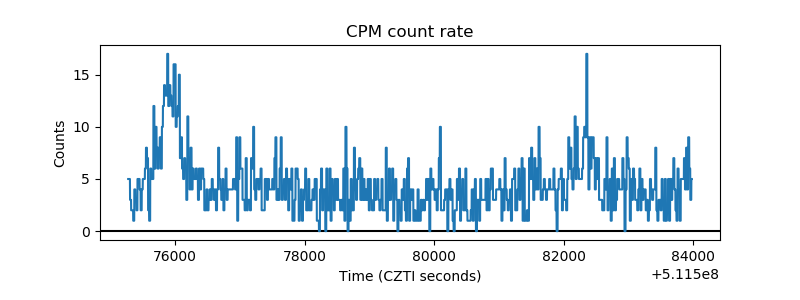 |
| CZT Counter | 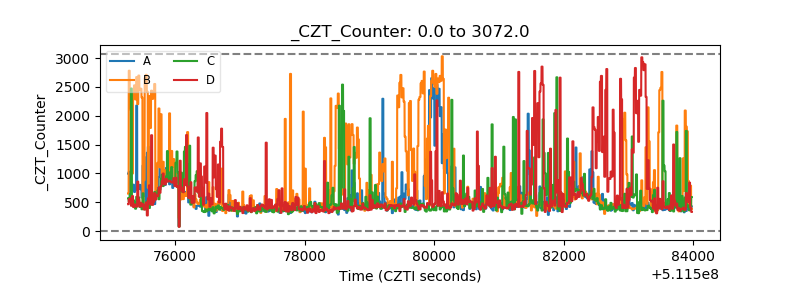 |
| +2.5 Volts monitor |  |
| +5 Volts monitor |  |
| _ROLL_ROT | 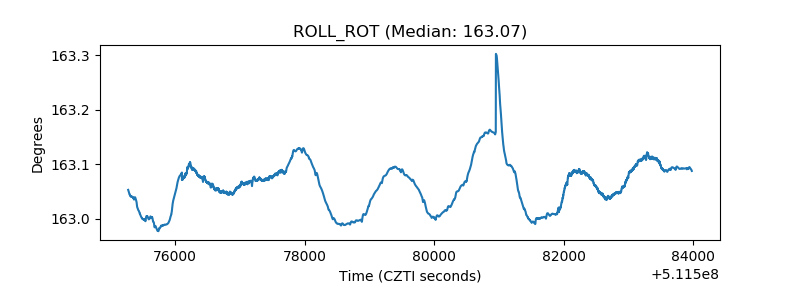 |
| _Roll_DEC | 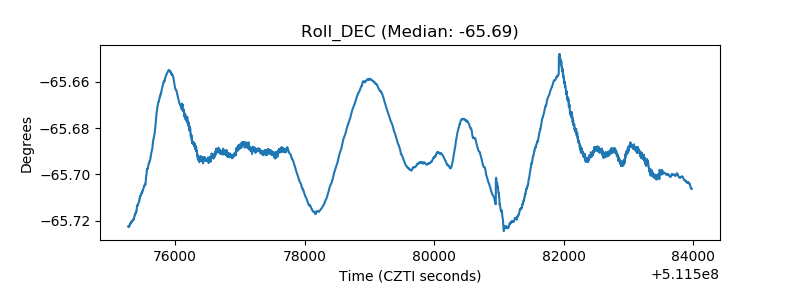 |
| _Roll_RA | 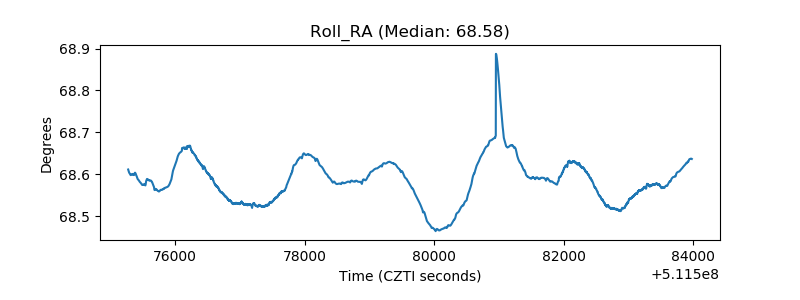 |
| Veto Counter | 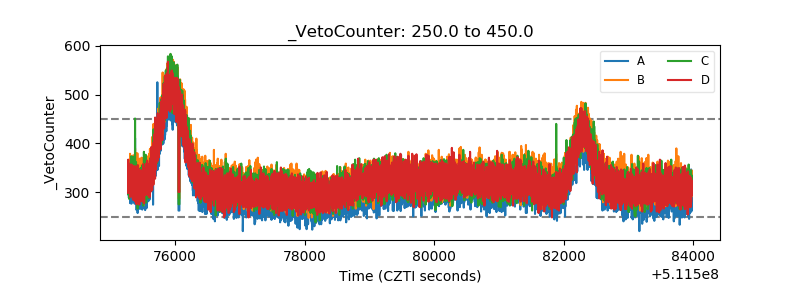 |