| Param | Original file | Final file |
|---|---|---|
| Filename | modeM0/AS1A14_083T06_9000006558_56661cztM0_level2.fits | modeM0/AS1A14_083T06_9000006558_56661cztM0_level2_quad_clean.evt |
| Size (bytes) | 1,515,634,560 | 258,618,240 |
| Size | 1.4 GB | 246.6 MB |
| Events in quadrant A | 11,200,735 | 1,751,808 |
| Events in quadrant B | 8,936,000 | 1,904,179 |
| Events in quadrant C | 15,219,445 | 1,457,483 |
| Events in quadrant D | 19,258,194 | 1,389,194 |
| Mode SS | |||
|---|---|---|---|
| Quadrant | BADHDUFLAG | Total packets | Discarded packets |
| A | 0 | 390 | 0 |
| B | 0 | 390 | 0 |
| C | 0 | 390 | 0 |
| D | 0 | 390 | 0 |
| Mode M9 | |||
|---|---|---|---|
| Quadrant | BADHDUFLAG | Total packets | Discarded packets |
| A | 0 | 13 | 0 |
| B | 0 | 13 | 0 |
| C | 0 | 13 | 0 |
| D | 0 | 13 | 0 |
| Mode M0 | |||
|---|---|---|---|
| Quadrant | BADHDUFLAG | Total packets | Discarded packets |
| A | 0 | 47171 | 3 |
| B | 0 | 40628 | 3 |
| C | 0 | 58680 | 4 |
| D | 0 | 70384 | 3 |
| Quadrant | Total seconds | Saturated seconds | Saturation percentage |
|---|---|---|---|
| A | 19265 | 564 | 2.927589% |
| B | 19266 | 447 | 2.320149% |
| C | 19265 | 2435 | 12.639502% |
| D | 19265 | 2367 | 12.286530% |
Noise dominated data is calculated using 1-second bins in cleaned event files. If a bin has >2000 counts, and if more than 50% of those come from <1% of pixels, then it is considered to be noise-dominated and hence unusable.
| Quadrant | # 1 sec bins | Bins with >0 counts | Bins with >2000 counts | High rate bins dominated by noise | Noise dominated (total time) | Noise dominated (detector-on time) | Marked lightcurve |
|---|---|---|---|---|---|---|---|
| A | 20530 | 19266 | 189 | 189 | 0.92% | 0.98% | 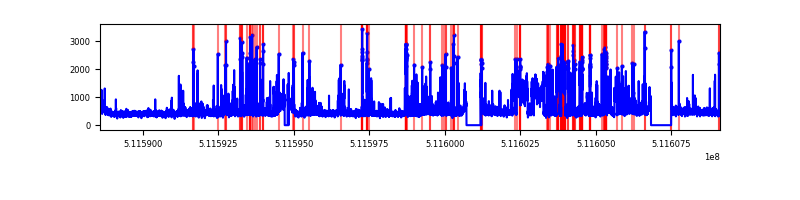 |
| B | 20531 | 19266 | 40 | 40 | 0.19% | 0.21% | 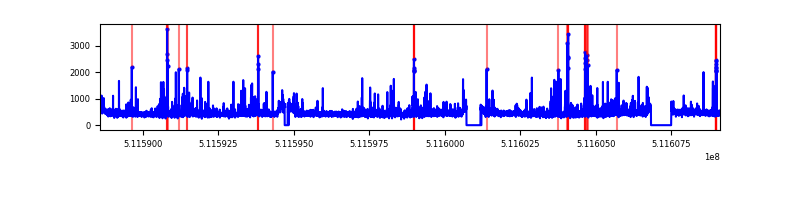 |
| C | 20530 | 19266 | 1875 | 1875 | 9.13% | 9.73% | 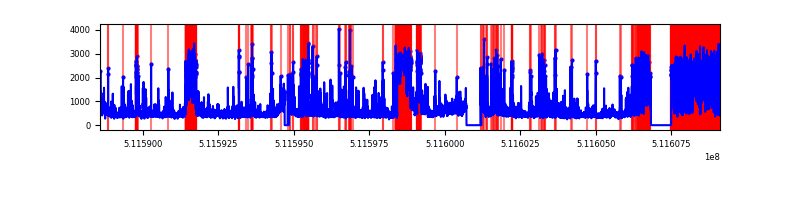 |
| D | 20530 | 19265 | 2230 | 2230 | 10.86% | 11.58% | 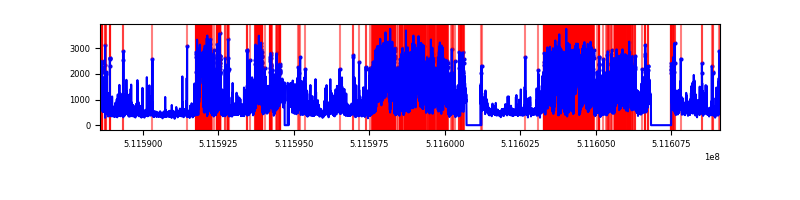 |
Top three noisy pixels from each quadrant. If the there are fewer than three noisy pixels in the level2.evt file, extra rows are filled as -1
| Pixel properties | Quadrant properties | ||||||
|---|---|---|---|---|---|---|---|
| Quadrant | DetID | PixID | Counts | Sigma | Mean | Median | Sigma |
| A | 3 | 14 | 1601952 | 3162.92 | 2072 | 2020 | 505.8 |
| A | 0 | 8 | 717771 | 1414.97 | 2072 | 2020 | 505.8 |
| A | 3 | 62 | 221641 | 434.17 | 2072 | 2020 | 505.8 |
| B | 4 | 21 | 218903 | 493.51 | 2062 | 1979 | 439.6 |
| B | 4 | 156 | 93392 | 207.97 | 2062 | 1979 | 439.6 |
| B | 10 | 247 | 88353 | 196.5 | 2062 | 1979 | 439.6 |
| C | 15 | 205 | 3229377 | 6126.06 | 1926 | 1907 | 526.8 |
| C | 15 | 208 | 1427201 | 2705.35 | 1926 | 1907 | 526.8 |
| C | 1 | 16 | 752023 | 1423.8 | 1926 | 1907 | 526.8 |
| D | 10 | 199 | 5992404 | 10967.6 | 1942 | 1860 | 546.2 |
| D | 2 | 249 | 3316844 | 6069.13 | 1942 | 1860 | 546.2 |
| D | 8 | 240 | 1247185 | 2279.96 | 1942 | 1860 | 546.2 |
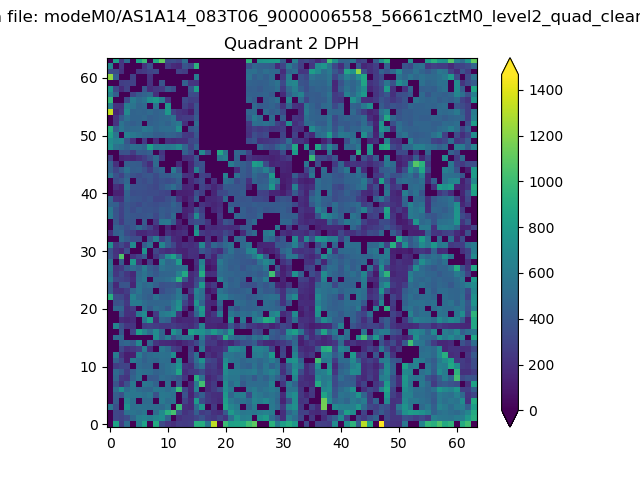
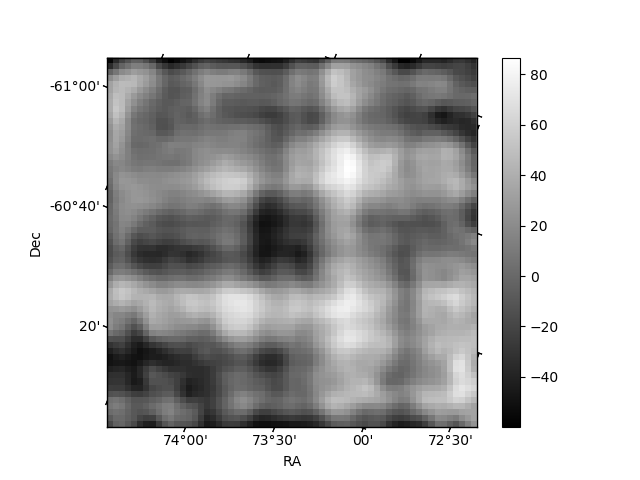
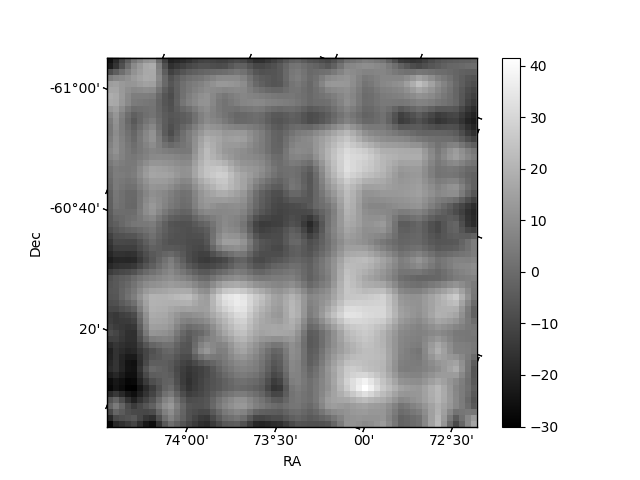
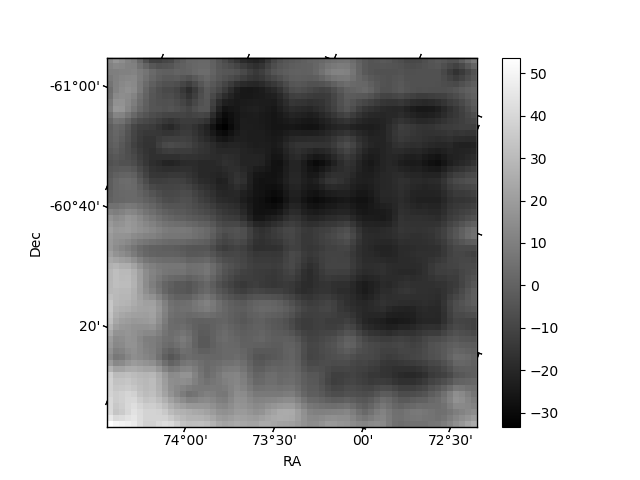
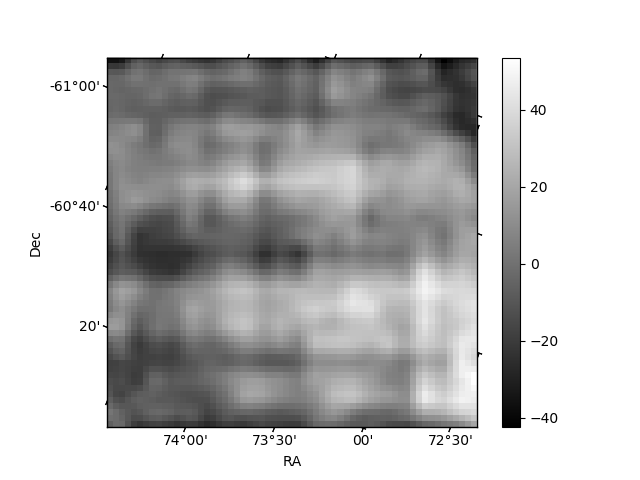
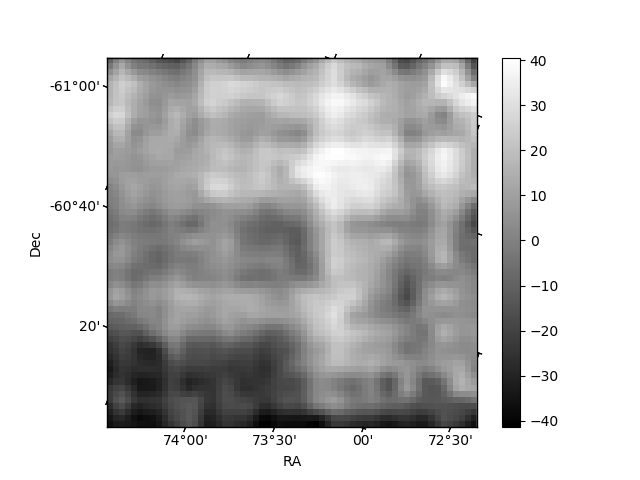
Histogram calculated using DETX and DETY for each event in the final _common_clean file
| Quadrant A | 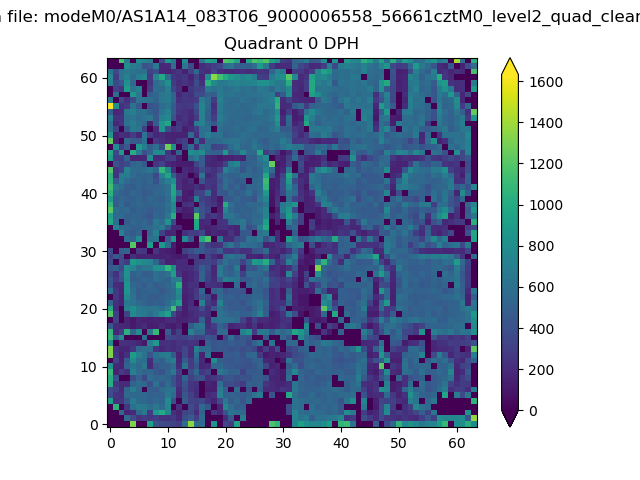 |
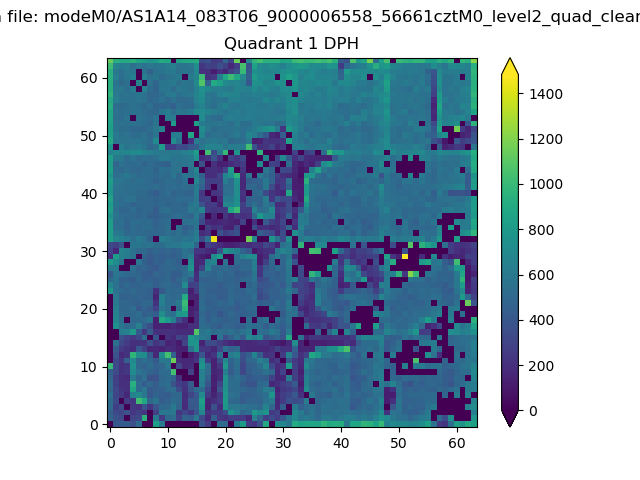 |
Quadrant B |
|---|---|---|---|
| Quadrant D | 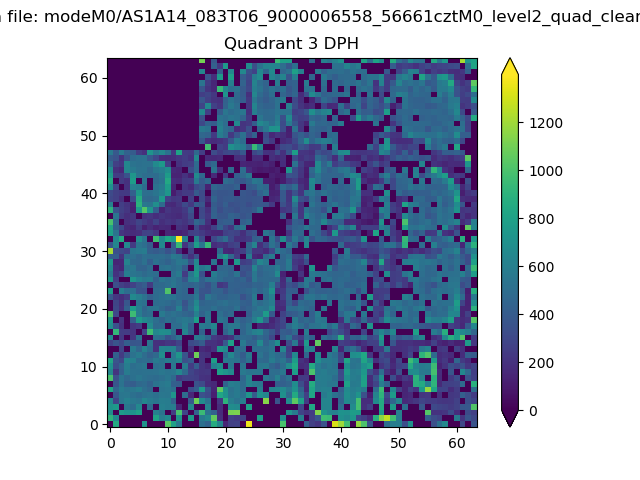 |
 |
Quadrant C |
| Plot type | Count rate plots | Images |
|---|---|---|
| Comparison with Poisson distribution Blue bars denote a histogram of data divided into 1 sec bins. Red curve is a Poisson curve with rate = median count rate of data. |
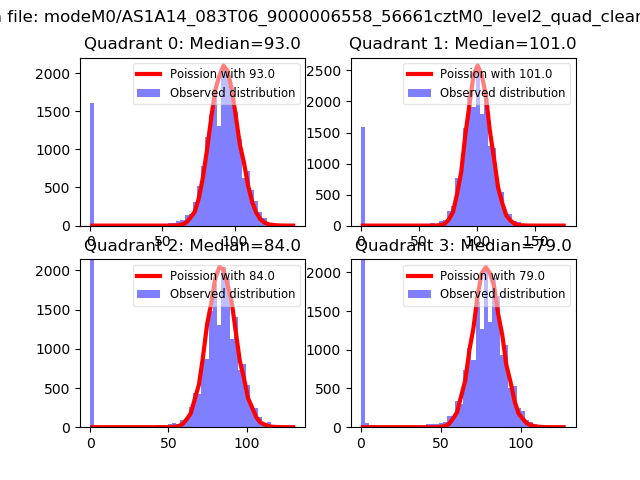 |
 |
| Quadrant-wise count rates Data is divided into 100 sec bins |
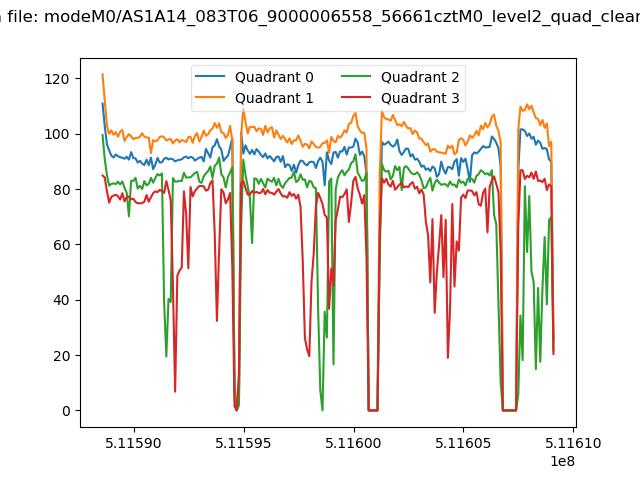 |
|
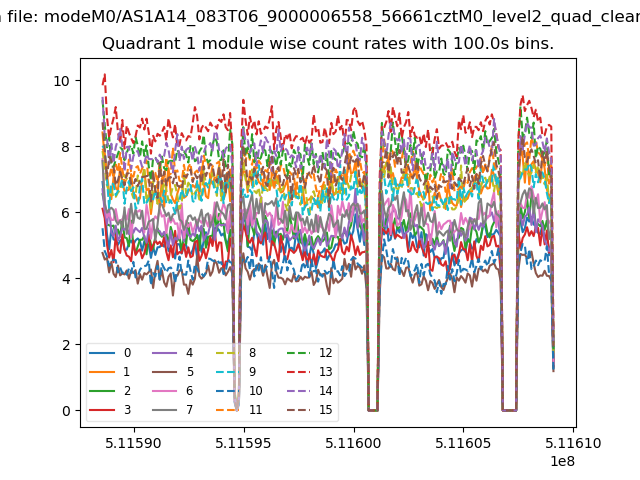
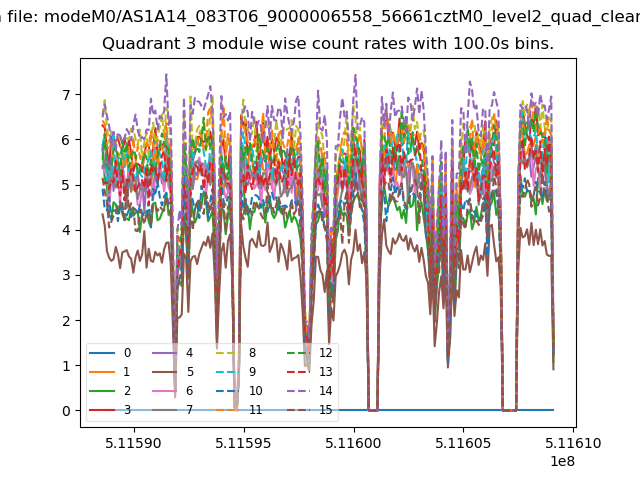
| Module-wise count rates for Quadrant A Data is divided into 100 sec bins |
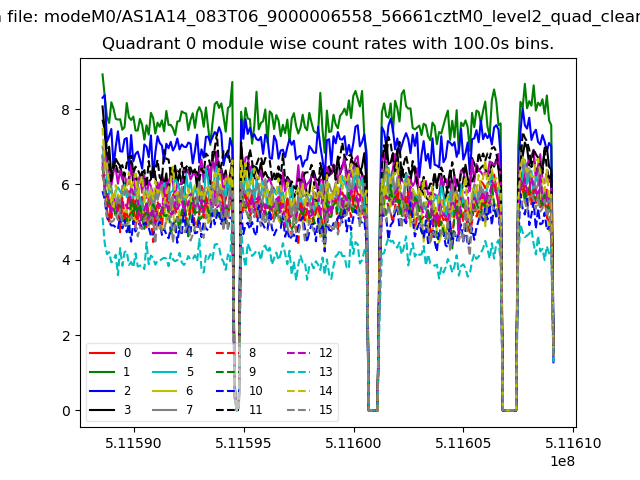 |
 |
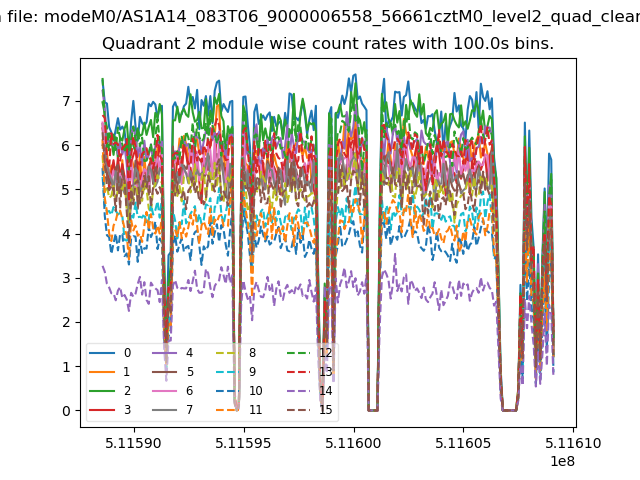
| Module-wise count rates for Quadrant B Data is divided into 100 sec bins |
 |
 |
| Module-wise count rates for Quadrant C Data is divided into 100 sec bins |
 |
 |
| Module-wise count rates for Quadrant D Data is divided into 100 sec bins |
 |
 |
| Parameter | Plot |
|---|---|
| CZT HV Monitor | 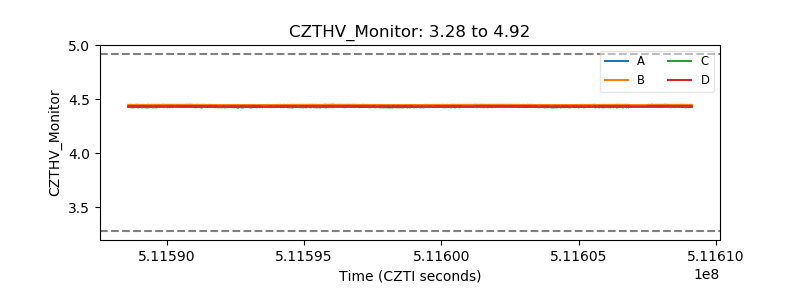 |
| D_VDD | 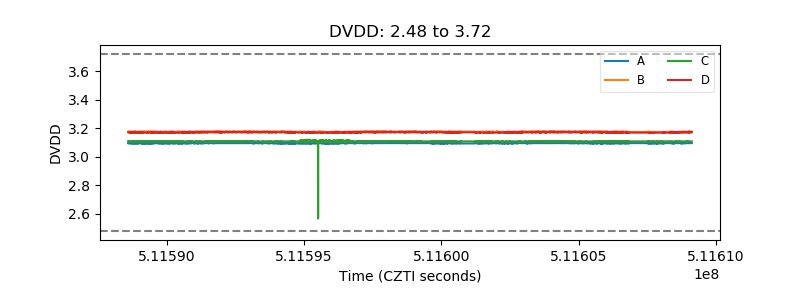 |
| Temperature 1 | 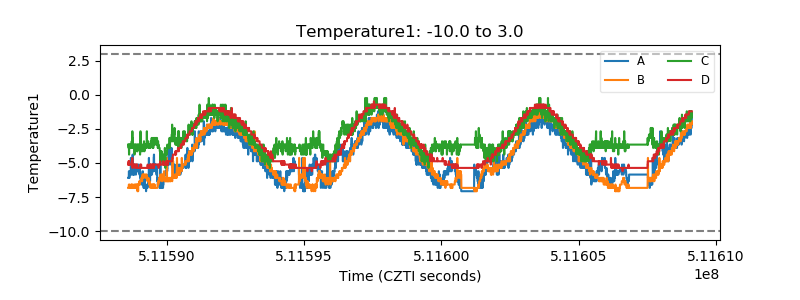 |
| Veto HV Monitor | 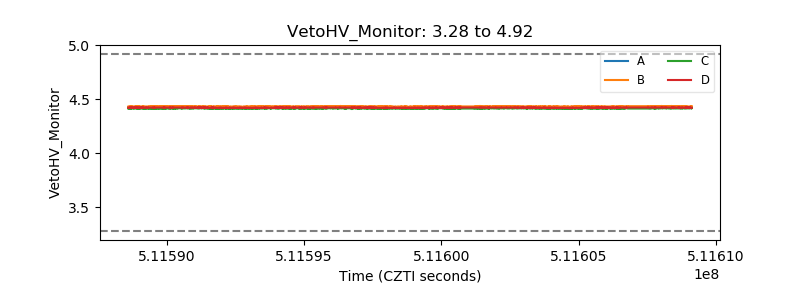 |
| Veto LLD | 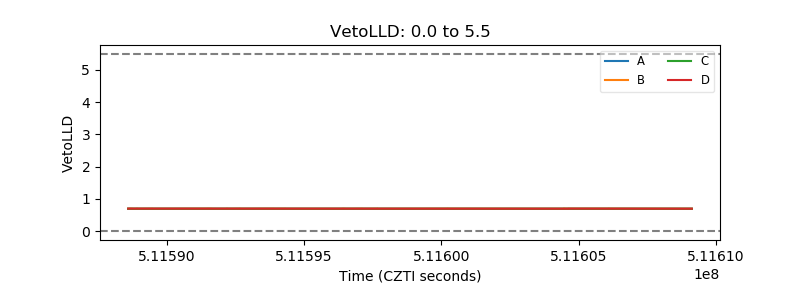 |
| Alpha Counter | 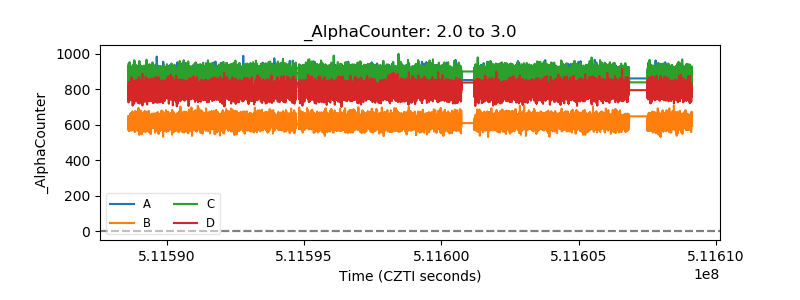 |
| _CPM_Rate | 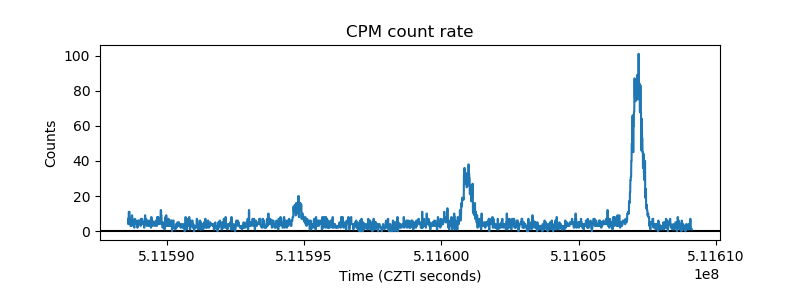 |
| CZT Counter | 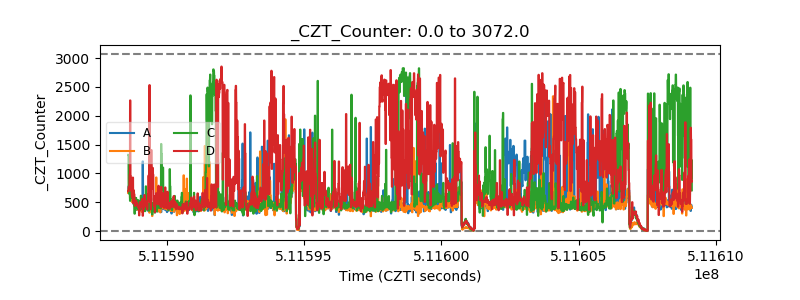 |
| +2.5 Volts monitor |  |
| +5 Volts monitor |  |
| _ROLL_ROT | 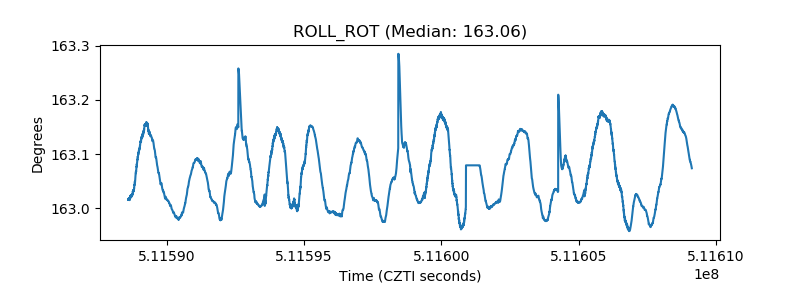 |
| _Roll_DEC | 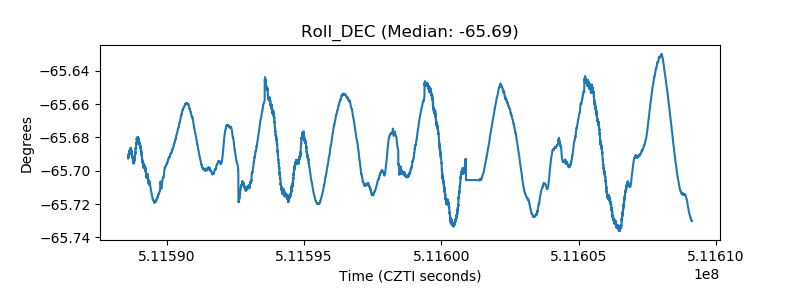 |
| _Roll_RA | 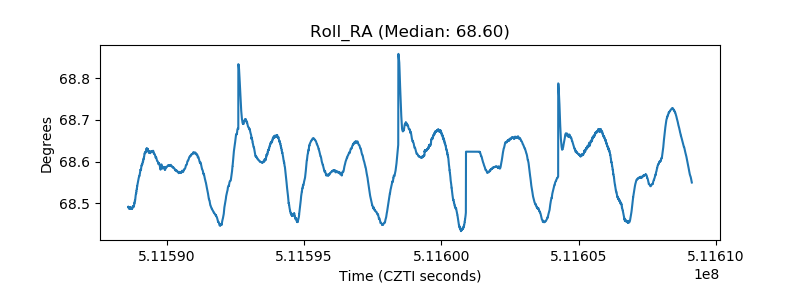 |
| Veto Counter | 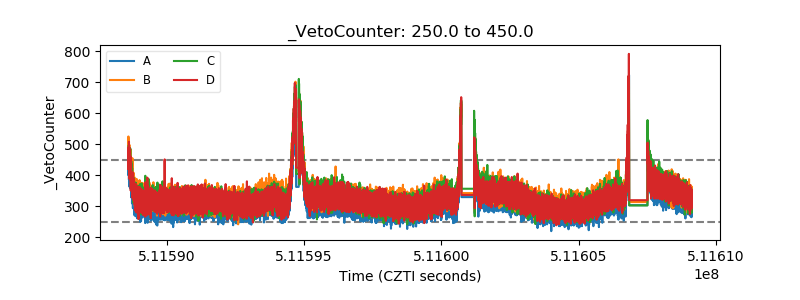 |