| Param | Original file | Final file |
|---|---|---|
| Filename | modeM0/AS1A14_083T06_9000006558_56662cztM0_level2.fits | modeM0/AS1A14_083T06_9000006558_56662cztM0_level2_quad_clean.evt |
| Size (bytes) | 623,833,920 | 87,013,440 |
| Size | 594.9 MB | 83.0 MB |
| Events in quadrant A | 3,019,392 | 603,079 |
| Events in quadrant B | 3,292,747 | 642,997 |
| Events in quadrant C | 9,481,434 | 432,892 |
| Events in quadrant D | 6,801,007 | 507,732 |
| Mode SS | |||
|---|---|---|---|
| Quadrant | BADHDUFLAG | Total packets | Discarded packets |
| A | 0 | 128 | 0 |
| B | 0 | 128 | 0 |
| C | 0 | 128 | 0 |
| D | 0 | 128 | 0 |
| Mode M9 | |||
|---|---|---|---|
| Quadrant | BADHDUFLAG | Total packets | Discarded packets |
| A | 0 | 9 | 0 |
| B | 0 | 9 | 0 |
| C | 0 | 9 | 0 |
| D | 0 | 9 | 0 |
| Mode M0 | |||
|---|---|---|---|
| Quadrant | BADHDUFLAG | Total packets | Discarded packets |
| A | 0 | 13517 | 1 |
| B | 0 | 14376 | 1 |
| C | 0 | 32558 | 1 |
| D | 0 | 24637 | 1 |
| Quadrant | Total seconds | Saturated seconds | Saturation percentage |
|---|---|---|---|
| A | 6423 | 75 | 1.167679% |
| B | 6423 | 164 | 2.553324% |
| C | 6423 | 2018 | 31.418340% |
| D | 6423 | 588 | 9.154601% |
Noise dominated data is calculated using 1-second bins in cleaned event files. If a bin has >2000 counts, and if more than 50% of those come from <1% of pixels, then it is considered to be noise-dominated and hence unusable.
| Quadrant | # 1 sec bins | Bins with >0 counts | Bins with >2000 counts | High rate bins dominated by noise | Noise dominated (total time) | Noise dominated (detector-on time) | Marked lightcurve |
|---|---|---|---|---|---|---|---|
| A | 7263 | 6423 | 5 | 5 | 0.07% | 0.08% | 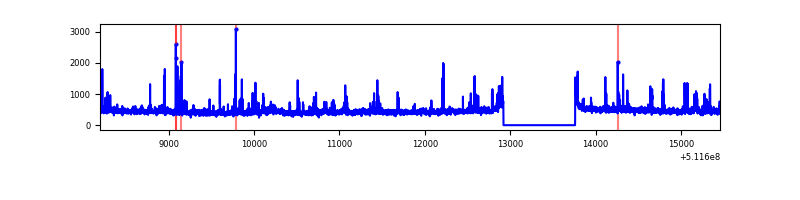 |
| B | 7263 | 6423 | 83 | 83 | 1.14% | 1.29% | 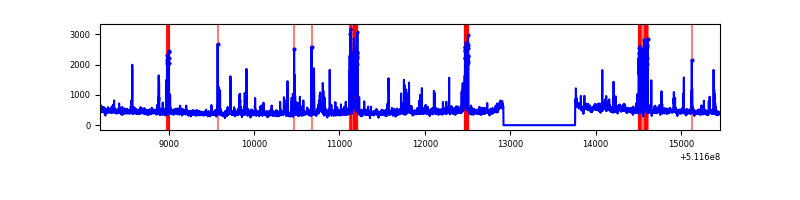 |
| C | 7263 | 6423 | 2048 | 2048 | 28.20% | 31.89% | 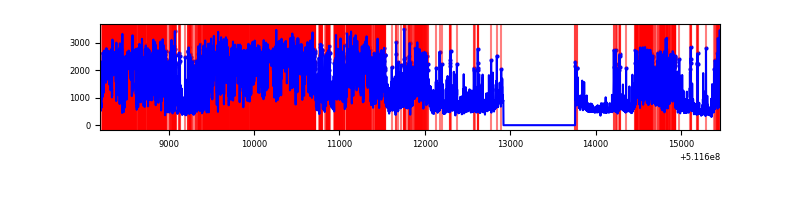 |
| D | 7263 | 6423 | 636 | 636 | 8.76% | 9.90% | 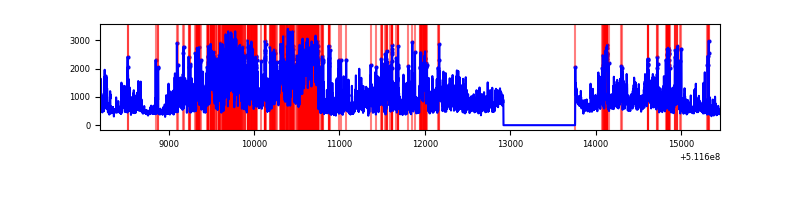 |
Top three noisy pixels from each quadrant. If the there are fewer than three noisy pixels in the level2.evt file, extra rows are filled as -1
| Pixel properties | Quadrant properties | ||||||
|---|---|---|---|---|---|---|---|
| Quadrant | DetID | PixID | Counts | Sigma | Mean | Median | Sigma |
| A | 4 | 249 | 121951 | 713.61 | 691 | 674 | 169.9 |
| A | 8 | 249 | 50254 | 291.74 | 691 | 674 | 169.9 |
| A | 0 | 12 | 30635 | 176.3 | 691 | 674 | 169.9 |
| B | 4 | 156 | 209045 | 1426.75 | 678 | 653 | 146.1 |
| B | 4 | 21 | 82213 | 558.4 | 678 | 653 | 146.1 |
| B | 10 | 247 | 68232 | 462.68 | 678 | 653 | 146.1 |
| C | 15 | 205 | 6017088 | 36896.18 | 597 | 589 | 163.1 |
| C | 13 | 3 | 485033 | 2970.85 | 597 | 589 | 163.1 |
| C | 12 | 252 | 236004 | 1443.68 | 597 | 589 | 163.1 |
| D | 10 | 199 | 2100987 | 11319.15 | 649 | 619 | 185.6 |
| D | 2 | 249 | 1324080 | 7132.3 | 649 | 619 | 185.6 |
| D | 8 | 160 | 197353 | 1060.22 | 649 | 619 | 185.6 |
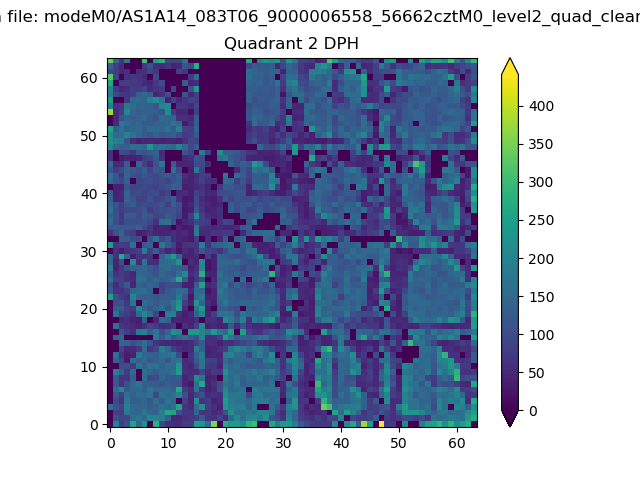
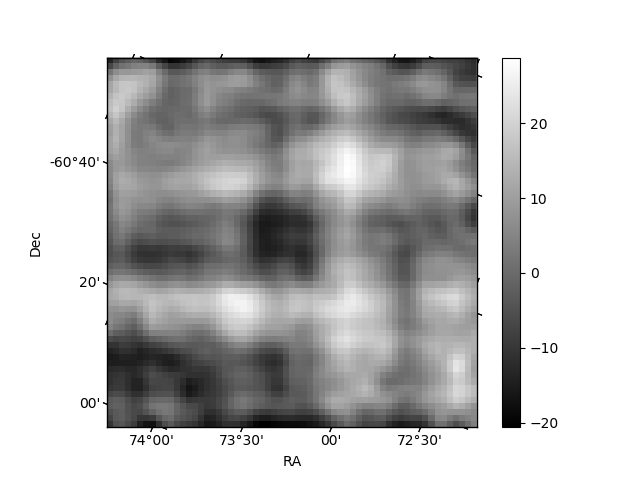
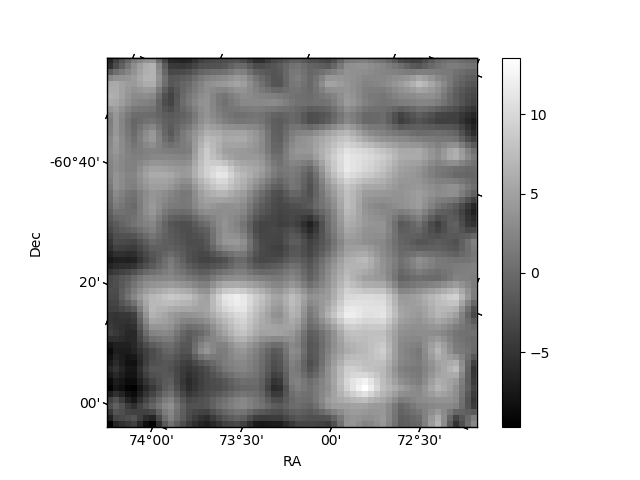
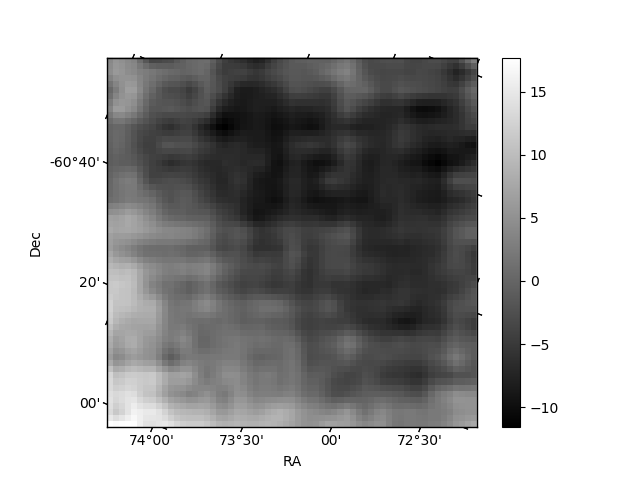
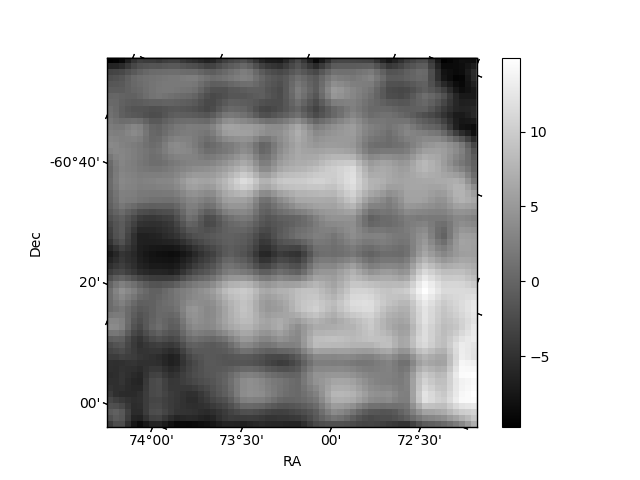
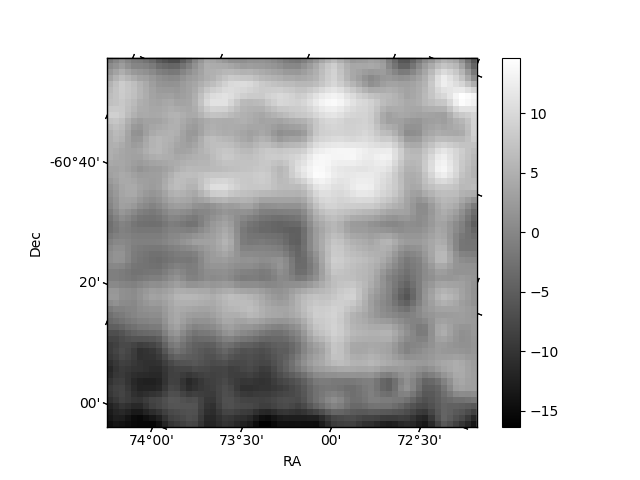
Histogram calculated using DETX and DETY for each event in the final _common_clean file
| Quadrant A | 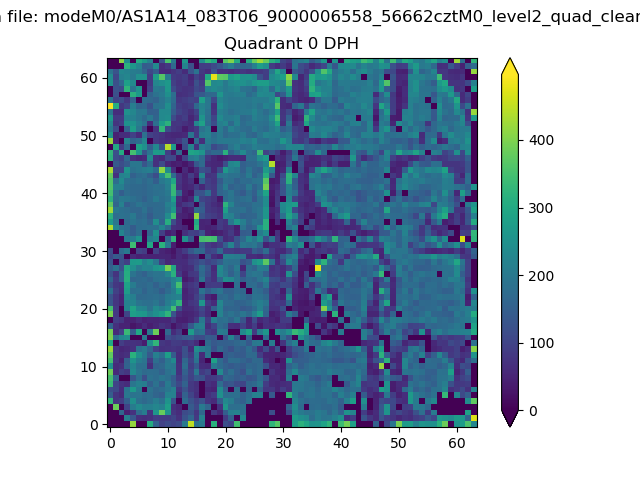 |
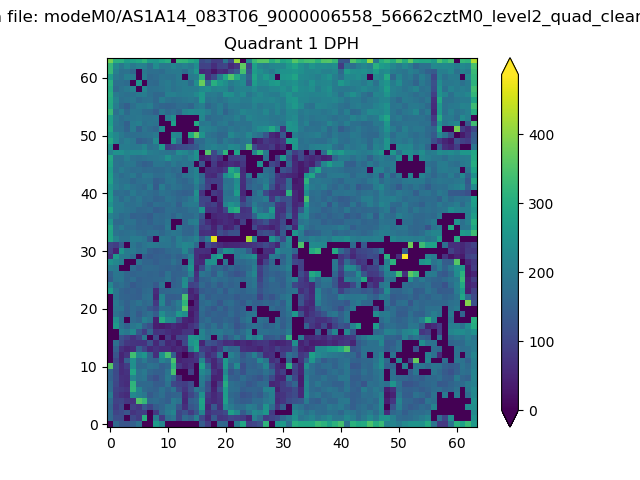 |
Quadrant B |
|---|---|---|---|
| Quadrant D | 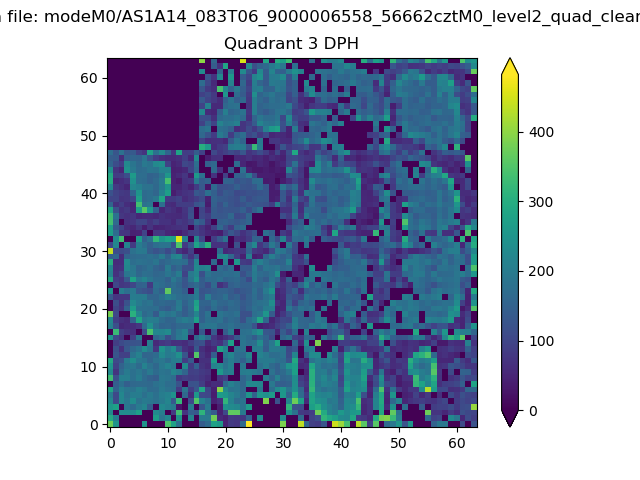 |
 |
Quadrant C |
| Plot type | Count rate plots | Images |
|---|---|---|
| Comparison with Poisson distribution Blue bars denote a histogram of data divided into 1 sec bins. Red curve is a Poisson curve with rate = median count rate of data. |
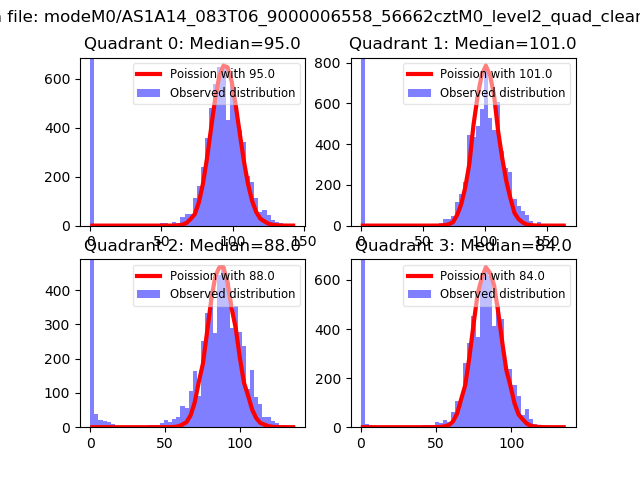 |
 |
| Quadrant-wise count rates Data is divided into 100 sec bins |
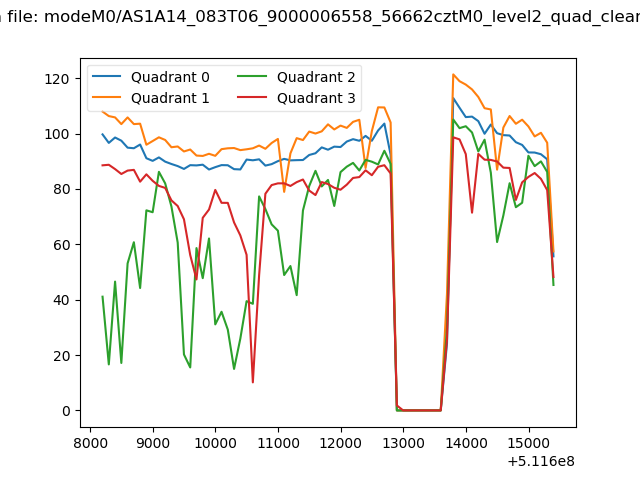 |
|
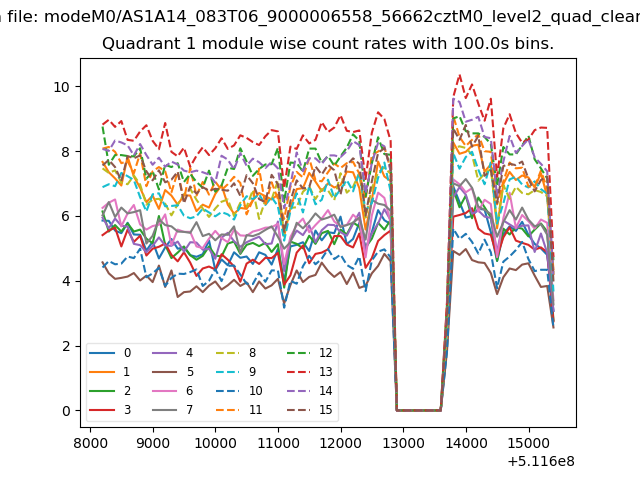
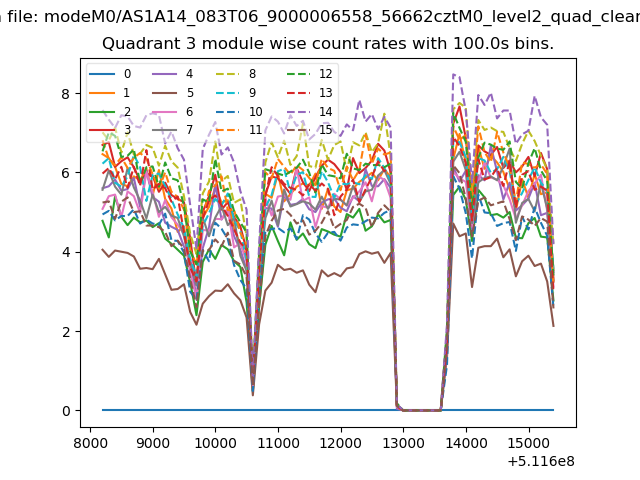
| Module-wise count rates for Quadrant A Data is divided into 100 sec bins |
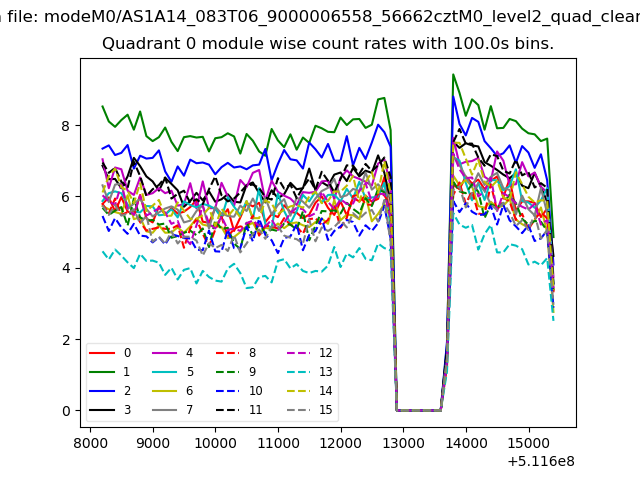 |
 |
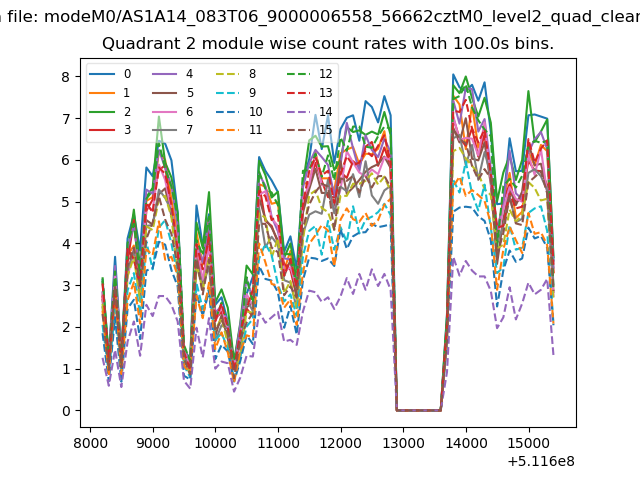
| Module-wise count rates for Quadrant B Data is divided into 100 sec bins |
 |
 |
| Module-wise count rates for Quadrant C Data is divided into 100 sec bins |
 |
 |
| Module-wise count rates for Quadrant D Data is divided into 100 sec bins |
 |
 |
| Parameter | Plot |
|---|---|
| CZT HV Monitor |  |
| D_VDD | 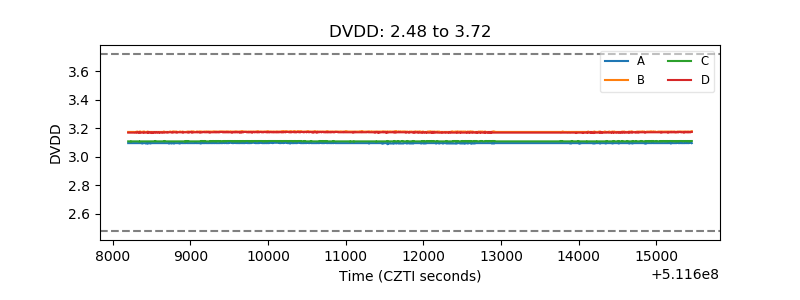 |
| Temperature 1 | 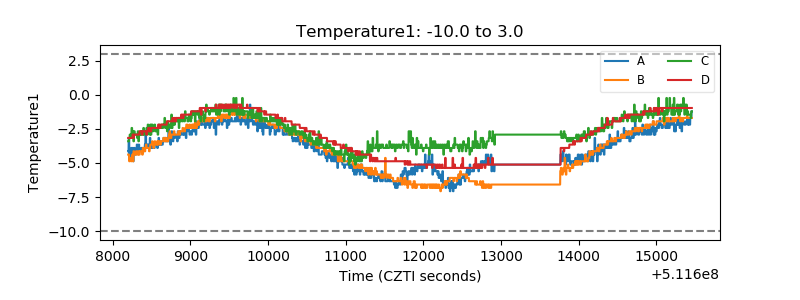 |
| Veto HV Monitor | 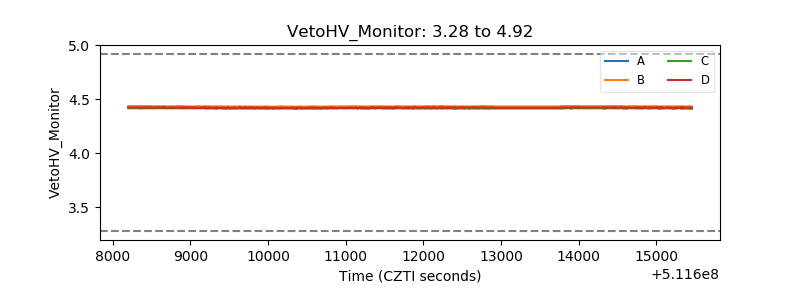 |
| Veto LLD | 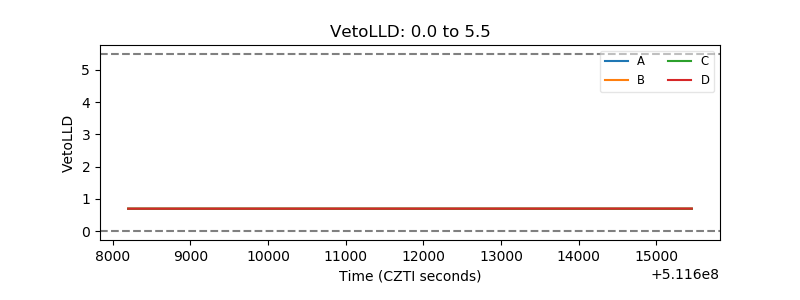 |
| Alpha Counter | 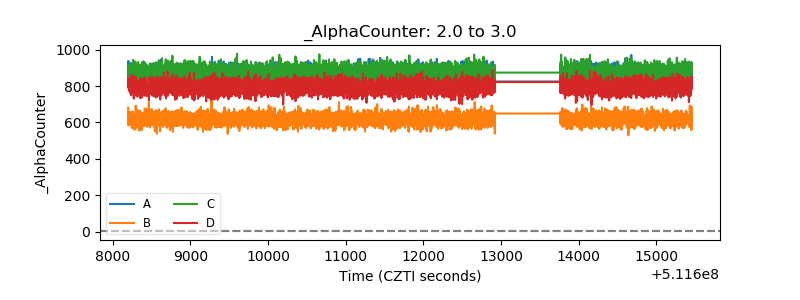 |
| _CPM_Rate | 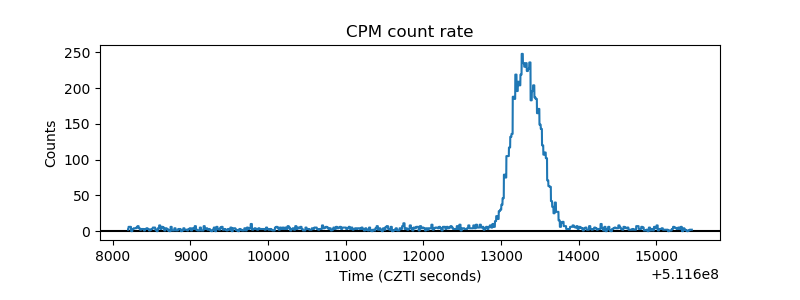 |
| CZT Counter | 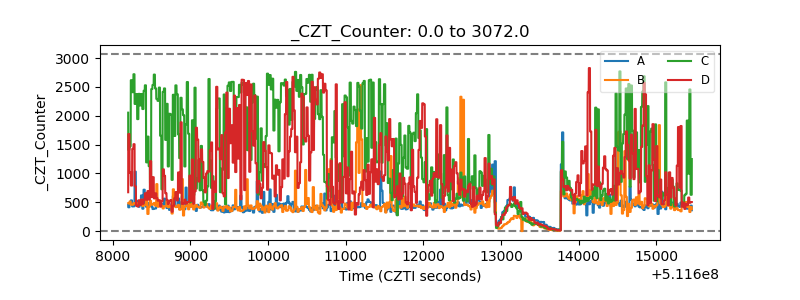 |
| +2.5 Volts monitor |  |
| +5 Volts monitor |  |
| _ROLL_ROT | 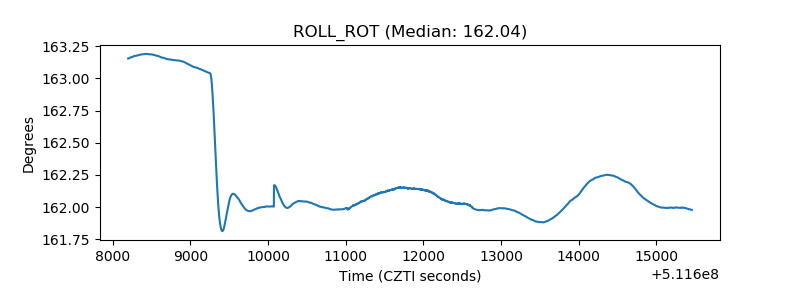 |
| _Roll_DEC | 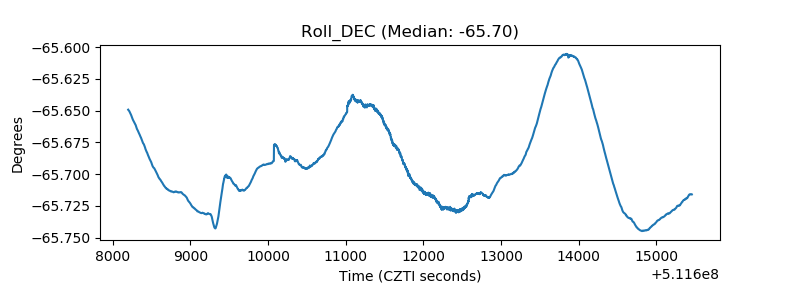 |
| _Roll_RA | 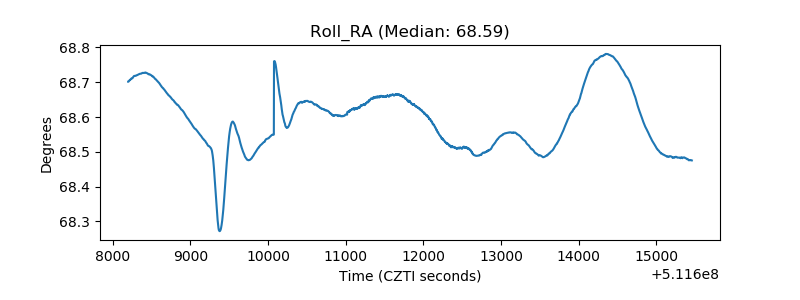 |
| Veto Counter | 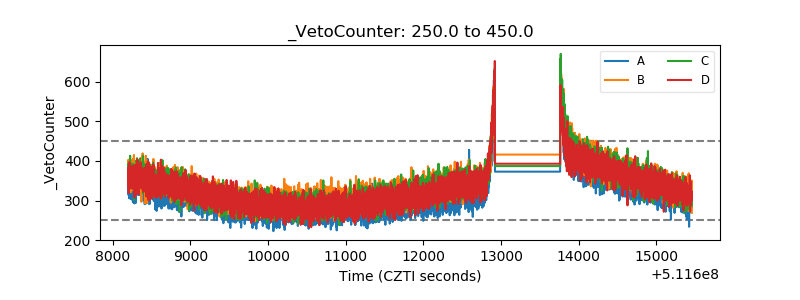 |