| Param | Original file | Final file |
|---|---|---|
| Filename | modeM0/AS1A14_083T06_9000006558_56664cztM0_level2.fits | modeM0/AS1A14_083T06_9000006558_56664cztM0_level2_quad_clean.evt |
| Size (bytes) | 471,588,480 | 84,087,360 |
| Size | 449.7 MB | 80.2 MB |
| Events in quadrant A | 2,721,761 | 562,911 |
| Events in quadrant B | 2,682,361 | 607,994 |
| Events in quadrant C | 4,317,723 | 526,006 |
| Events in quadrant D | 7,274,954 | 435,424 |
| Mode SS | |||
|---|---|---|---|
| Quadrant | BADHDUFLAG | Total packets | Discarded packets |
| A | 0 | 120 | 0 |
| B | 0 | 120 | 0 |
| C | 0 | 120 | 0 |
| D | 0 | 120 | 0 |
| Mode M9 | |||
|---|---|---|---|
| Quadrant | BADHDUFLAG | Total packets | Discarded packets |
| A | 0 | 10 | 0 |
| B | 0 | 10 | 0 |
| C | 0 | 10 | 0 |
| D | 0 | 10 | 0 |
| Mode M0 | |||
|---|---|---|---|
| Quadrant | BADHDUFLAG | Total packets | Discarded packets |
| A | 0 | 12413 | 1 |
| B | 0 | 12329 | 1 |
| C | 0 | 16998 | 1 |
| D | 0 | 25754 | 1 |
| Quadrant | Total seconds | Saturated seconds | Saturation percentage |
|---|---|---|---|
| A | 5919 | 51 | 0.861632% |
| B | 5920 | 35 | 0.591216% |
| C | 5920 | 190 | 3.209459% |
| D | 5920 | 1055 | 17.820946% |
Noise dominated data is calculated using 1-second bins in cleaned event files. If a bin has >2000 counts, and if more than 50% of those come from <1% of pixels, then it is considered to be noise-dominated and hence unusable.
| Quadrant | # 1 sec bins | Bins with >0 counts | Bins with >2000 counts | High rate bins dominated by noise | Noise dominated (total time) | Noise dominated (detector-on time) | Marked lightcurve |
|---|---|---|---|---|---|---|---|
| A | 6939 | 5919 | 14 | 14 | 0.20% | 0.24% | 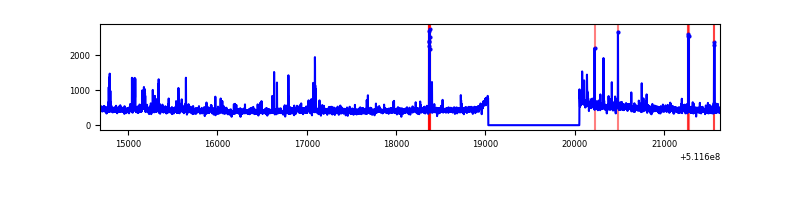 |
| B | 6940 | 5920 | 4 | 4 | 0.06% | 0.07% | 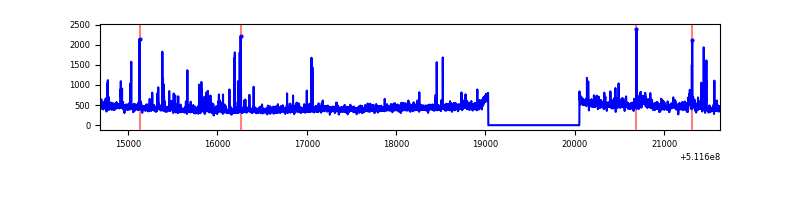 |
| C | 6940 | 5921 | 186 | 186 | 2.68% | 3.14% | 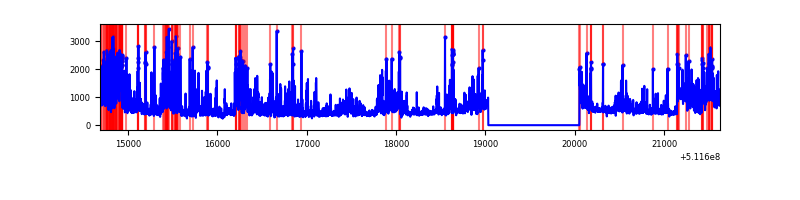 |
| D | 6939 | 5919 | 1204 | 1204 | 17.35% | 20.34% | 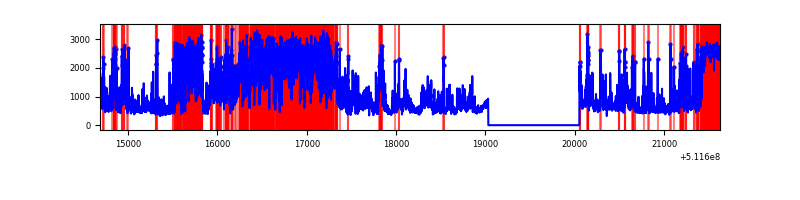 |
Top three noisy pixels from each quadrant. If the there are fewer than three noisy pixels in the level2.evt file, extra rows are filled as -1
| Pixel properties | Quadrant properties | ||||||
|---|---|---|---|---|---|---|---|
| Quadrant | DetID | PixID | Counts | Sigma | Mean | Median | Sigma |
| A | 4 | 249 | 101917 | 649.81 | 632 | 616 | 155.9 |
| A | 0 | 12 | 40931 | 258.61 | 632 | 616 | 155.9 |
| A | 7 | 14 | 29466 | 185.06 | 632 | 616 | 155.9 |
| B | 0 | 245 | 58750 | 434.14 | 623 | 598 | 133.9 |
| B | 0 | 213 | 26336 | 192.15 | 623 | 598 | 133.9 |
| B | 5 | 185 | 22134 | 160.78 | 623 | 598 | 133.9 |
| C | 13 | 3 | 691309 | 4182.47 | 598 | 593 | 165.1 |
| C | 15 | 205 | 427033 | 2582.21 | 598 | 593 | 165.1 |
| C | 9 | 38 | 301098 | 1819.64 | 598 | 593 | 165.1 |
| D | 10 | 199 | 2590416 | 15881.5 | 574 | 548 | 163.1 |
| D | 2 | 249 | 1573701 | 9646.84 | 574 | 548 | 163.1 |
| D | 12 | 2 | 255999 | 1566.47 | 574 | 548 | 163.1 |
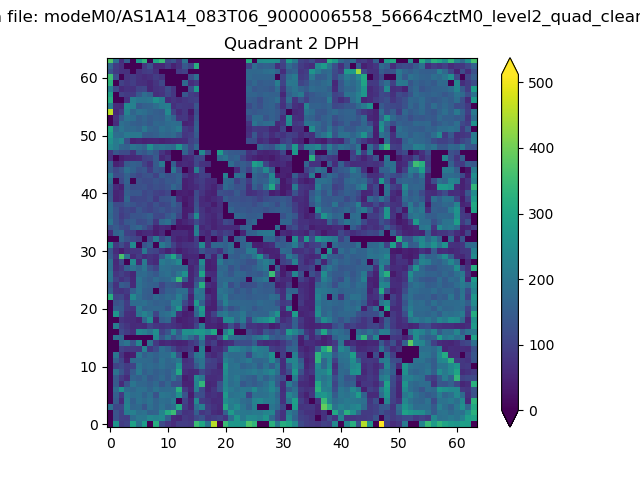
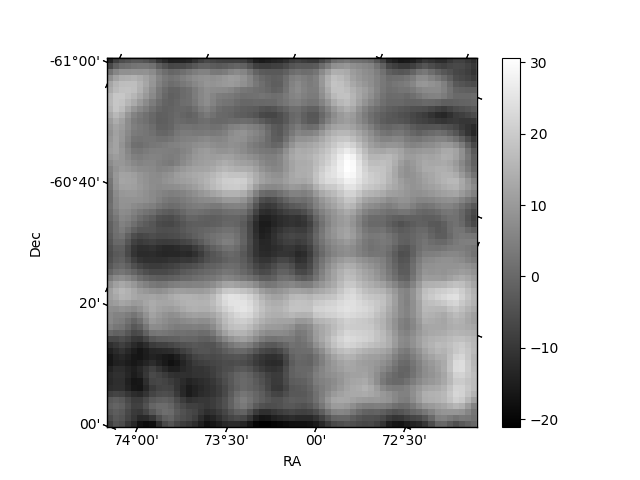
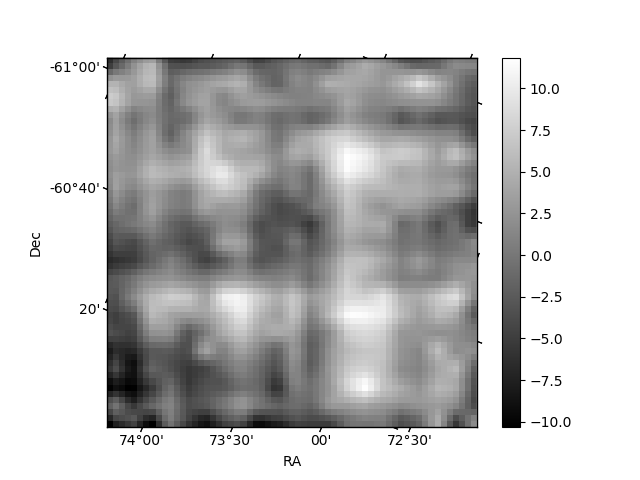
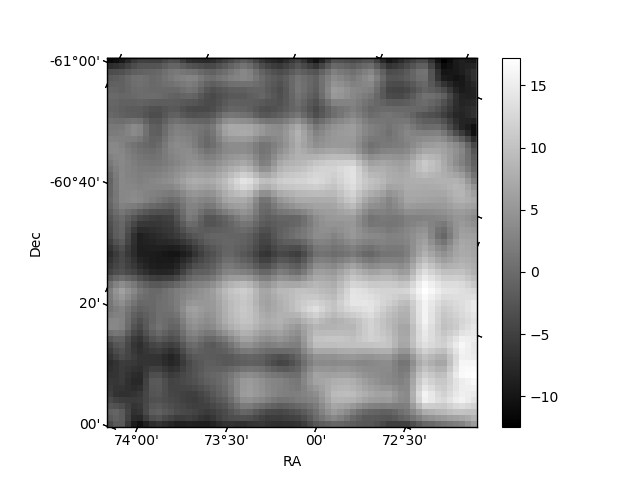
Histogram calculated using DETX and DETY for each event in the final _common_clean file
| Quadrant A | 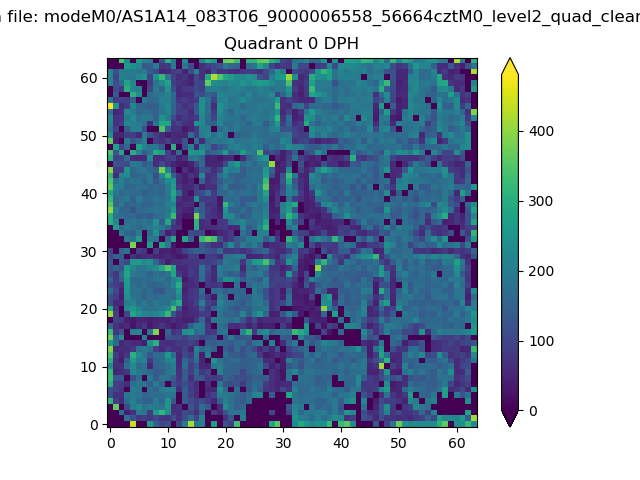 |
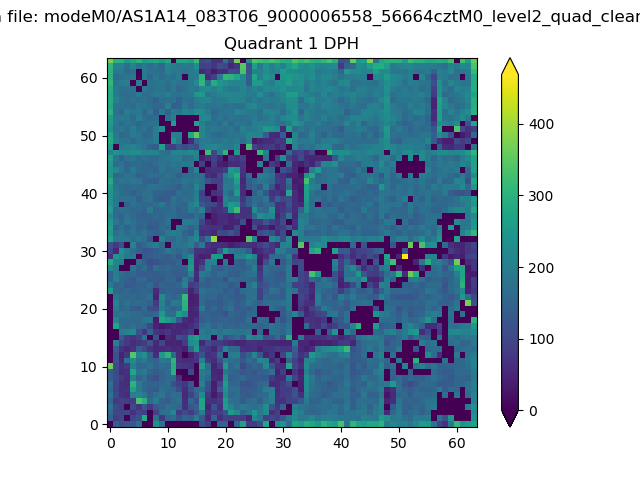 |
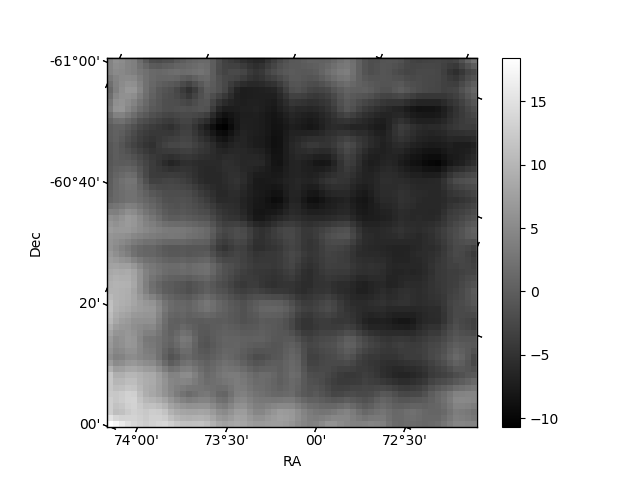
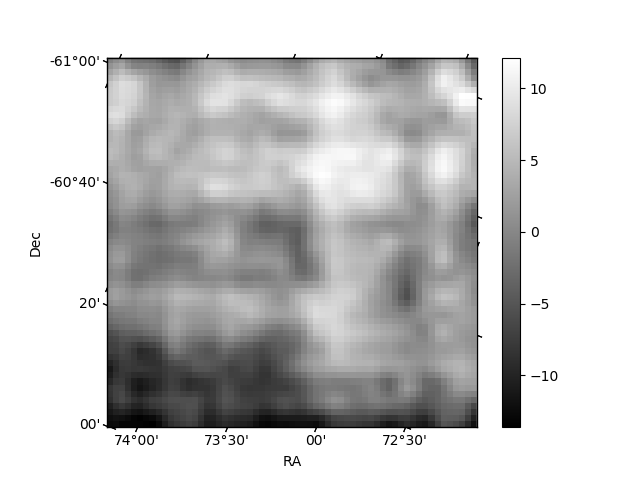
Quadrant B |
|---|---|---|---|
| Quadrant D | 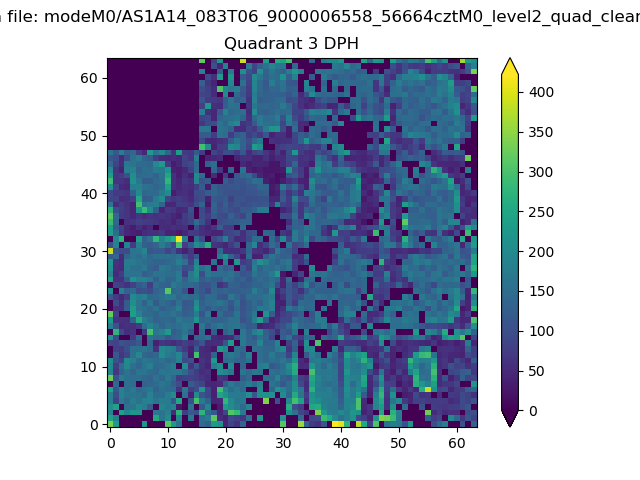 |
 |
Quadrant C |
| Plot type | Count rate plots | Images |
|---|---|---|
| Comparison with Poisson distribution Blue bars denote a histogram of data divided into 1 sec bins. Red curve is a Poisson curve with rate = median count rate of data. |
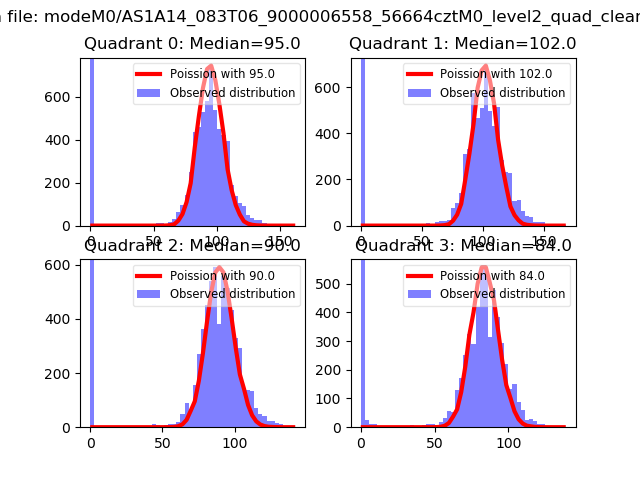 |
 |
| Quadrant-wise count rates Data is divided into 100 sec bins |
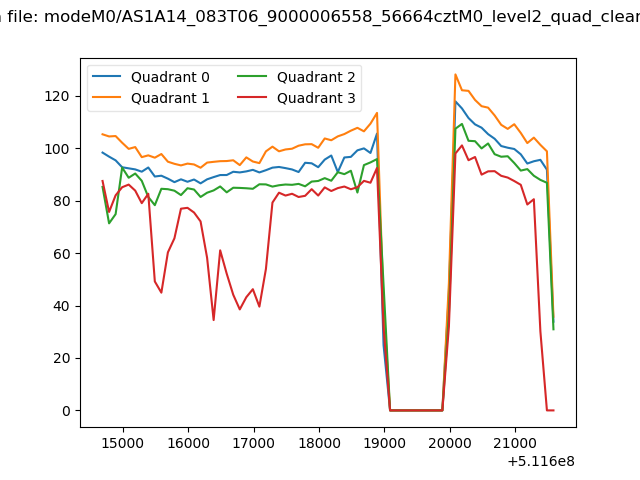 |
|
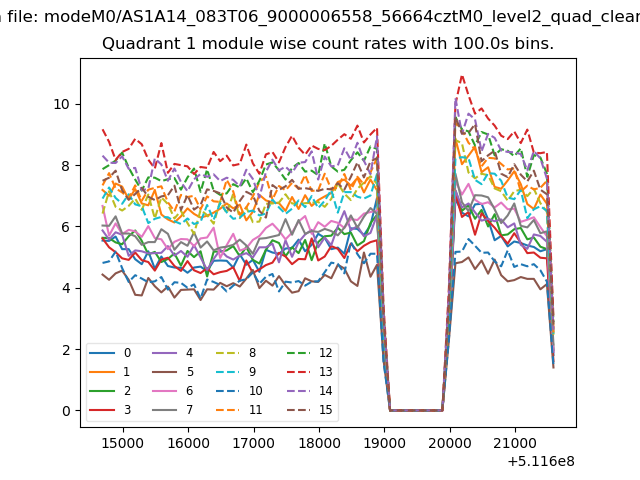
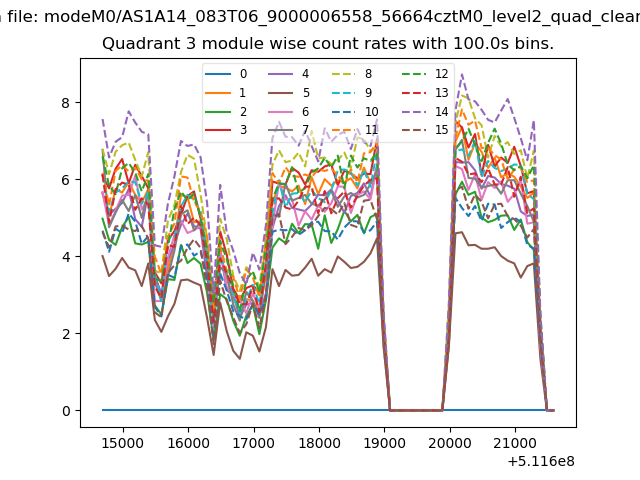
| Module-wise count rates for Quadrant A Data is divided into 100 sec bins |
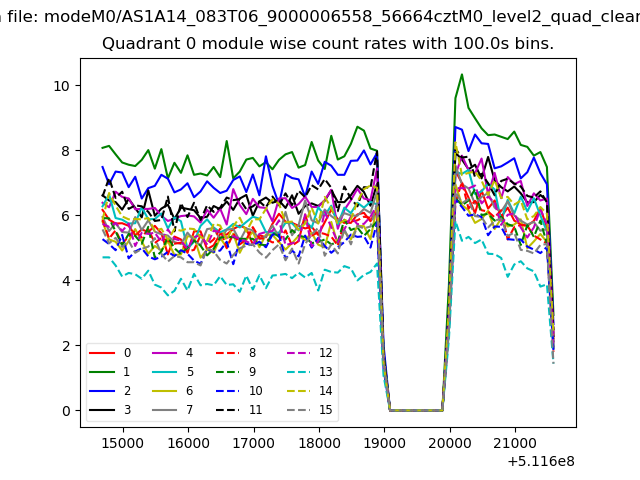 |
 |
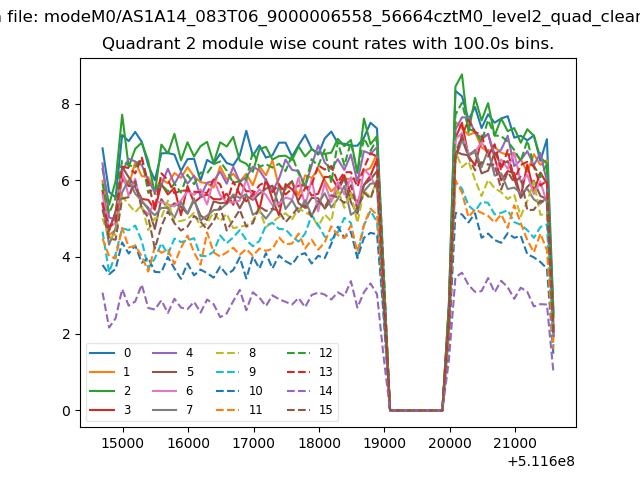
| Module-wise count rates for Quadrant B Data is divided into 100 sec bins |
 |
 |
| Module-wise count rates for Quadrant C Data is divided into 100 sec bins |
 |
 |
| Module-wise count rates for Quadrant D Data is divided into 100 sec bins |
 |
 |
| Parameter | Plot |
|---|---|
| CZT HV Monitor | 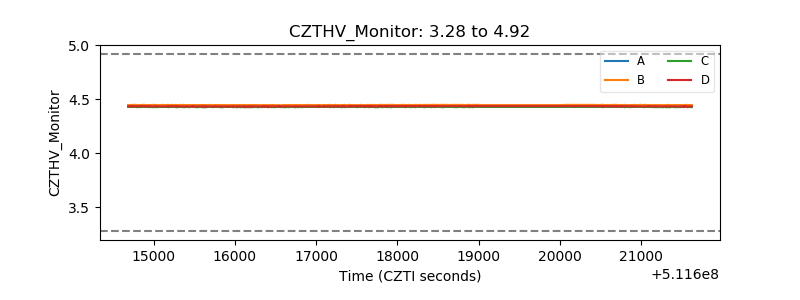 |
| D_VDD | 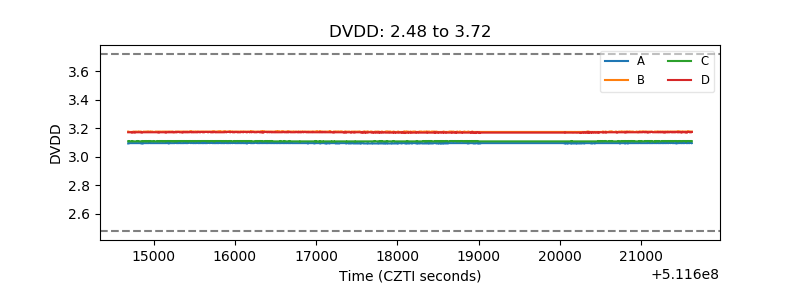 |
| Temperature 1 | 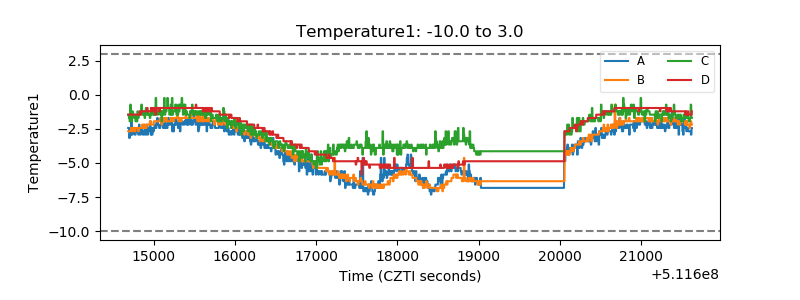 |
| Veto HV Monitor | 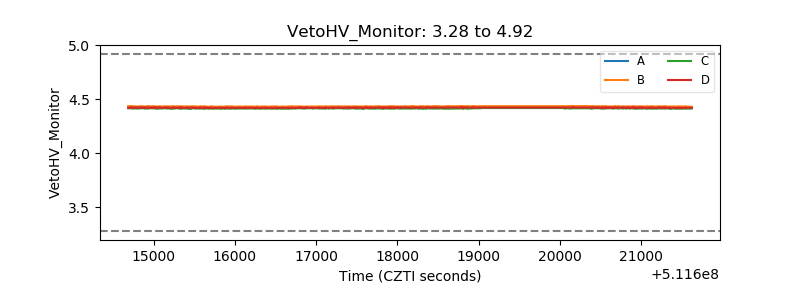 |
| Veto LLD | 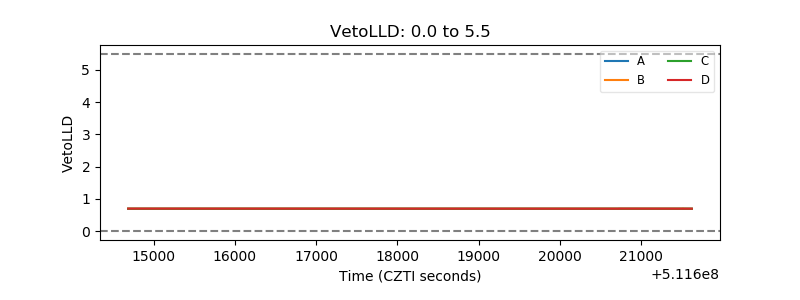 |
| Alpha Counter | 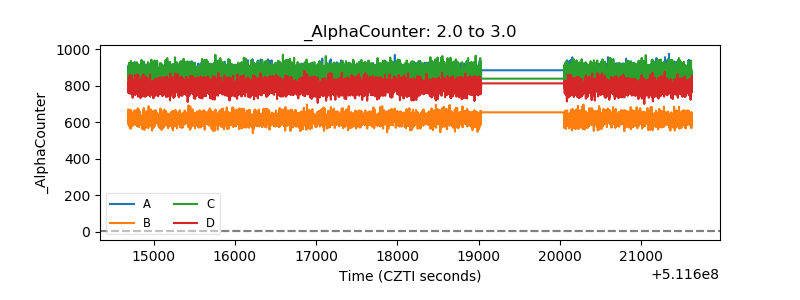 |
| _CPM_Rate | 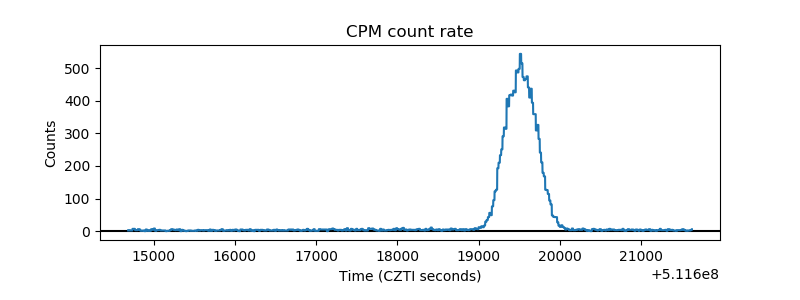 |
| CZT Counter | 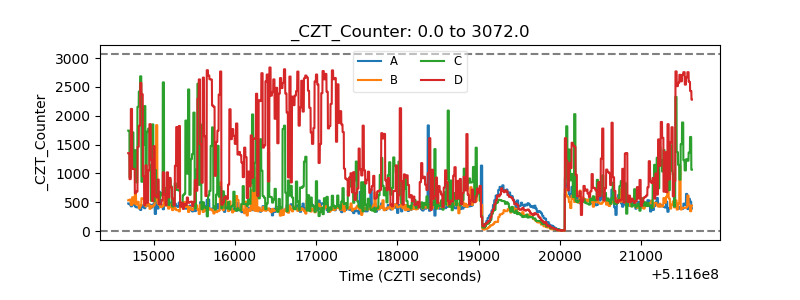 |
| +2.5 Volts monitor |  |
| +5 Volts monitor |  |
| _ROLL_ROT | 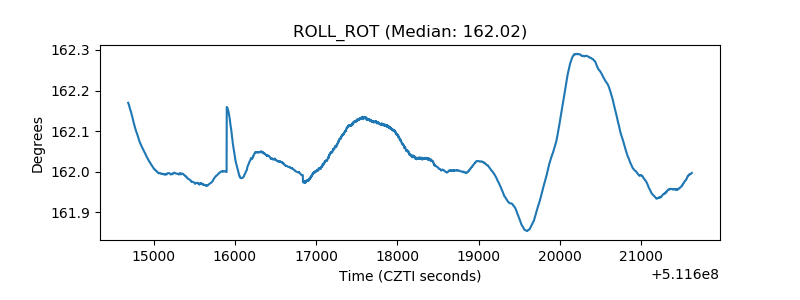 |
| _Roll_DEC | 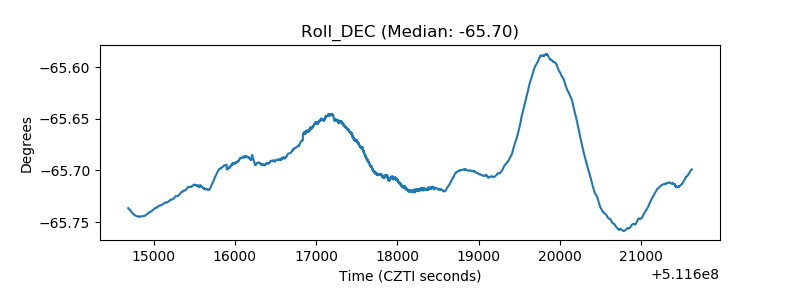 |
| _Roll_RA | 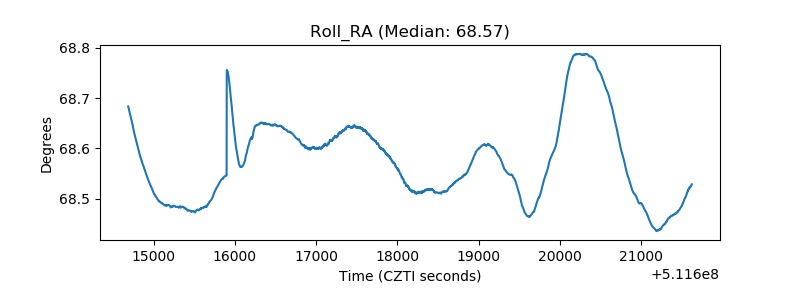 |
| Veto Counter | 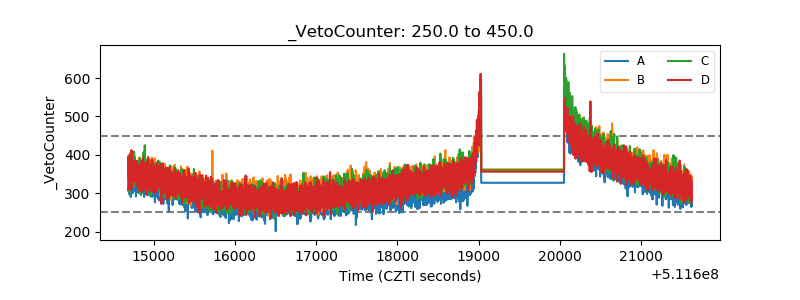 |