| Param | Original file | Final file |
|---|---|---|
| Filename | modeM0/AS1A14_083T06_9000006558_56665cztM0_level2.fits | modeM0/AS1A14_083T06_9000006558_56665cztM0_level2_quad_clean.evt |
| Size (bytes) | 458,974,080 | 85,152,960 |
| Size | 437.7 MB | 81.2 MB |
| Events in quadrant A | 2,729,272 | 581,505 |
| Events in quadrant B | 2,783,201 | 623,540 |
| Events in quadrant C | 4,827,820 | 534,262 |
| Events in quadrant D | 6,186,675 | 423,412 |
| Mode SS | |||
|---|---|---|---|
| Quadrant | BADHDUFLAG | Total packets | Discarded packets |
| A | 0 | 120 | 0 |
| B | 0 | 120 | 0 |
| C | 0 | 120 | 0 |
| D | 0 | 120 | 0 |
| Mode M9 | |||
|---|---|---|---|
| Quadrant | BADHDUFLAG | Total packets | Discarded packets |
| A | 0 | 11 | 0 |
| B | 0 | 11 | 0 |
| C | 0 | 11 | 0 |
| D | 0 | 11 | 0 |
| Mode M0 | |||
|---|---|---|---|
| Quadrant | BADHDUFLAG | Total packets | Discarded packets |
| A | 0 | 12543 | 1 |
| B | 0 | 12601 | 1 |
| C | 0 | 18419 | 1 |
| D | 0 | 22513 | 1 |
| Quadrant | Total seconds | Saturated seconds | Saturation percentage |
|---|---|---|---|
| A | 5953 | 52 | 0.873509% |
| B | 5953 | 60 | 1.007895% |
| C | 5953 | 233 | 3.913993% |
| D | 5953 | 1211 | 20.342684% |
Noise dominated data is calculated using 1-second bins in cleaned event files. If a bin has >2000 counts, and if more than 50% of those come from <1% of pixels, then it is considered to be noise-dominated and hence unusable.
| Quadrant | # 1 sec bins | Bins with >0 counts | Bins with >2000 counts | High rate bins dominated by noise | Noise dominated (total time) | Noise dominated (detector-on time) | Marked lightcurve |
|---|---|---|---|---|---|---|---|
| A | 7043 | 5953 | 11 | 11 | 0.16% | 0.18% | 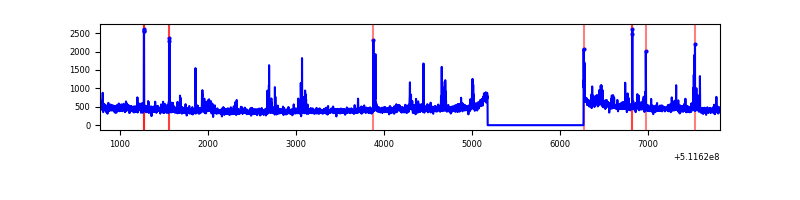 |
| B | 7043 | 5953 | 15 | 15 | 0.21% | 0.25% | 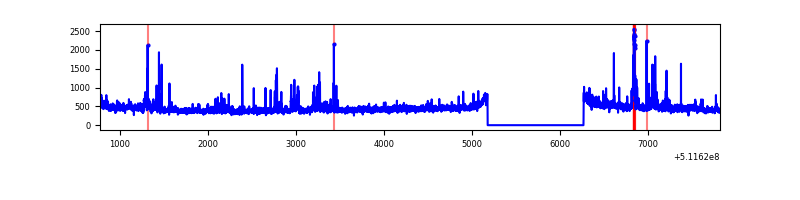 |
| C | 7043 | 5953 | 235 | 235 | 3.34% | 3.95% | 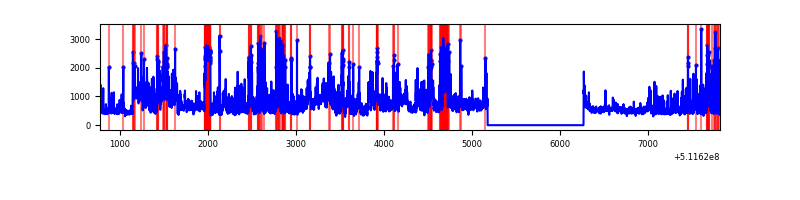 |
| D | 7043 | 5953 | 1230 | 1230 | 17.46% | 20.66% | 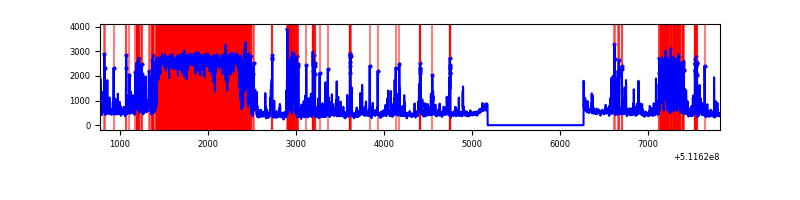 |
Top three noisy pixels from each quadrant. If the there are fewer than three noisy pixels in the level2.evt file, extra rows are filled as -1
| Pixel properties | Quadrant properties | ||||||
|---|---|---|---|---|---|---|---|
| Quadrant | DetID | PixID | Counts | Sigma | Mean | Median | Sigma |
| A | 3 | 62 | 55221 | 342.84 | 642 | 628 | 159.2 |
| A | 8 | 249 | 43371 | 268.42 | 642 | 628 | 159.2 |
| A | 3 | 14 | 30297 | 186.32 | 642 | 628 | 159.2 |
| B | 0 | 213 | 138209 | 1013.34 | 632 | 608 | 135.8 |
| B | 0 | 245 | 39757 | 288.31 | 632 | 608 | 135.8 |
| B | 5 | 185 | 29262 | 211.02 | 632 | 608 | 135.8 |
| C | 9 | 38 | 1637463 | 9794.63 | 605 | 597 | 167.1 |
| C | 12 | 252 | 204584 | 1220.61 | 605 | 597 | 167.1 |
| C | 1 | 16 | 153531 | 915.12 | 605 | 597 | 167.1 |
| D | 2 | 249 | 2958747 | 18849.07 | 556 | 532 | 156.9 |
| D | 10 | 199 | 488217 | 3107.42 | 556 | 532 | 156.9 |
| D | 2 | 31 | 168271 | 1068.79 | 556 | 532 | 156.9 |
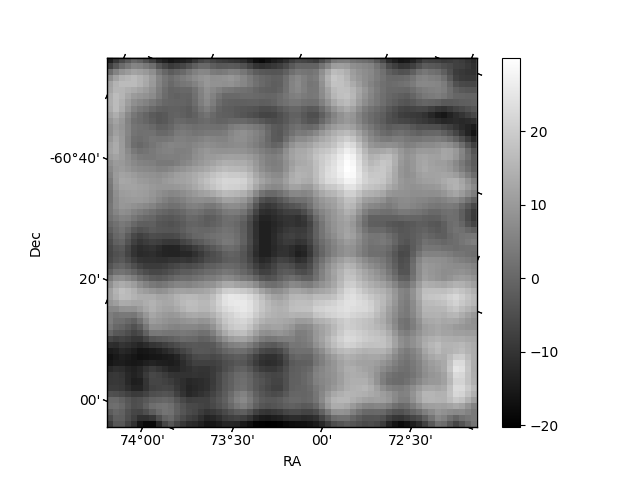
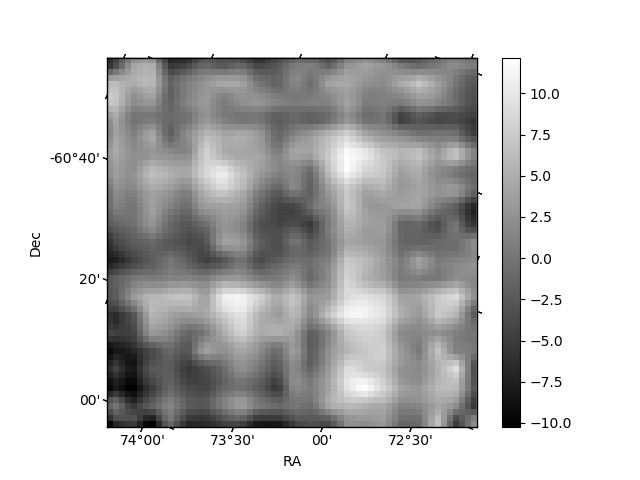
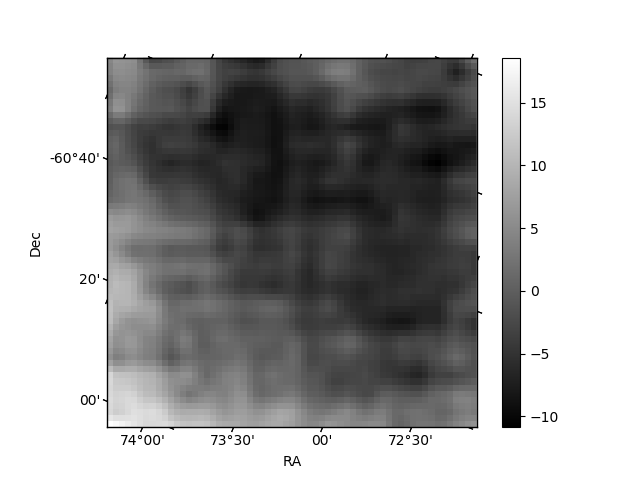
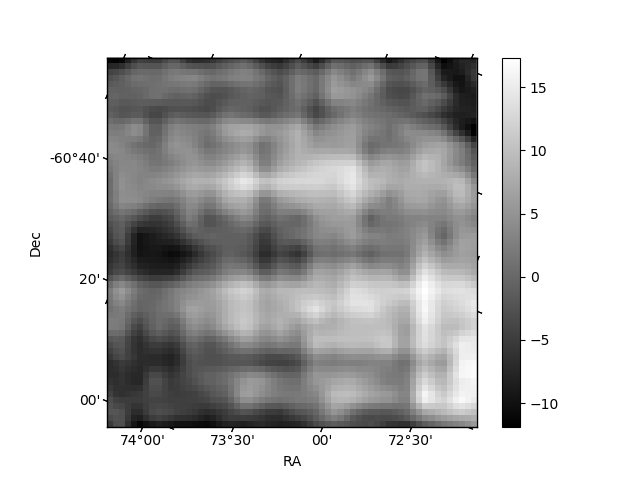
Histogram calculated using DETX and DETY for each event in the final _common_clean file
| Quadrant A | 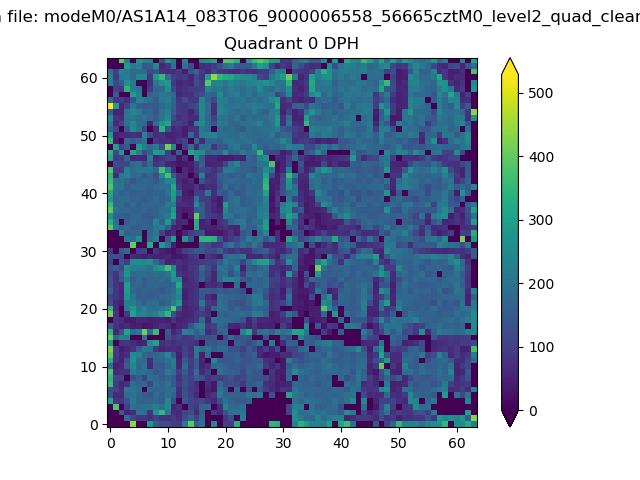 |
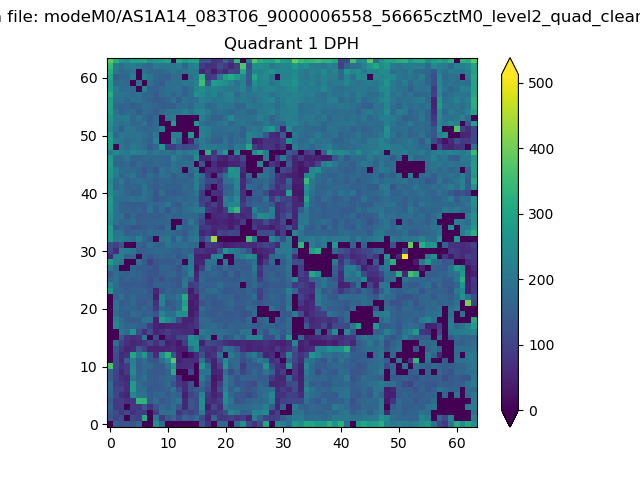 |
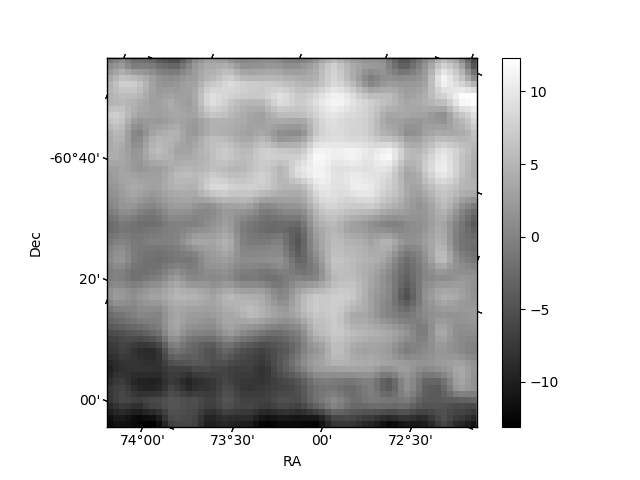
Quadrant B |
|---|---|---|---|
| Quadrant D | 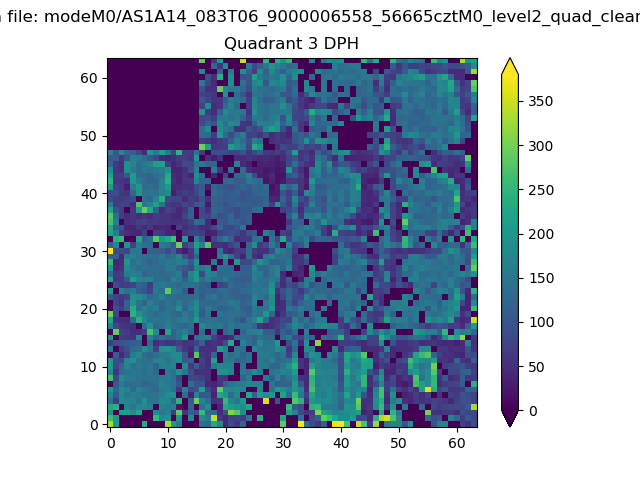 |
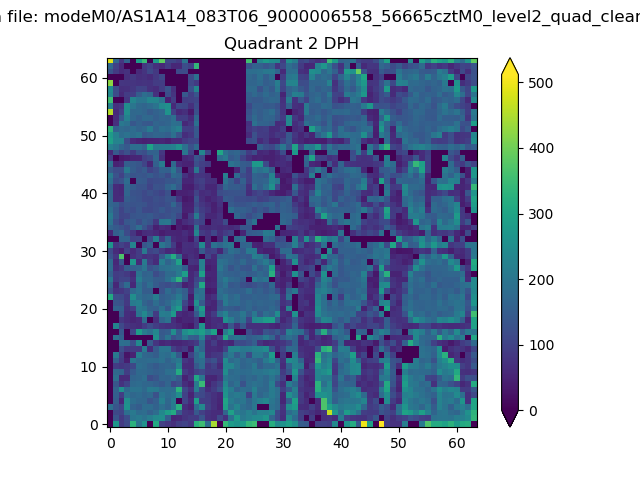 |
Quadrant C |
| Plot type | Count rate plots | Images |
|---|---|---|
| Comparison with Poisson distribution Blue bars denote a histogram of data divided into 1 sec bins. Red curve is a Poisson curve with rate = median count rate of data. |
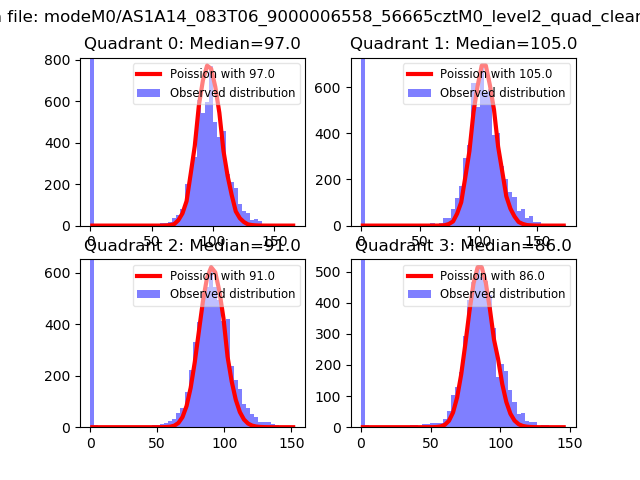 |
 |
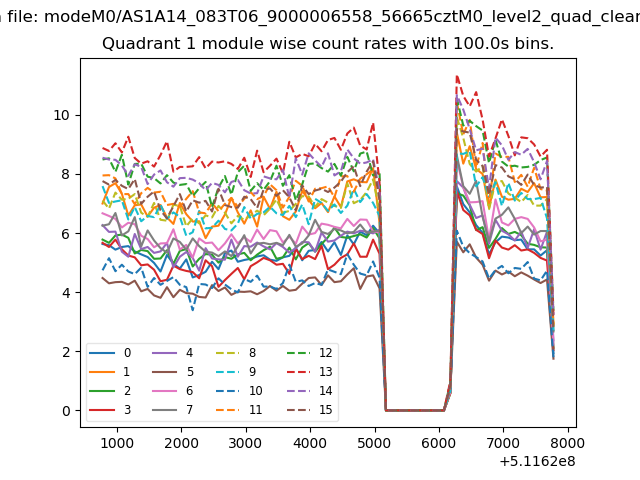
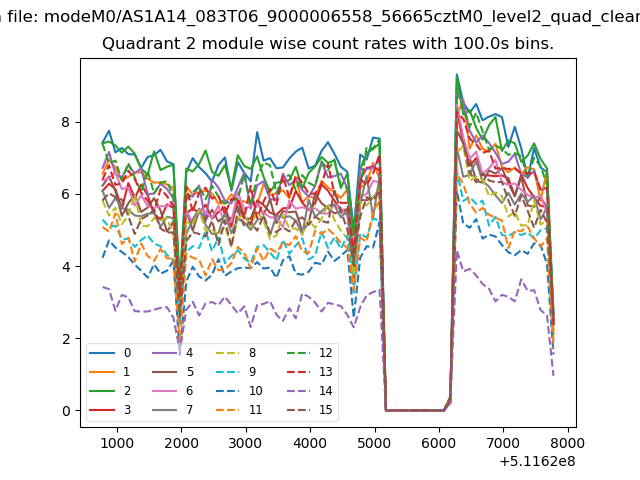
| Quadrant-wise count rates Data is divided into 100 sec bins |
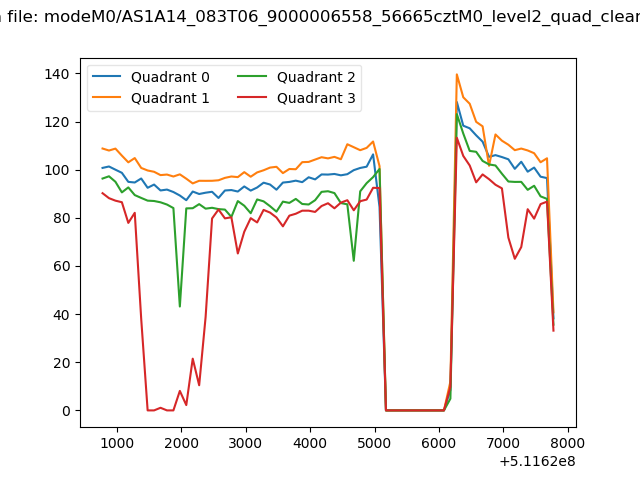 |
|
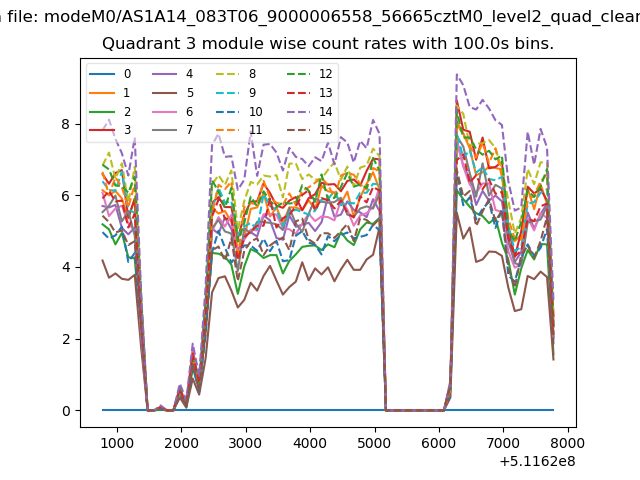
| Module-wise count rates for Quadrant A Data is divided into 100 sec bins |
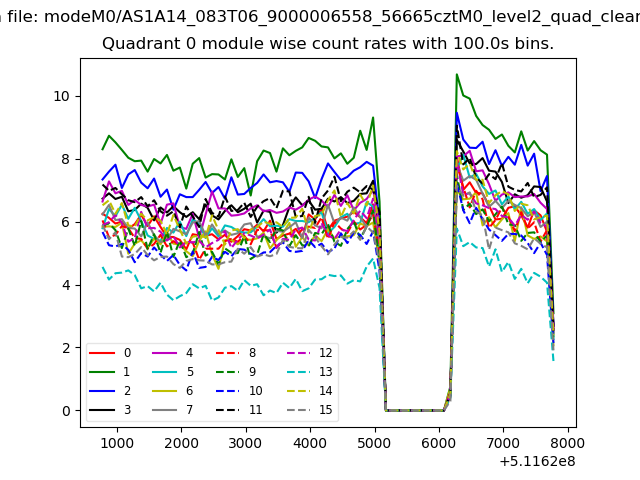 |
 |
| Module-wise count rates for Quadrant B Data is divided into 100 sec bins |
 |
 |
| Module-wise count rates for Quadrant C Data is divided into 100 sec bins |
 |
 |
| Module-wise count rates for Quadrant D Data is divided into 100 sec bins |
 |
 |
| Parameter | Plot |
|---|---|
| CZT HV Monitor | 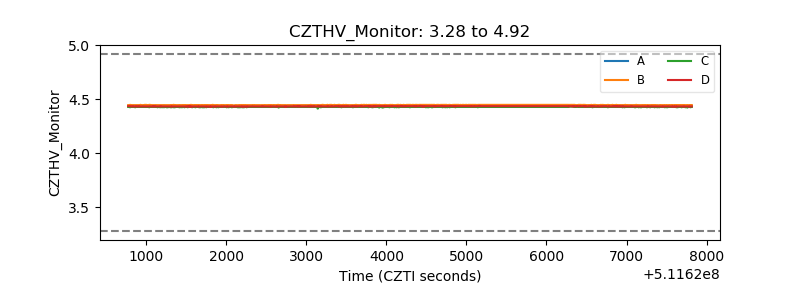 |
| D_VDD | 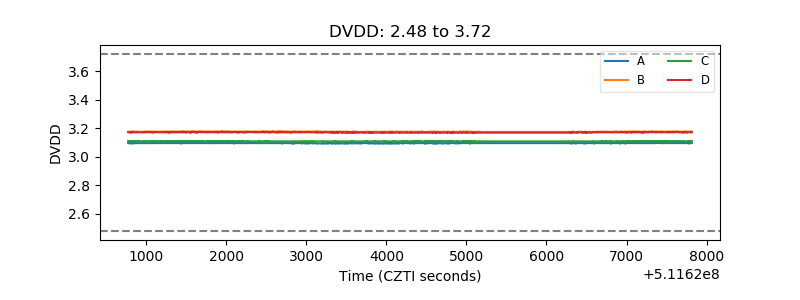 |
| Temperature 1 | 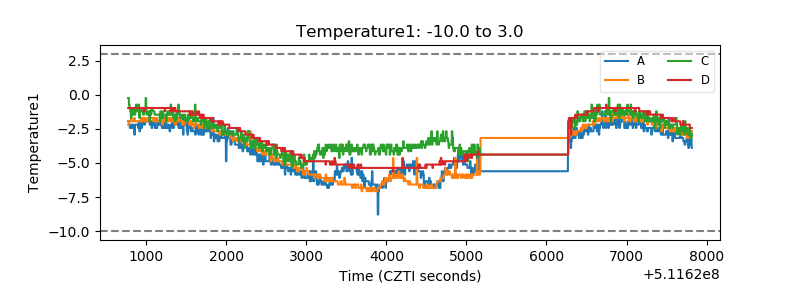 |
| Veto HV Monitor |  |
| Veto LLD | 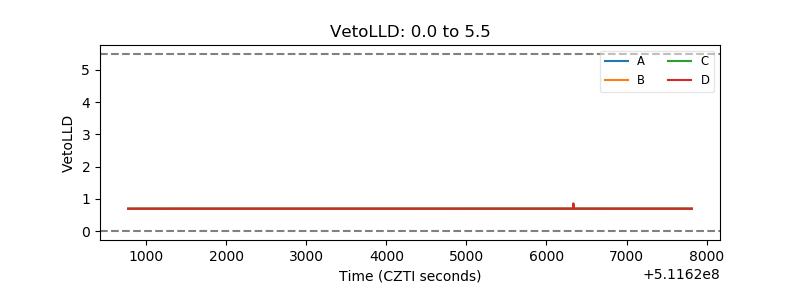 |
| Alpha Counter | 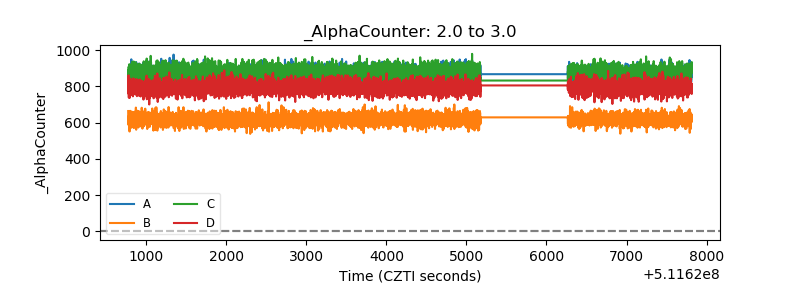 |
| _CPM_Rate | 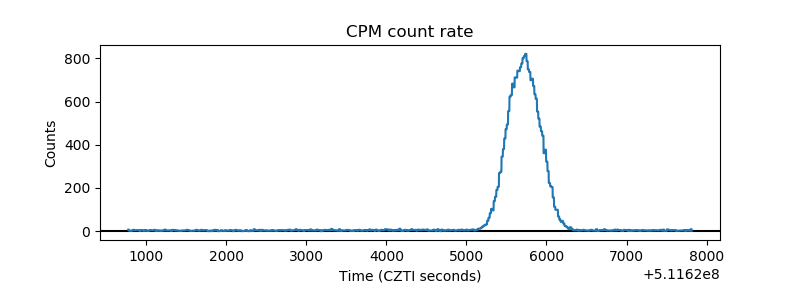 |
| CZT Counter | 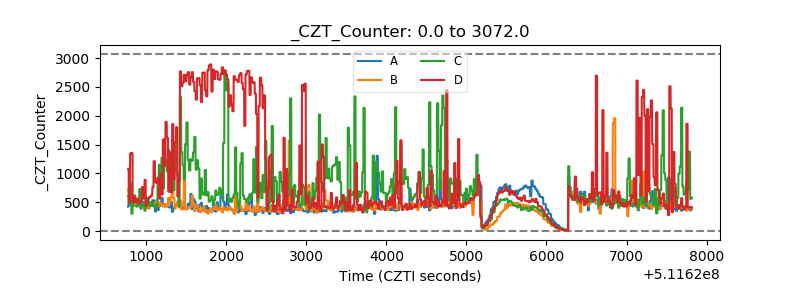 |
| +2.5 Volts monitor |  |
| +5 Volts monitor |  |
| _ROLL_ROT | 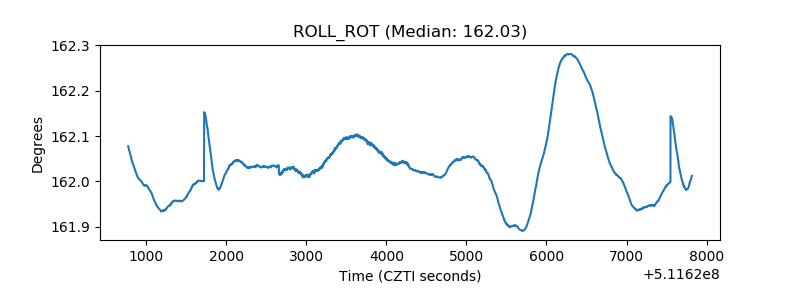 |
| _Roll_DEC | 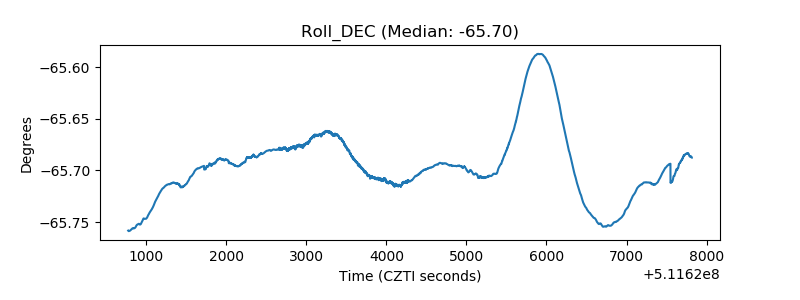 |
| _Roll_RA | 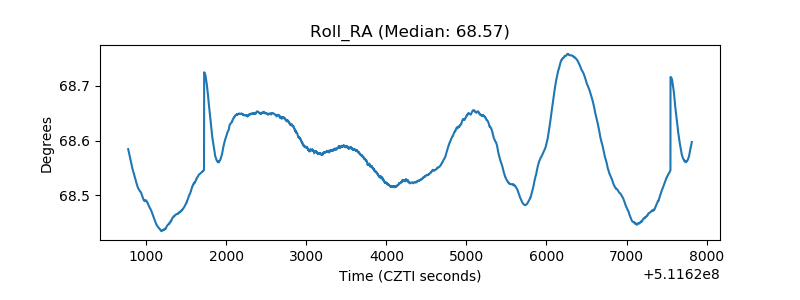 |
| Veto Counter | 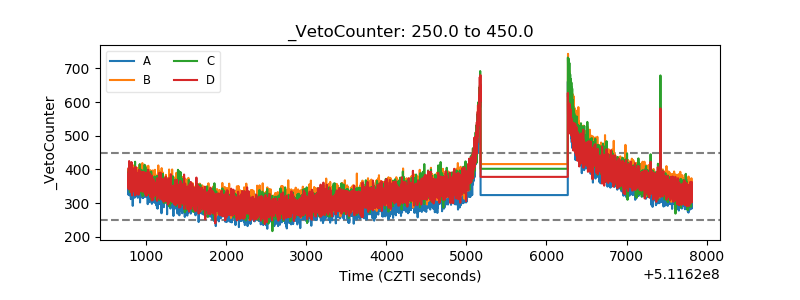 |