| Param | Original file | Final file |
|---|---|---|
| Filename | modeM0/AS1A14_083T06_9000006558_56666cztM0_level2.fits | modeM0/AS1A14_083T06_9000006558_56666cztM0_level2_quad_clean.evt |
| Size (bytes) | 355,190,400 | 85,135,680 |
| Size | 338.7 MB | 81.2 MB |
| Events in quadrant A | 2,795,865 | 568,167 |
| Events in quadrant B | 2,634,478 | 610,217 |
| Events in quadrant C | 3,247,091 | 532,257 |
| Events in quadrant D | 4,023,302 | 466,056 |
| Mode SS | |||
|---|---|---|---|
| Quadrant | BADHDUFLAG | Total packets | Discarded packets |
| A | 0 | 116 | 0 |
| B | 0 | 116 | 0 |
| C | 0 | 116 | 0 |
| D | 0 | 116 | 0 |
| Mode M9 | |||
|---|---|---|---|
| Quadrant | BADHDUFLAG | Total packets | Discarded packets |
| A | 0 | 12 | 0 |
| B | 0 | 12 | 0 |
| C | 0 | 12 | 0 |
| D | 0 | 12 | 0 |
| Mode M0 | |||
|---|---|---|---|
| Quadrant | BADHDUFLAG | Total packets | Discarded packets |
| A | 0 | 12578 | 1 |
| B | 0 | 12007 | 1 |
| C | 0 | 13786 | 1 |
| D | 0 | 16148 | 1 |
| Quadrant | Total seconds | Saturated seconds | Saturation percentage |
|---|---|---|---|
| A | 5740 | 80 | 1.393728% |
| B | 5740 | 61 | 1.062718% |
| C | 5741 | 82 | 1.428323% |
| D | 5741 | 461 | 8.029960% |
Noise dominated data is calculated using 1-second bins in cleaned event files. If a bin has >2000 counts, and if more than 50% of those come from <1% of pixels, then it is considered to be noise-dominated and hence unusable.
| Quadrant | # 1 sec bins | Bins with >0 counts | Bins with >2000 counts | High rate bins dominated by noise | Noise dominated (total time) | Noise dominated (detector-on time) | Marked lightcurve |
|---|---|---|---|---|---|---|---|
| A | 6910 | 5740 | 49 | 49 | 0.71% | 0.85% | 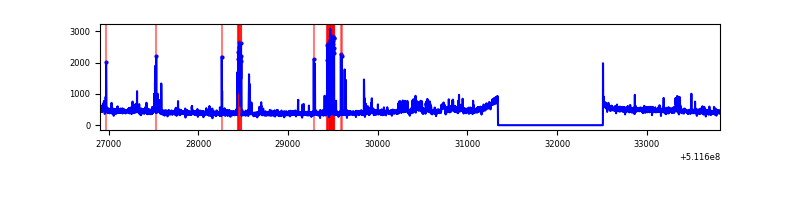 |
| B | 6910 | 5740 | 5 | 5 | 0.07% | 0.09% | 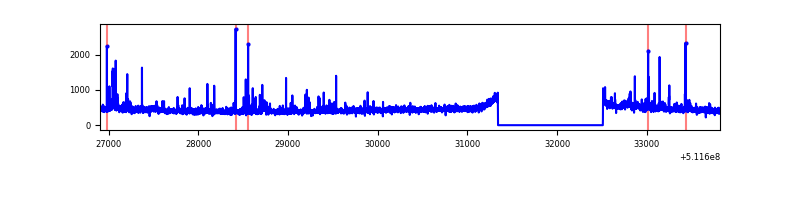 |
| C | 6911 | 5741 | 72 | 72 | 1.04% | 1.25% | 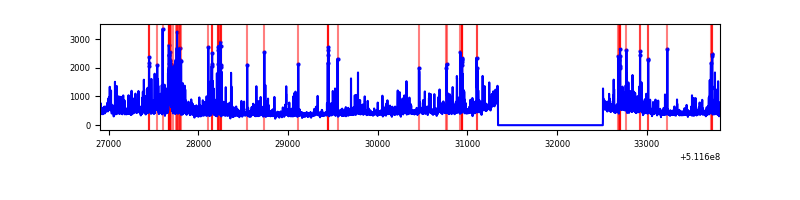 |
| D | 6911 | 5742 | 450 | 450 | 6.51% | 7.84% | 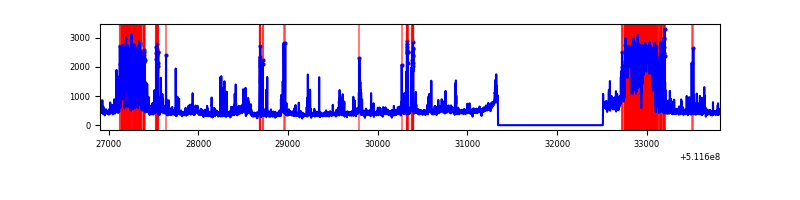 |
Top three noisy pixels from each quadrant. If the there are fewer than three noisy pixels in the level2.evt file, extra rows are filled as -1
| Pixel properties | Quadrant properties | ||||||
|---|---|---|---|---|---|---|---|
| Quadrant | DetID | PixID | Counts | Sigma | Mean | Median | Sigma |
| A | 4 | 249 | 120282 | 779.64 | 620 | 605 | 153.5 |
| A | 0 | 12 | 69413 | 448.25 | 620 | 605 | 153.5 |
| A | 7 | 64 | 59916 | 386.38 | 620 | 605 | 153.5 |
| B | 0 | 213 | 60737 | 455.19 | 616 | 594 | 132.1 |
| B | 0 | 245 | 41749 | 311.48 | 616 | 594 | 132.1 |
| B | 10 | 247 | 26483 | 195.94 | 616 | 594 | 132.1 |
| C | 9 | 38 | 228537 | 1408.77 | 590 | 584 | 161.8 |
| C | 12 | 252 | 202615 | 1248.57 | 590 | 584 | 161.8 |
| C | 1 | 16 | 163395 | 1006.19 | 590 | 584 | 161.8 |
| D | 2 | 249 | 1203514 | 7429.42 | 569 | 544 | 161.9 |
| D | 8 | 129 | 149409 | 919.37 | 569 | 544 | 161.9 |
| D | 2 | 31 | 131402 | 808.17 | 569 | 544 | 161.9 |
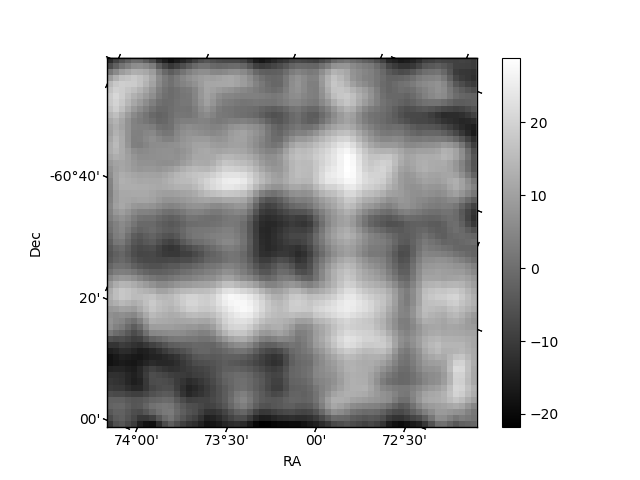
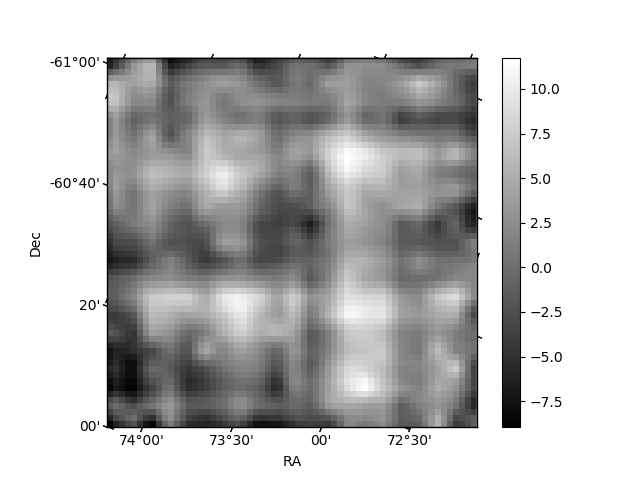
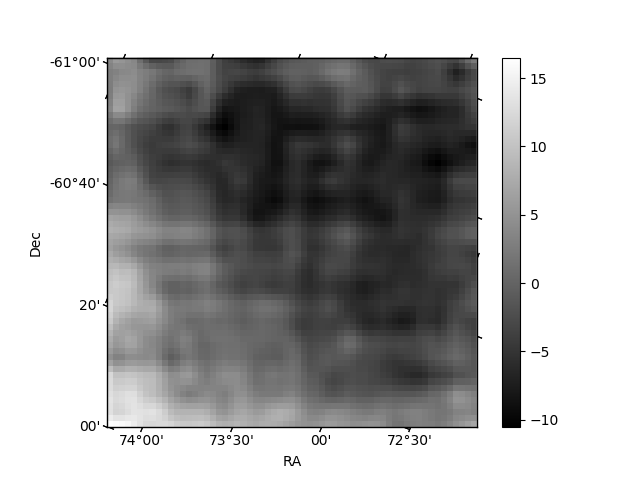
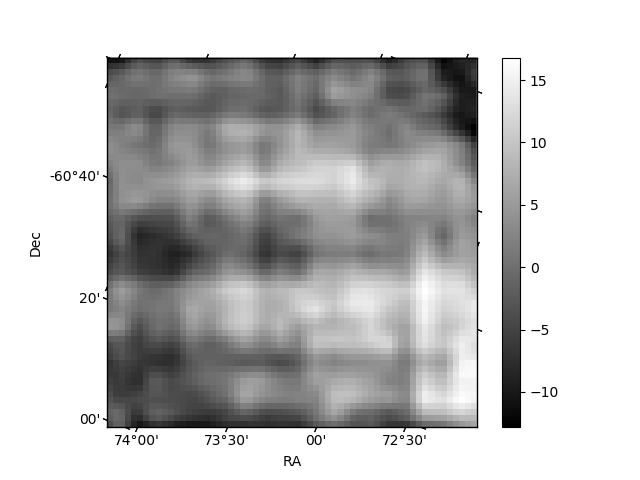
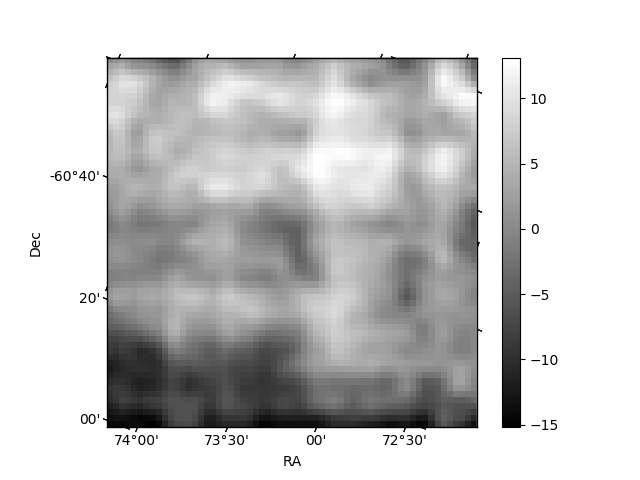
Histogram calculated using DETX and DETY for each event in the final _common_clean file
| Quadrant A | 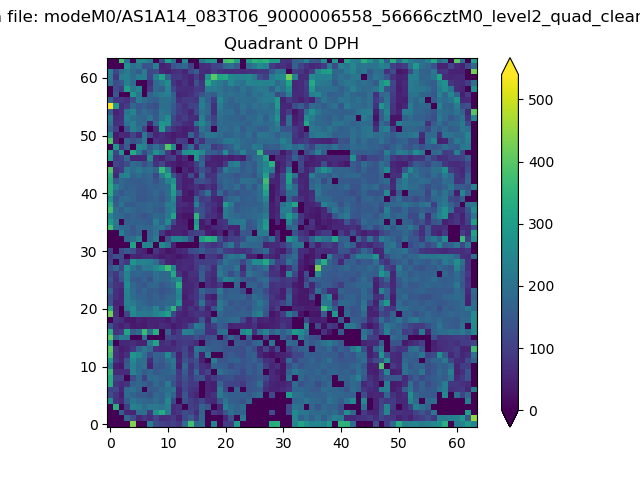 |
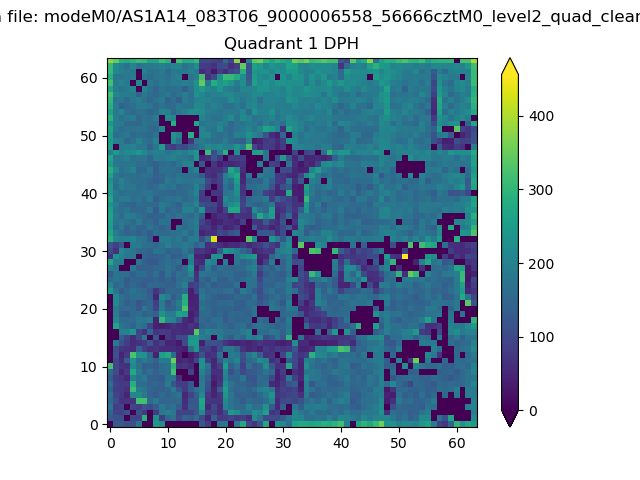 |
Quadrant B |
|---|---|---|---|
| Quadrant D | 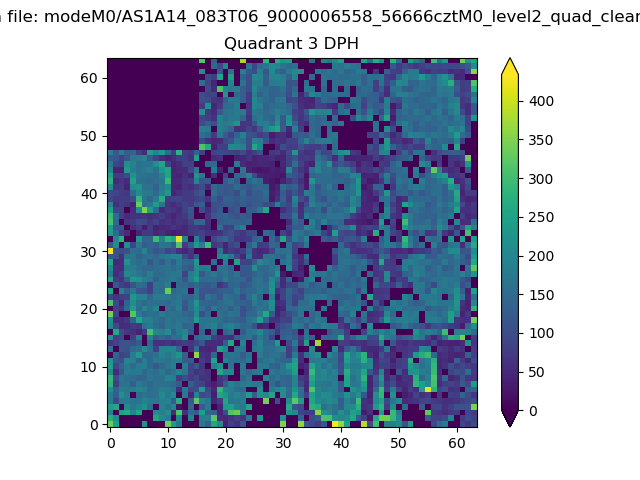 |
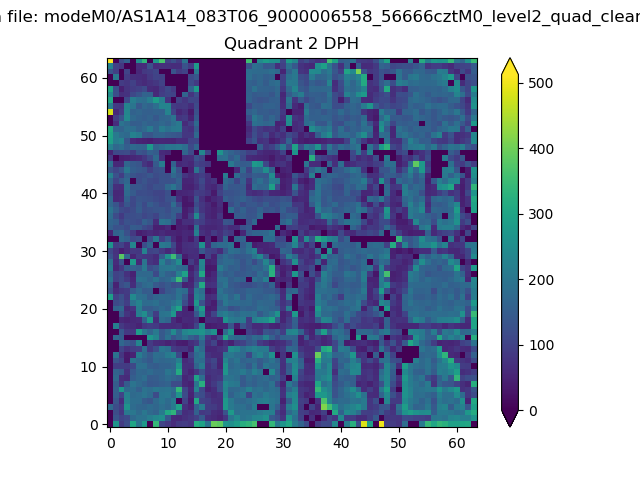 |
Quadrant C |
| Plot type | Count rate plots | Images |
|---|---|---|
| Comparison with Poisson distribution Blue bars denote a histogram of data divided into 1 sec bins. Red curve is a Poisson curve with rate = median count rate of data. |
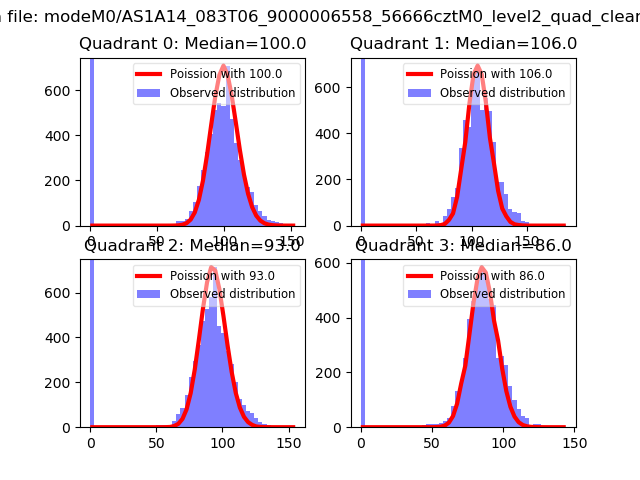 |
 |
| Quadrant-wise count rates Data is divided into 100 sec bins |
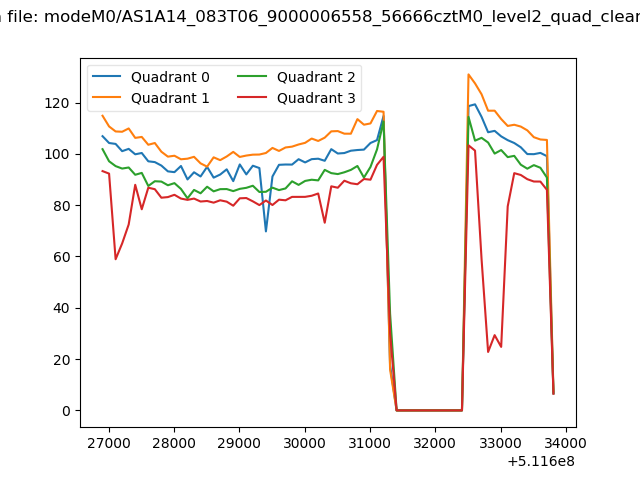 |
|
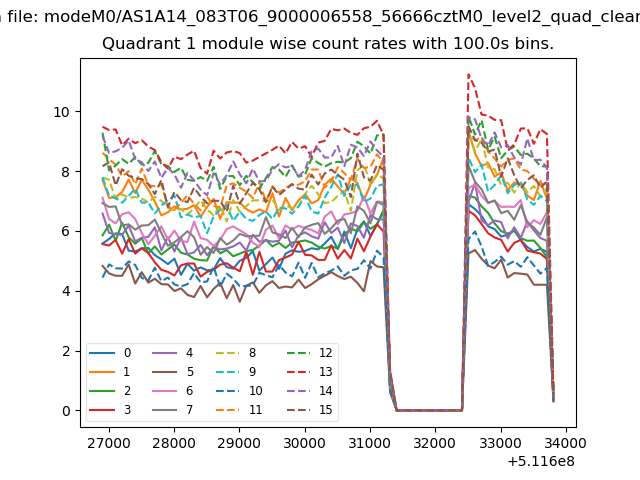
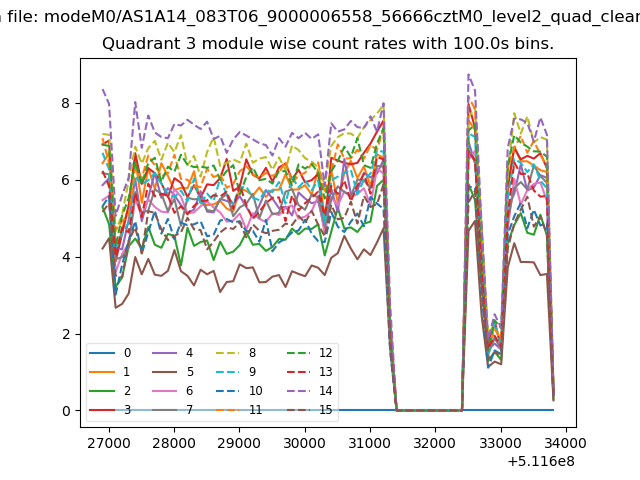
| Module-wise count rates for Quadrant A Data is divided into 100 sec bins |
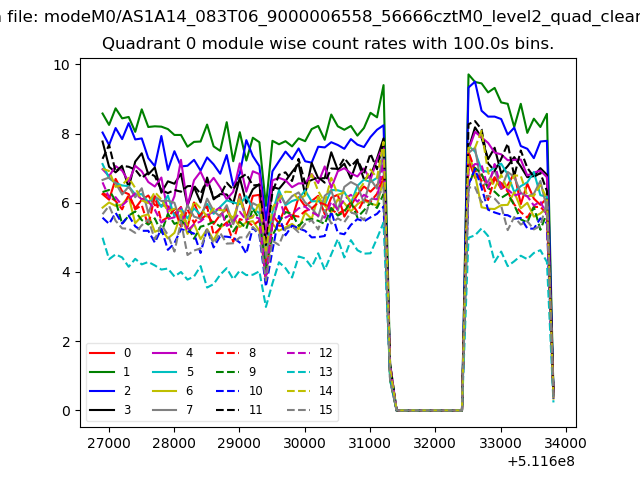 |
 |
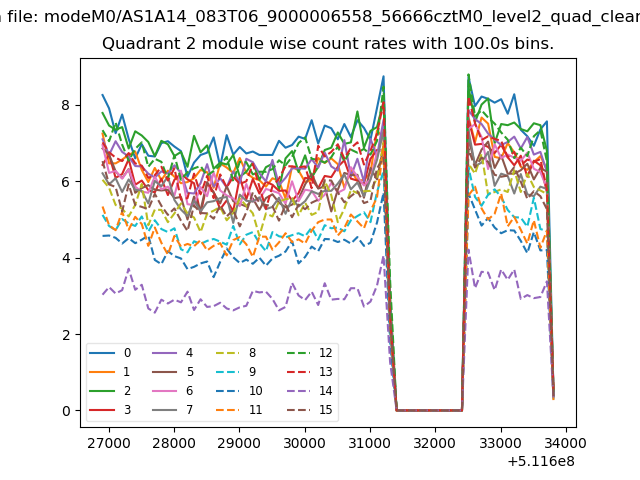
| Module-wise count rates for Quadrant B Data is divided into 100 sec bins |
 |
 |
| Module-wise count rates for Quadrant C Data is divided into 100 sec bins |
 |
 |
| Module-wise count rates for Quadrant D Data is divided into 100 sec bins |
 |
 |
| Parameter | Plot |
|---|---|
| CZT HV Monitor | 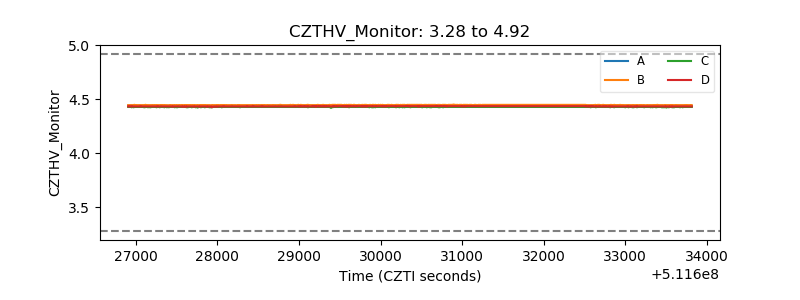 |
| D_VDD | 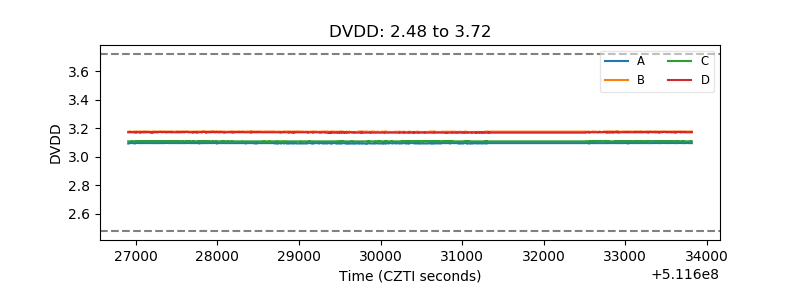 |
| Temperature 1 | 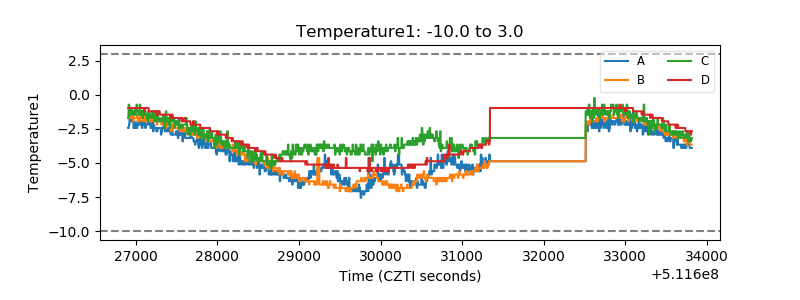 |
| Veto HV Monitor |  |
| Veto LLD | 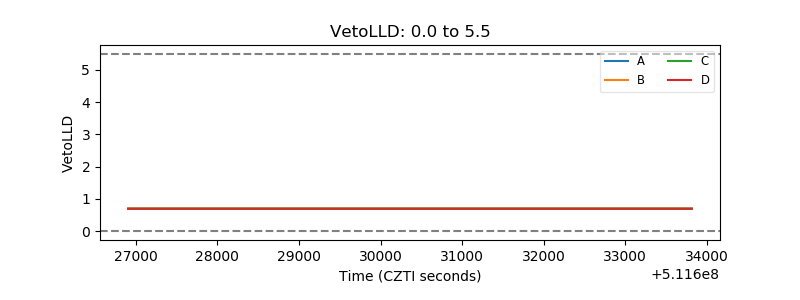 |
| Alpha Counter | 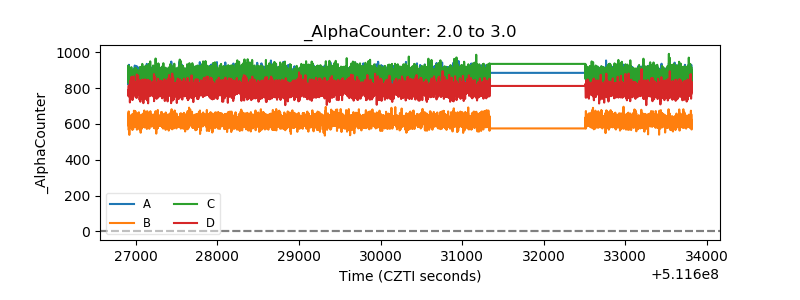 |
| _CPM_Rate |  |
| CZT Counter | 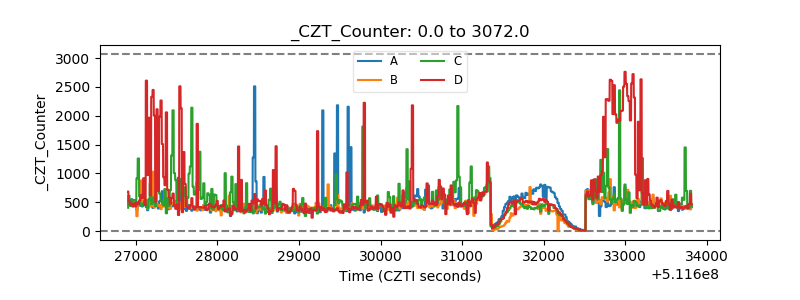 |
| +2.5 Volts monitor | 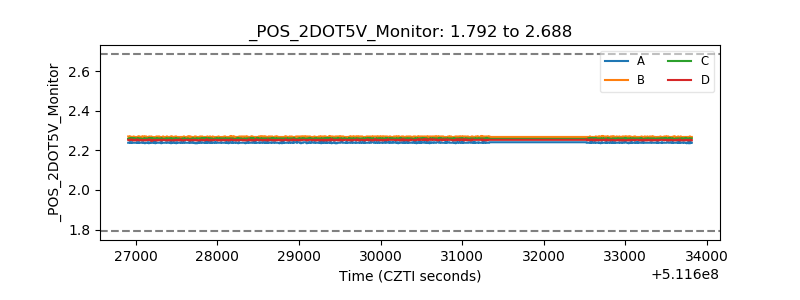 |
| +5 Volts monitor | 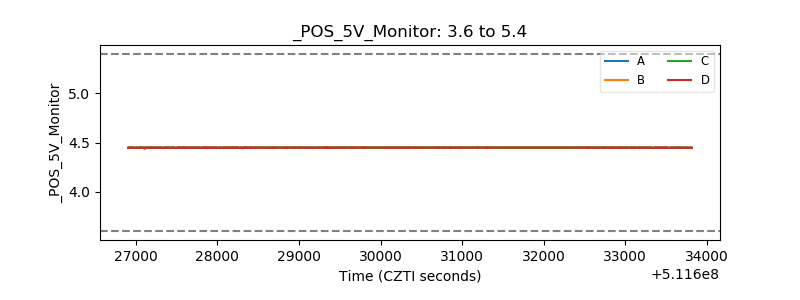 |
| _ROLL_ROT | 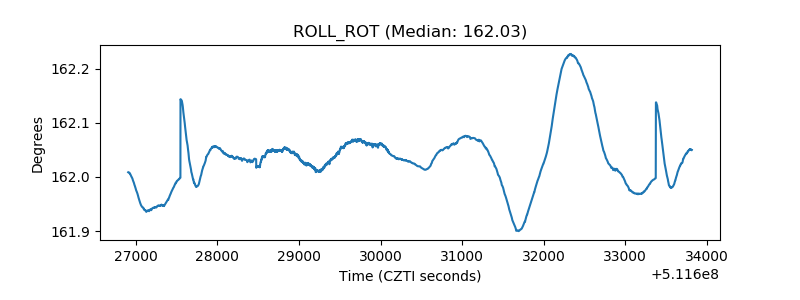 |
| _Roll_DEC | 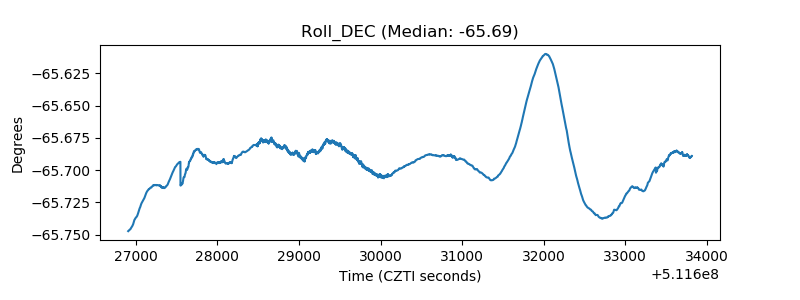 |
| _Roll_RA | 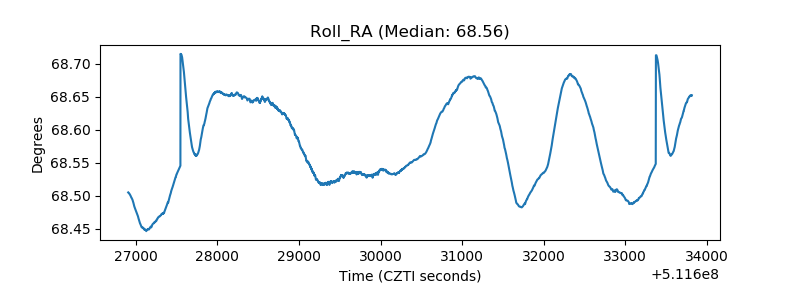 |
| Veto Counter | 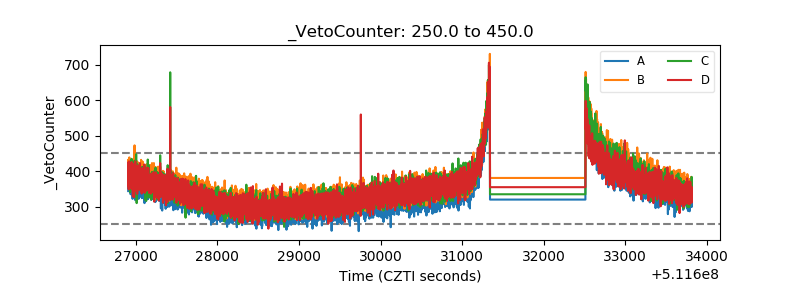 |