| Param | Original file | Final file |
|---|---|---|
| Filename | modeM0/AS1A14_083T06_9000006558_56668cztM0_level2.fits | modeM0/AS1A14_083T06_9000006558_56668cztM0_level2_quad_clean.evt |
| Size (bytes) | 512,887,680 | 87,073,920 |
| Size | 489.1 MB | 83.0 MB |
| Events in quadrant A | 2,993,958 | 611,280 |
| Events in quadrant B | 2,959,495 | 667,232 |
| Events in quadrant C | 9,011,239 | 385,481 |
| Events in quadrant D | 3,530,807 | 532,982 |
| Mode SS | |||
|---|---|---|---|
| Quadrant | BADHDUFLAG | Total packets | Discarded packets |
| A | 0 | 128 | 0 |
| B | 0 | 128 | 0 |
| C | 0 | 128 | 0 |
| D | 0 | 128 | 0 |
| Mode M9 | |||
|---|---|---|---|
| Quadrant | BADHDUFLAG | Total packets | Discarded packets |
| A | 0 | 11 | 0 |
| B | 0 | 11 | 0 |
| C | 0 | 11 | 0 |
| D | 0 | 11 | 0 |
| Mode M0 | |||
|---|---|---|---|
| Quadrant | BADHDUFLAG | Total packets | Discarded packets |
| A | 0 | 13534 | 2 |
| B | 0 | 13338 | 1 |
| C | 0 | 31113 | 1 |
| D | 0 | 15076 | 1 |
| Quadrant | Total seconds | Saturated seconds | Saturation percentage |
|---|---|---|---|
| A | 6296 | 70 | 1.111817% |
| B | 6296 | 39 | 0.619441% |
| C | 6297 | 2248 | 35.699539% |
| D | 6297 | 151 | 2.397967% |
Noise dominated data is calculated using 1-second bins in cleaned event files. If a bin has >2000 counts, and if more than 50% of those come from <1% of pixels, then it is considered to be noise-dominated and hence unusable.
| Quadrant | # 1 sec bins | Bins with >0 counts | Bins with >2000 counts | High rate bins dominated by noise | Noise dominated (total time) | Noise dominated (detector-on time) | Marked lightcurve |
|---|---|---|---|---|---|---|---|
| A | 7431 | 6297 | 51 | 51 | 0.69% | 0.81% | 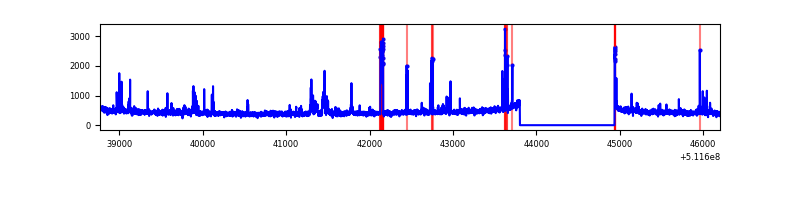 |
| B | 7431 | 6297 | 11 | 11 | 0.15% | 0.17% | 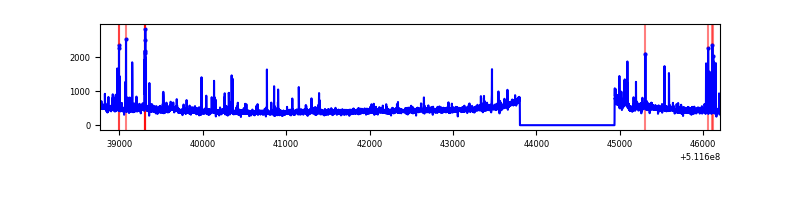 |
| C | 7432 | 6297 | 2309 | 2309 | 31.07% | 36.67% | 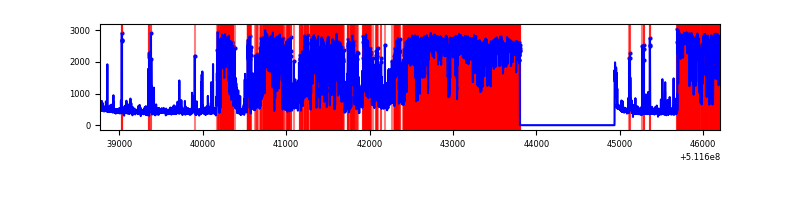 |
| D | 7432 | 6298 | 150 | 150 | 2.02% | 2.38% | 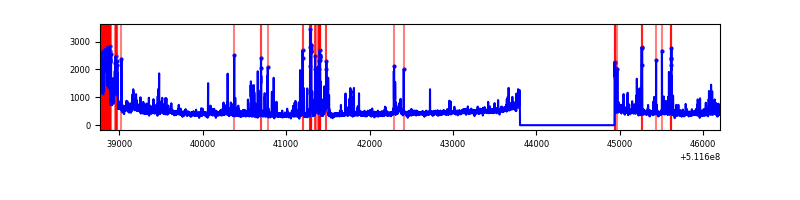 |
Top three noisy pixels from each quadrant. If the there are fewer than three noisy pixels in the level2.evt file, extra rows are filled as -1
| Pixel properties | Quadrant properties | ||||||
|---|---|---|---|---|---|---|---|
| Quadrant | DetID | PixID | Counts | Sigma | Mean | Median | Sigma |
| A | 7 | 64 | 172699 | 1034.61 | 672 | 654 | 166.3 |
| A | 12 | 3 | 58355 | 346.99 | 672 | 654 | 166.3 |
| A | 8 | 249 | 52832 | 313.78 | 672 | 654 | 166.3 |
| B | 0 | 63 | 96982 | 669.53 | 673 | 647 | 143.9 |
| B | 10 | 247 | 73078 | 503.4 | 673 | 647 | 143.9 |
| B | 7 | 252 | 33547 | 228.66 | 673 | 647 | 143.9 |
| C | 15 | 230 | 6341634 | 43461.67 | 523 | 517 | 145.9 |
| C | 12 | 252 | 116826 | 797.18 | 523 | 517 | 145.9 |
| C | 1 | 16 | 112392 | 766.79 | 523 | 517 | 145.9 |
| D | 2 | 249 | 341568 | 1892.71 | 635 | 606 | 180.1 |
| D | 8 | 129 | 176901 | 978.63 | 635 | 606 | 180.1 |
| D | 3 | 12 | 111622 | 616.26 | 635 | 606 | 180.1 |
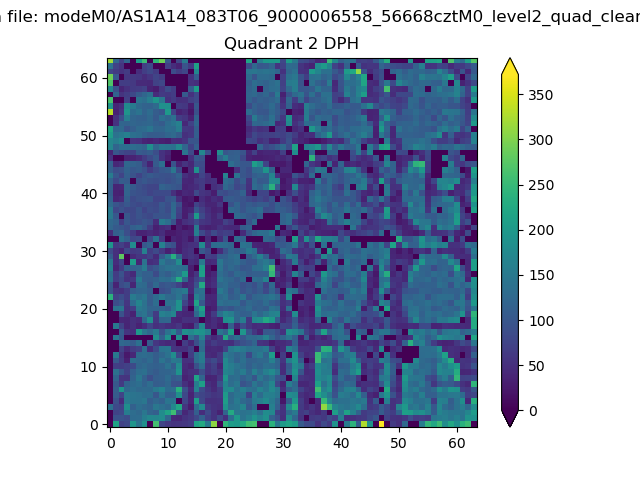
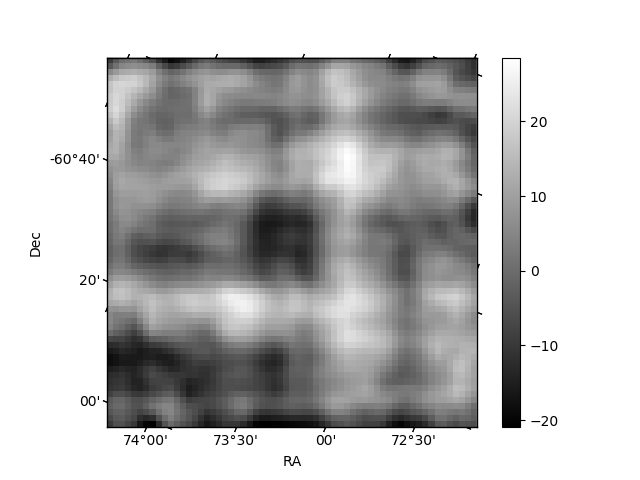
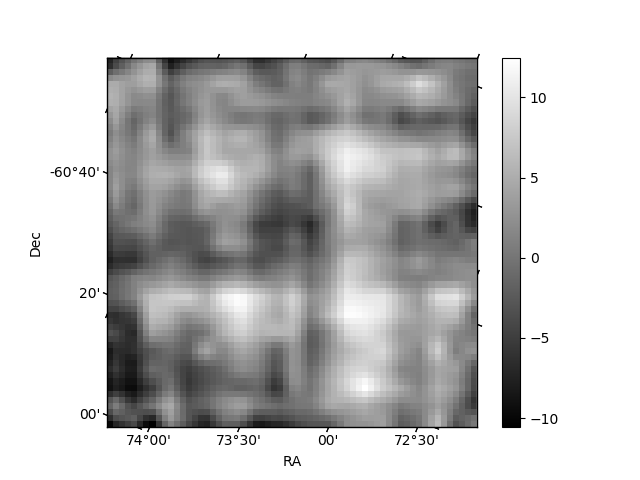
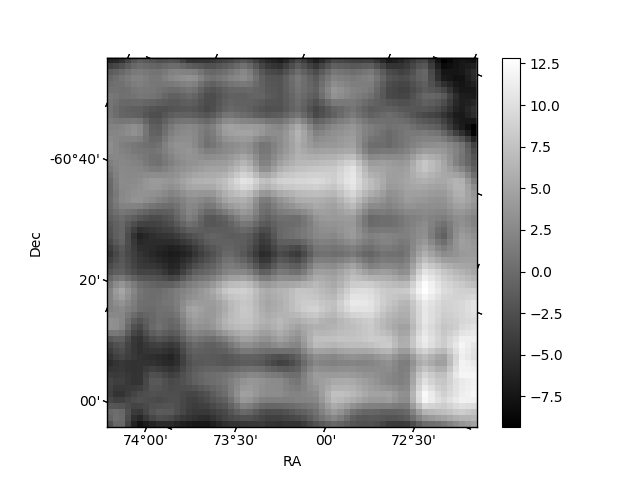
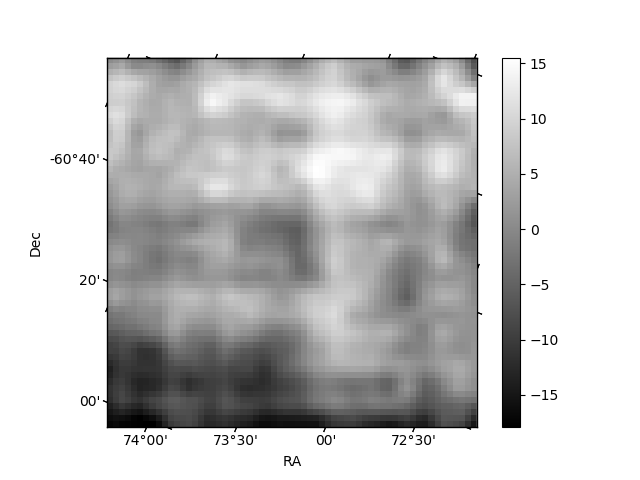
Histogram calculated using DETX and DETY for each event in the final _common_clean file
| Quadrant A | 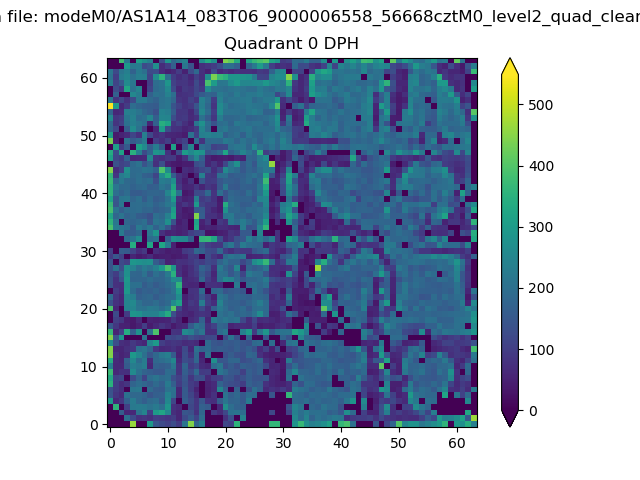 |
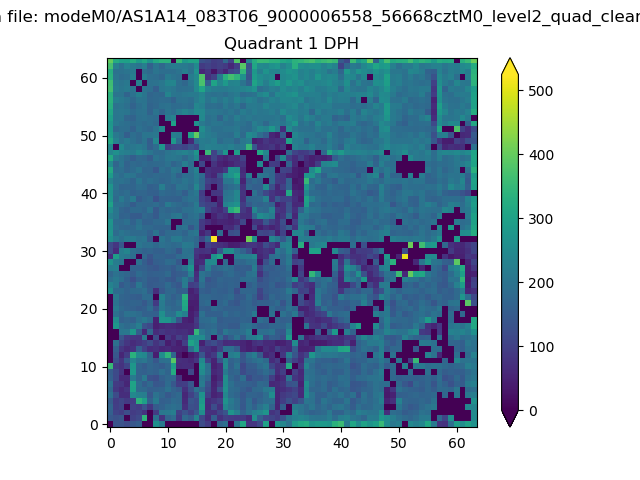 |
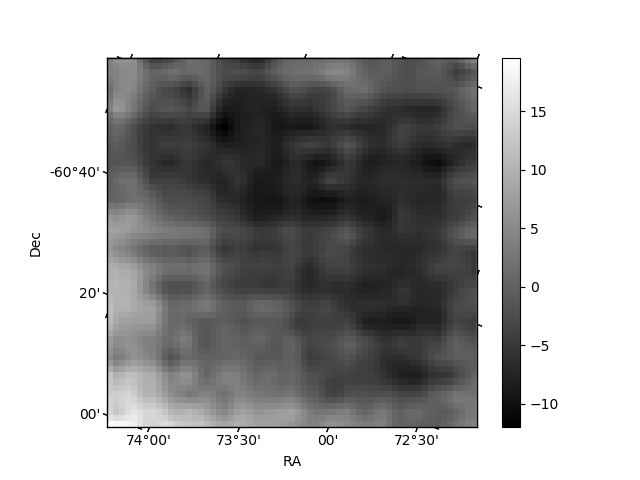
Quadrant B |
|---|---|---|---|
| Quadrant D | 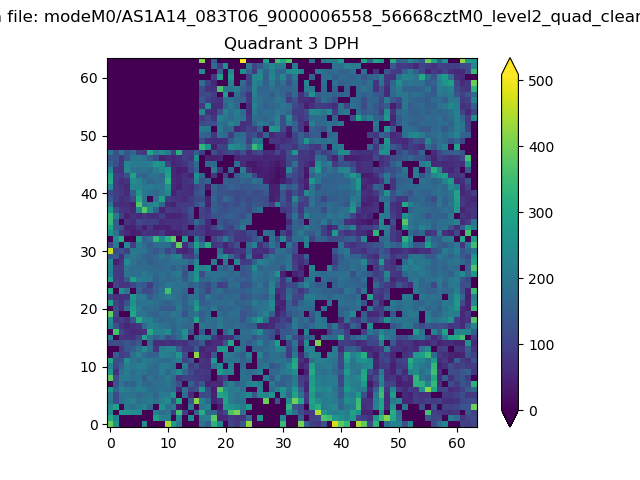 |
 |
Quadrant C |
| Plot type | Count rate plots | Images |
|---|---|---|
| Comparison with Poisson distribution Blue bars denote a histogram of data divided into 1 sec bins. Red curve is a Poisson curve with rate = median count rate of data. |
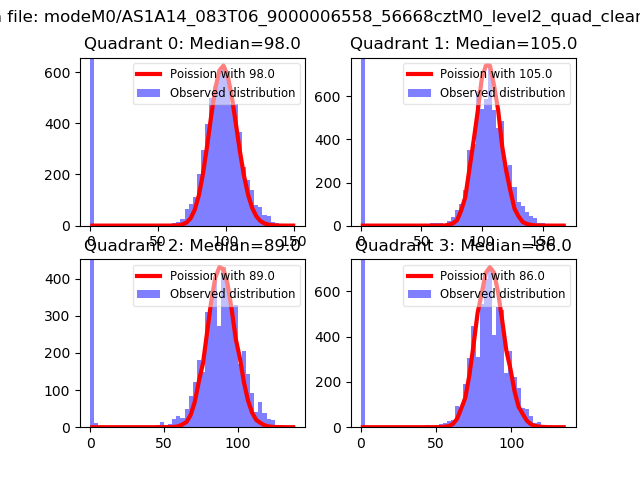 |
 |
| Quadrant-wise count rates Data is divided into 100 sec bins |
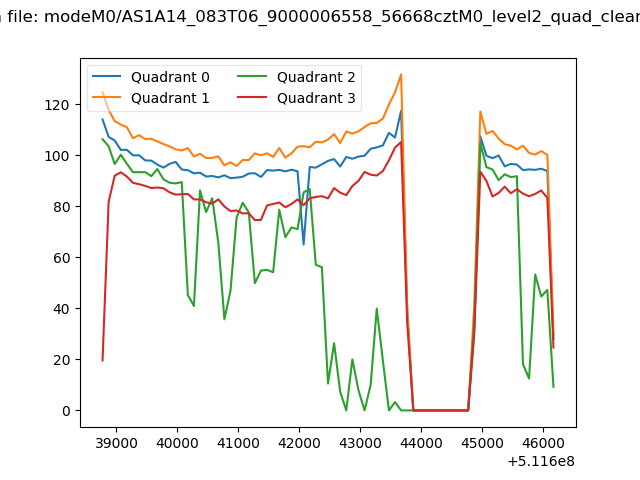 |
|
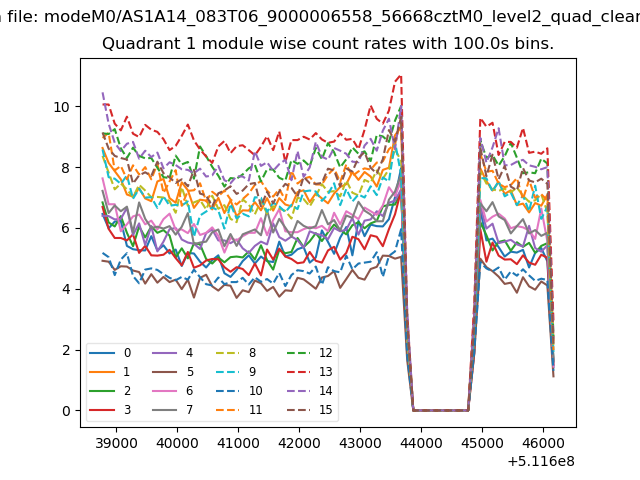
| Module-wise count rates for Quadrant A Data is divided into 100 sec bins |
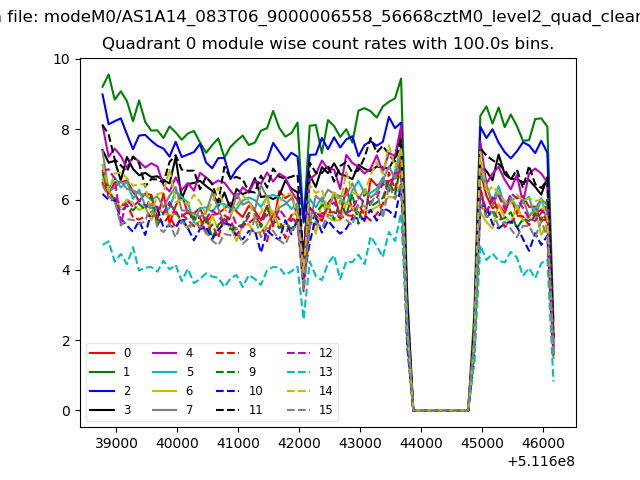 |
 |
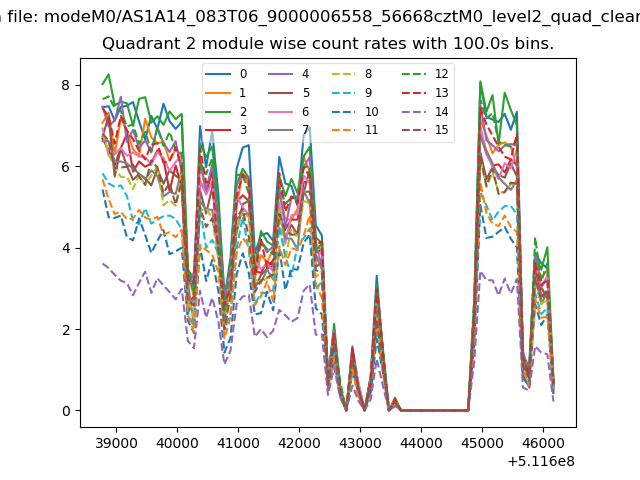
| Module-wise count rates for Quadrant B Data is divided into 100 sec bins |
 |
 |
| Module-wise count rates for Quadrant C Data is divided into 100 sec bins |
 |
 |
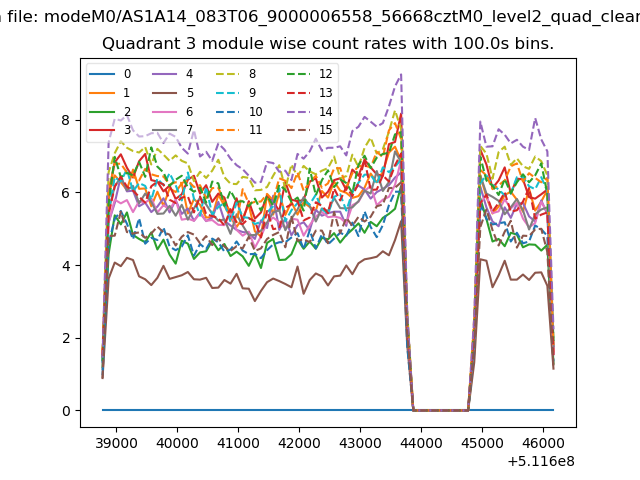
| Module-wise count rates for Quadrant D Data is divided into 100 sec bins |
 |
 |
| Parameter | Plot |
|---|---|
| CZT HV Monitor | 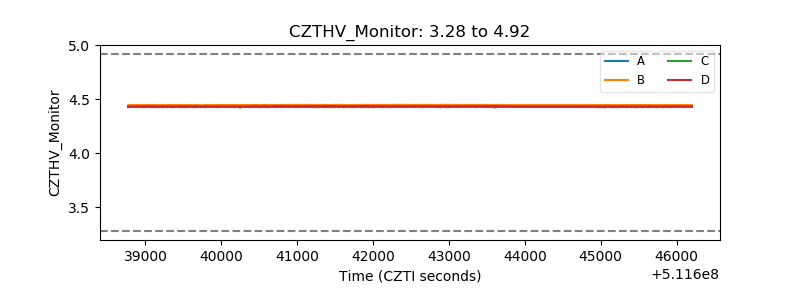 |
| D_VDD | 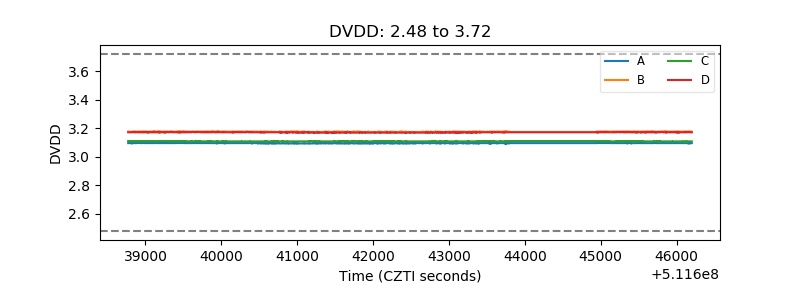 |
| Temperature 1 | 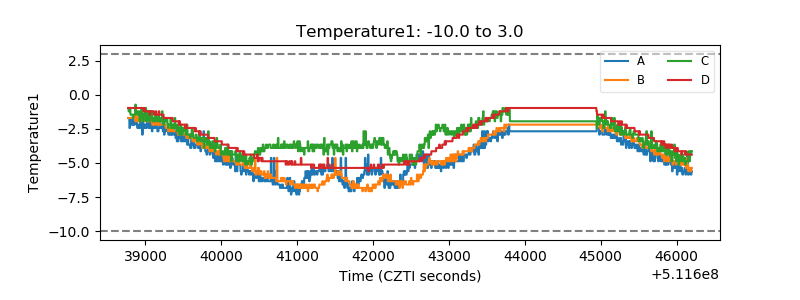 |
| Veto HV Monitor |  |
| Veto LLD | 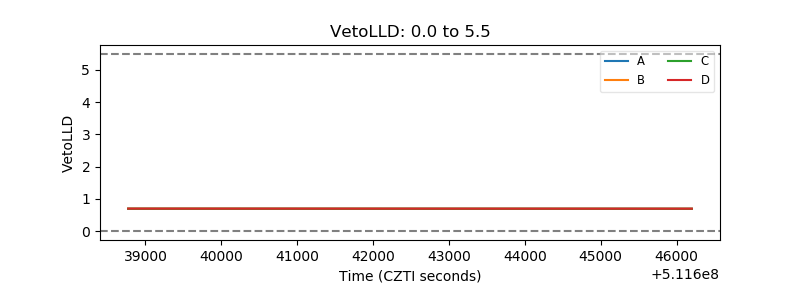 |
| Alpha Counter | 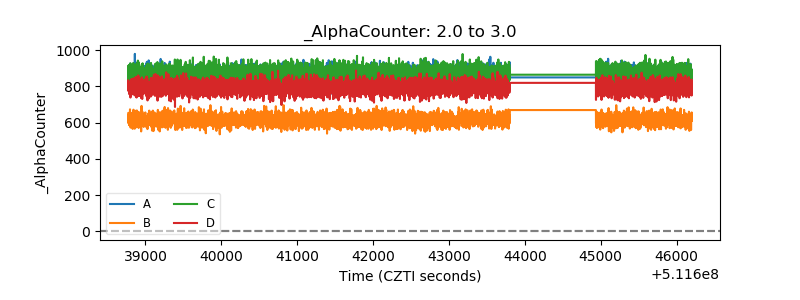 |
| _CPM_Rate | 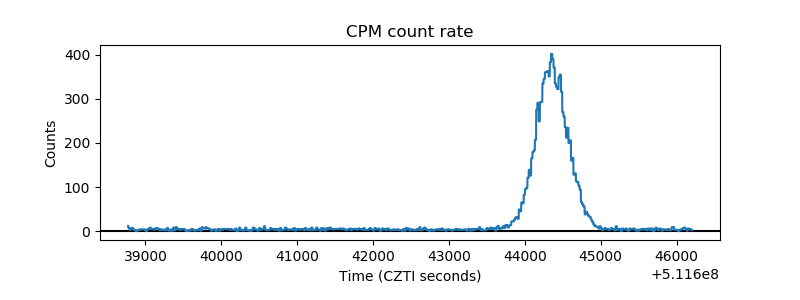 |
| CZT Counter | 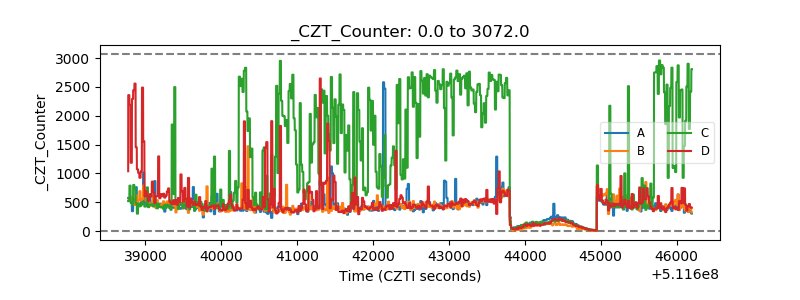 |
| +2.5 Volts monitor |  |
| +5 Volts monitor |  |
| _ROLL_ROT | 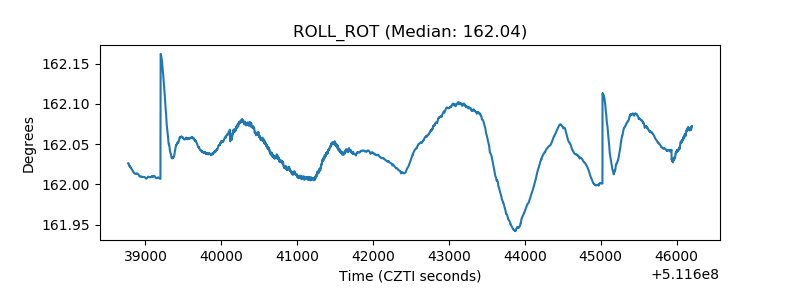 |
| _Roll_DEC | 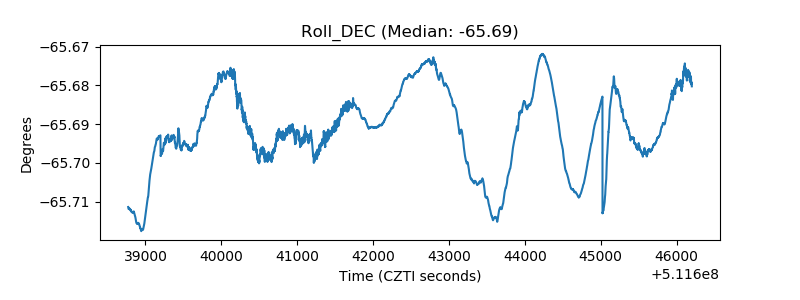 |
| _Roll_RA | 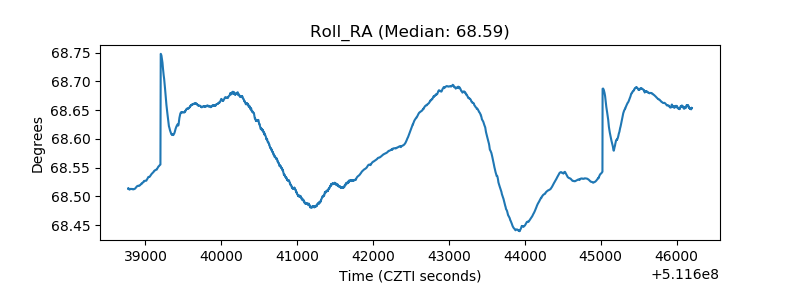 |
| Veto Counter | 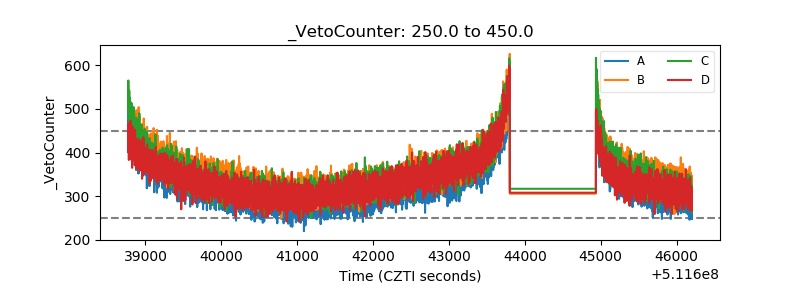 |