| Param | Original file | Final file |
|---|---|---|
| Filename | modeM0/AS1A14_083T06_9000006558_56670cztM0_level2.fits | modeM0/AS1A14_083T06_9000006558_56670cztM0_level2_quad_clean.evt |
| Size (bytes) | 436,487,040 | 101,952,000 |
| Size | 416.3 MB | 97.2 MB |
| Events in quadrant A | 3,507,417 | 666,159 |
| Events in quadrant B | 3,331,814 | 723,537 |
| Events in quadrant C | 4,492,231 | 619,916 |
| Events in quadrant D | 4,272,187 | 581,661 |
| Mode SS | |||
|---|---|---|---|
| Quadrant | BADHDUFLAG | Total packets | Discarded packets |
| A | 0 | 144 | 0 |
| B | 0 | 144 | 0 |
| C | 0 | 144 | 0 |
| D | 0 | 144 | 0 |
| Mode M9 | |||
|---|---|---|---|
| Quadrant | BADHDUFLAG | Total packets | Discarded packets |
| A | 0 | 6 | 0 |
| B | 0 | 7 | 0 |
| C | 0 | 7 | 0 |
| D | 0 | 7 | 0 |
| Mode M0 | |||
|---|---|---|---|
| Quadrant | BADHDUFLAG | Total packets | Discarded packets |
| A | 0 | 15811 | 2 |
| B | 0 | 14973 | 2 |
| C | 0 | 18282 | 2 |
| D | 0 | 17967 | 2 |
| Quadrant | Total seconds | Saturated seconds | Saturation percentage |
|---|---|---|---|
| A | 7121 | 99 | 1.390254% |
| B | 7121 | 67 | 0.940879% |
| C | 7120 | 185 | 2.598315% |
| D | 7120 | 197 | 2.766854% |
Noise dominated data is calculated using 1-second bins in cleaned event files. If a bin has >2000 counts, and if more than 50% of those come from <1% of pixels, then it is considered to be noise-dominated and hence unusable.
| Quadrant | # 1 sec bins | Bins with >0 counts | Bins with >2000 counts | High rate bins dominated by noise | Noise dominated (total time) | Noise dominated (detector-on time) | Marked lightcurve |
|---|---|---|---|---|---|---|---|
| A | 7616 | 7121 | 71 | 71 | 0.93% | 1.00% | 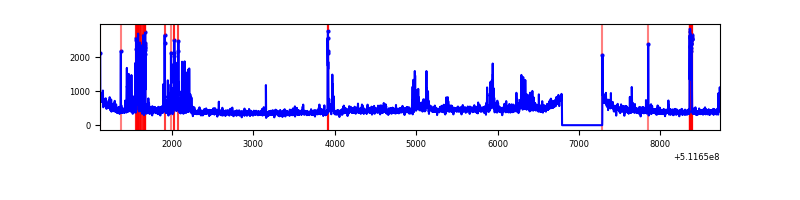 |
| B | 7616 | 7121 | 18 | 18 | 0.24% | 0.25% | 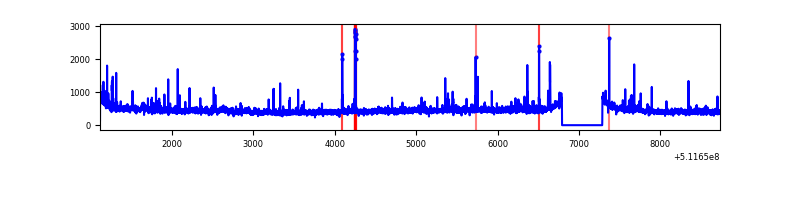 |
| C | 7615 | 7121 | 175 | 175 | 2.30% | 2.46% | 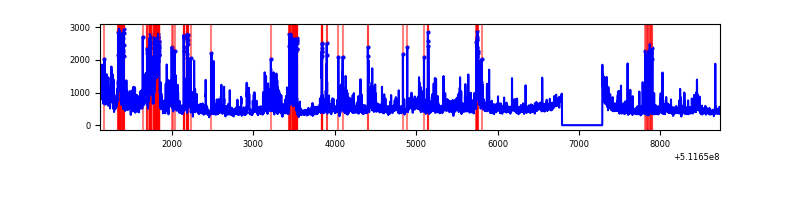 |
| D | 7615 | 7120 | 164 | 164 | 2.15% | 2.30% | 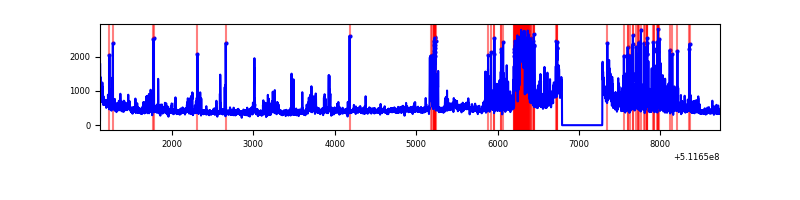 |
Top three noisy pixels from each quadrant. If the there are fewer than three noisy pixels in the level2.evt file, extra rows are filled as -1
| Pixel properties | Quadrant properties | ||||||
|---|---|---|---|---|---|---|---|
| Quadrant | DetID | PixID | Counts | Sigma | Mean | Median | Sigma |
| A | 10 | 251 | 239830 | 1290.57 | 753 | 734 | 185.3 |
| A | 8 | 26 | 176937 | 951.09 | 753 | 734 | 185.3 |
| A | 8 | 249 | 67478 | 360.26 | 753 | 734 | 185.3 |
| B | 0 | 63 | 119727 | 738.24 | 751 | 723 | 161.2 |
| B | 4 | 21 | 61176 | 375.02 | 751 | 723 | 161.2 |
| B | 10 | 247 | 44608 | 272.24 | 751 | 723 | 161.2 |
| C | 9 | 38 | 460182 | 2340.68 | 723 | 715 | 196.3 |
| C | 15 | 230 | 307466 | 1562.69 | 723 | 715 | 196.3 |
| C | 12 | 252 | 245433 | 1246.67 | 723 | 715 | 196.3 |
| D | 2 | 31 | 429297 | 2127.1 | 716 | 684 | 201.5 |
| D | 2 | 249 | 338797 | 1677.97 | 716 | 684 | 201.5 |
| D | 8 | 129 | 156306 | 772.31 | 716 | 684 | 201.5 |
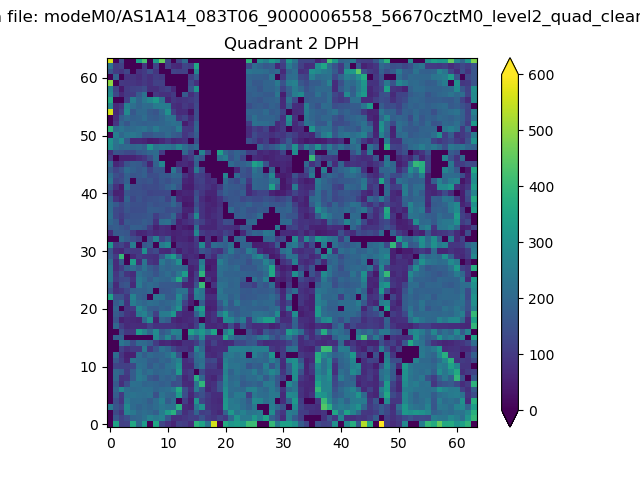
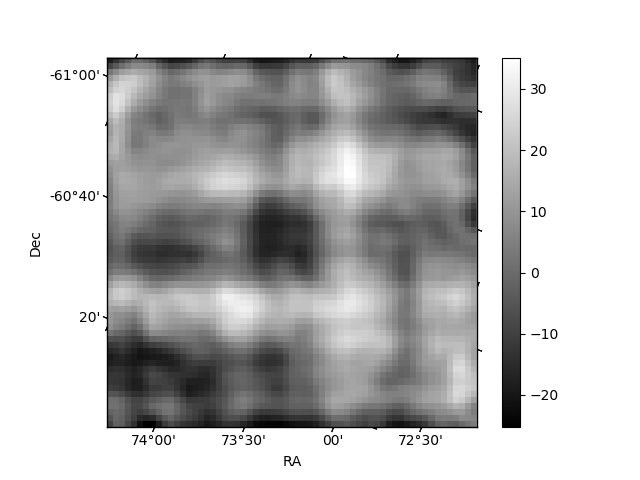
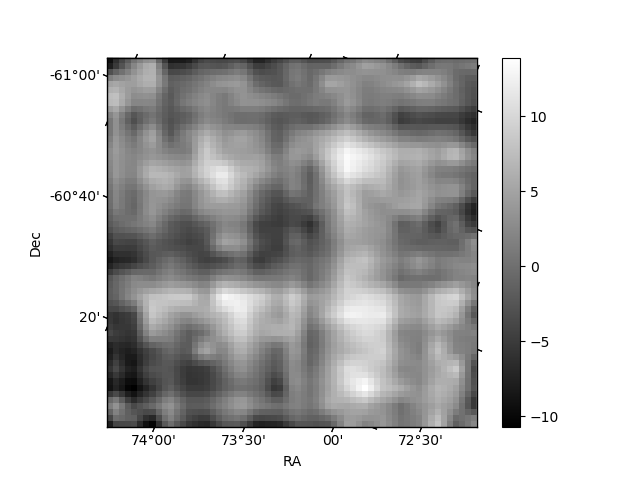
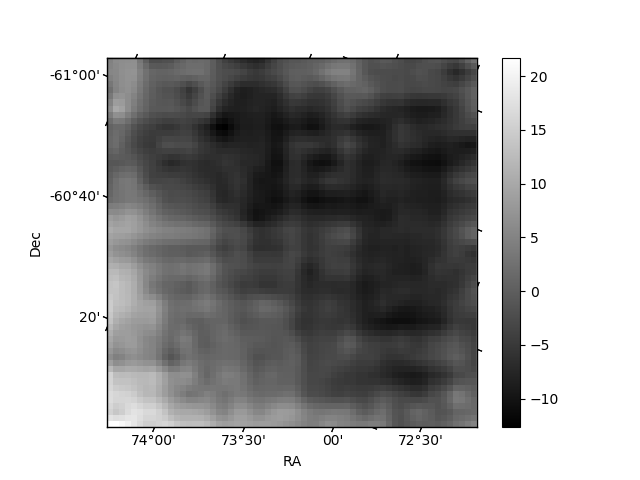
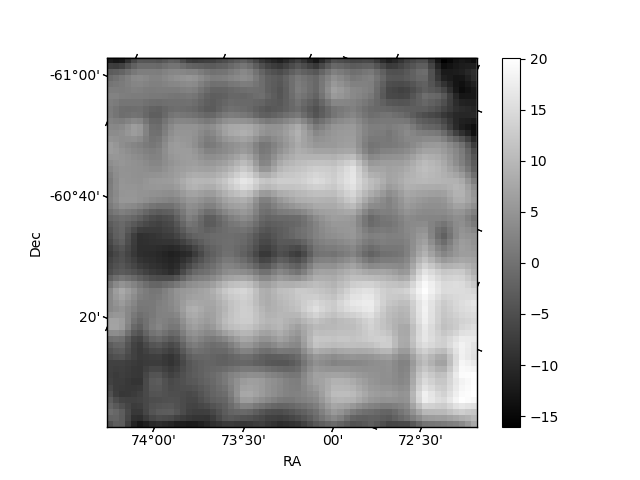
Histogram calculated using DETX and DETY for each event in the final _common_clean file
| Quadrant A | 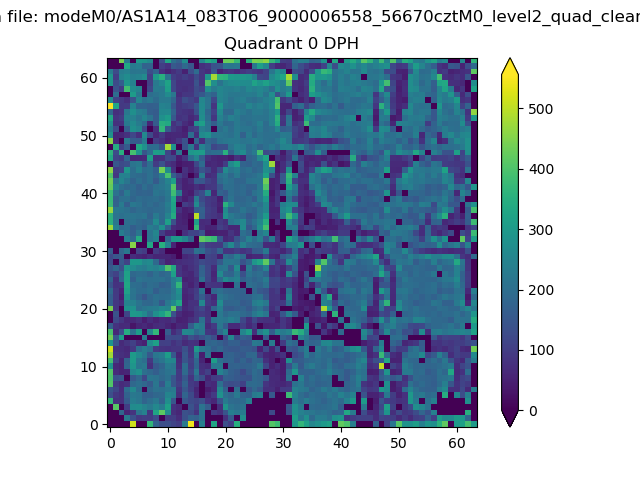 |
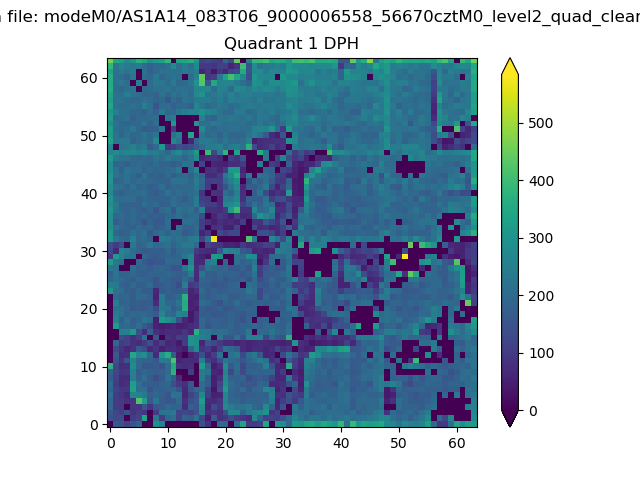 |
Quadrant B |
|---|---|---|---|
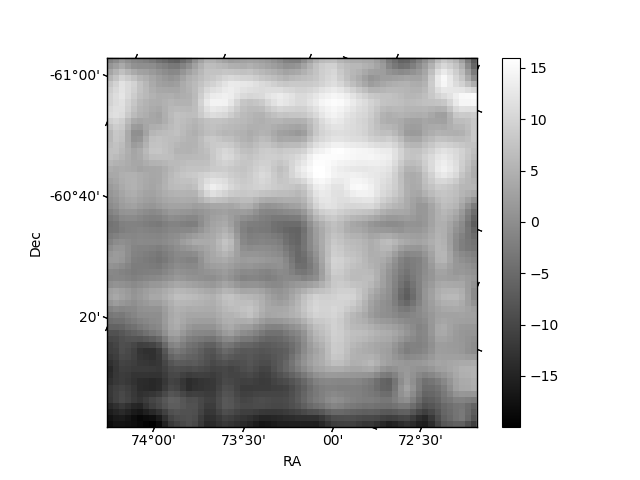
| Quadrant D | 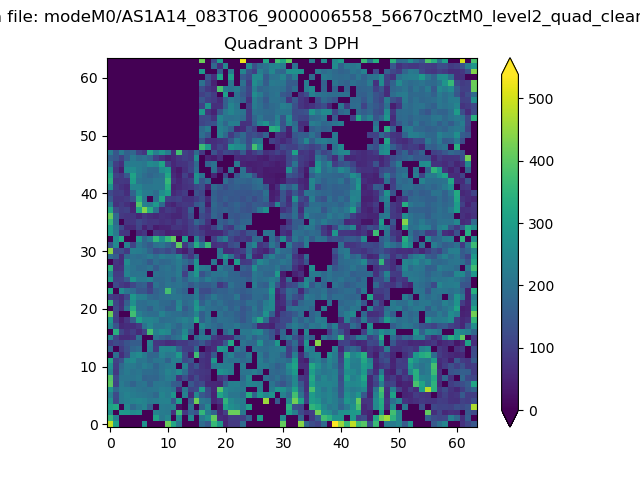 |
 |
Quadrant C |
| Plot type | Count rate plots | Images |
|---|---|---|
| Comparison with Poisson distribution Blue bars denote a histogram of data divided into 1 sec bins. Red curve is a Poisson curve with rate = median count rate of data. |
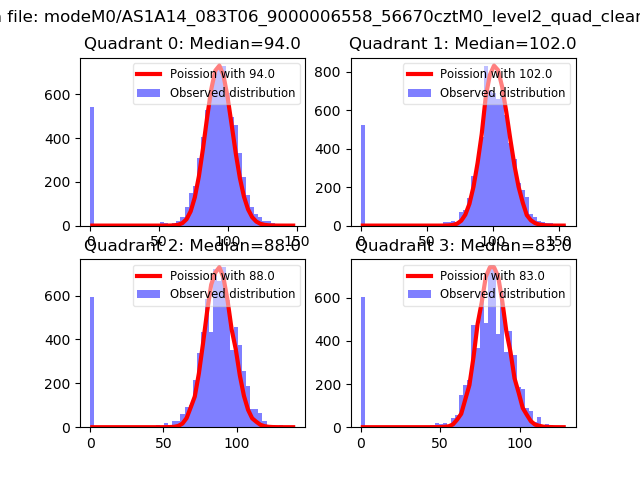 |
 |
| Quadrant-wise count rates Data is divided into 100 sec bins |
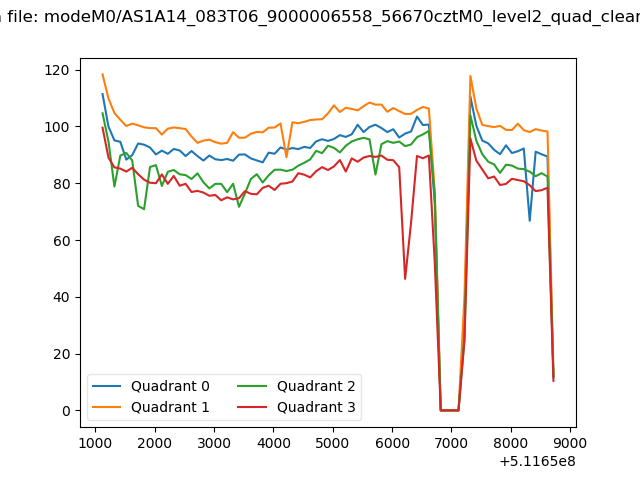 |
|
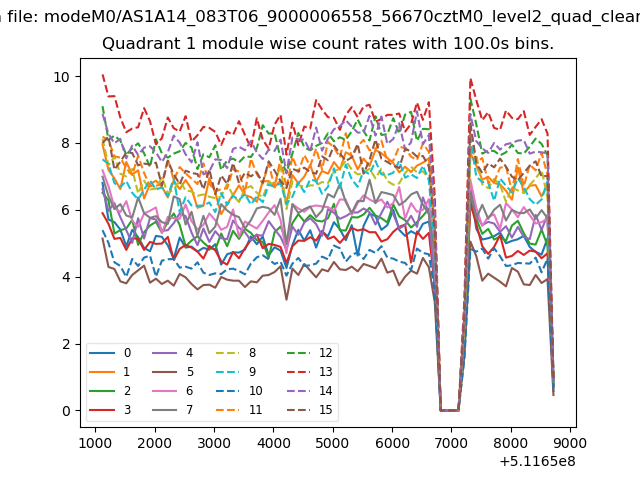
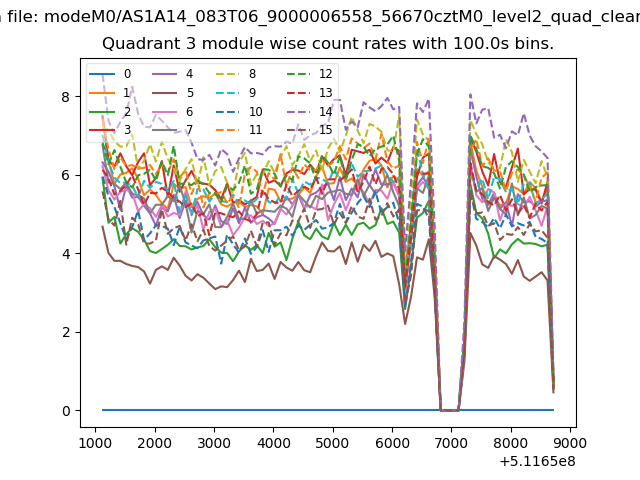
| Module-wise count rates for Quadrant A Data is divided into 100 sec bins |
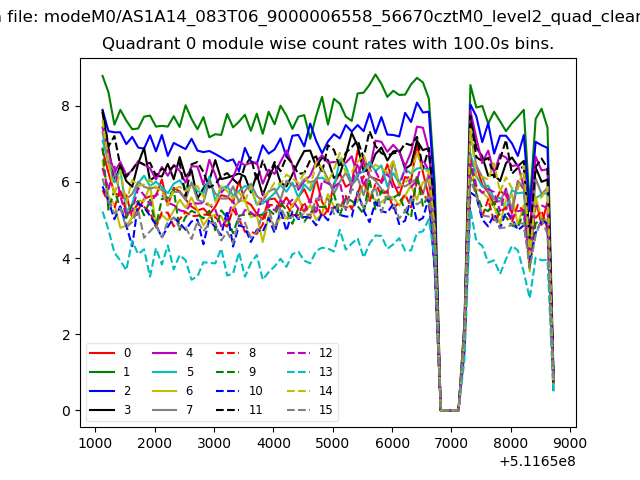 |
 |
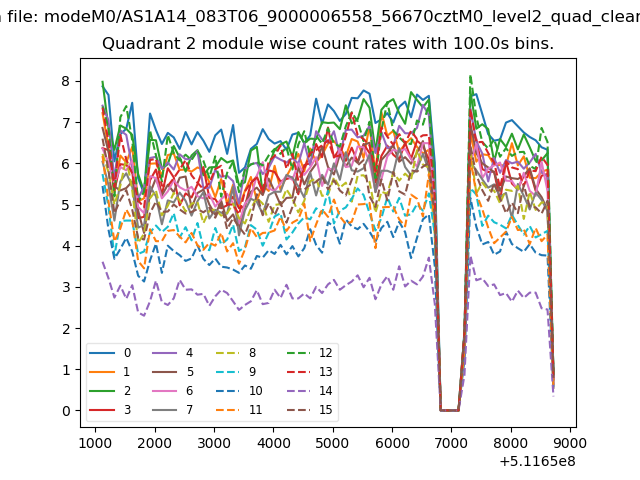
| Module-wise count rates for Quadrant B Data is divided into 100 sec bins |
 |
 |
| Module-wise count rates for Quadrant C Data is divided into 100 sec bins |
 |
 |
| Module-wise count rates for Quadrant D Data is divided into 100 sec bins |
 |
 |
| Parameter | Plot |
|---|---|
| CZT HV Monitor | 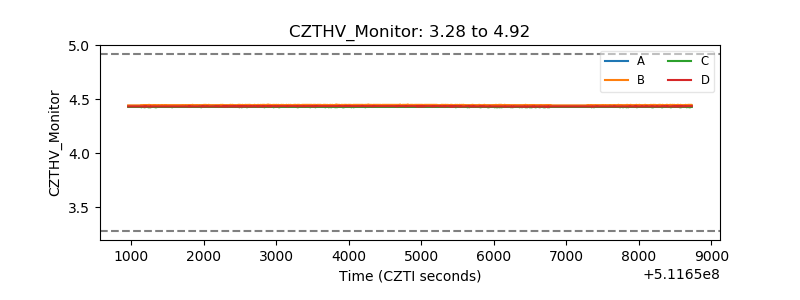 |
| D_VDD | 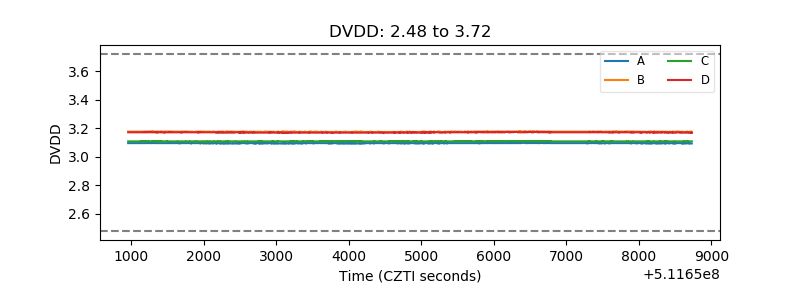 |
| Temperature 1 | 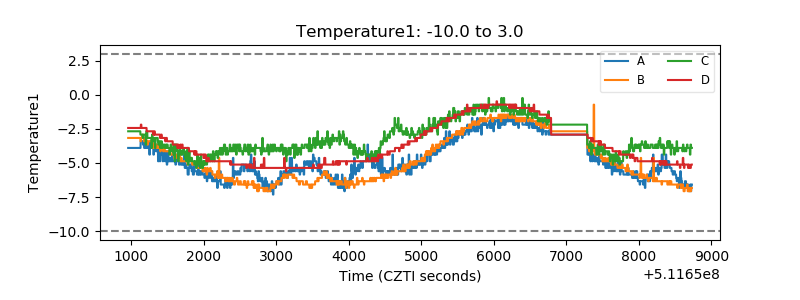 |
| Veto HV Monitor | 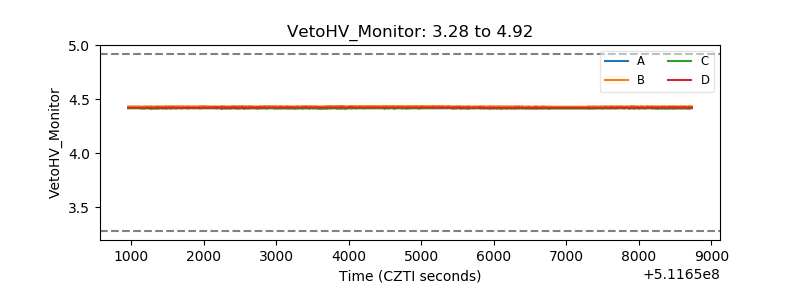 |
| Veto LLD | 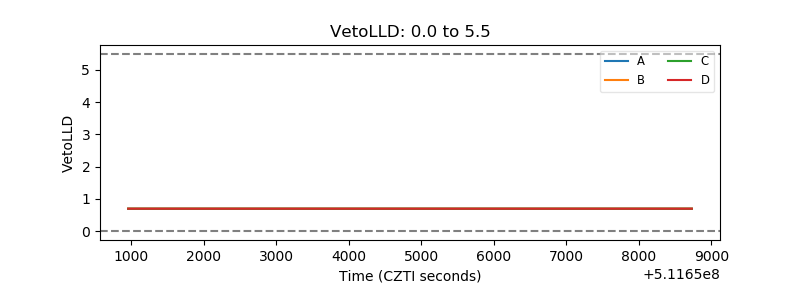 |
| Alpha Counter | 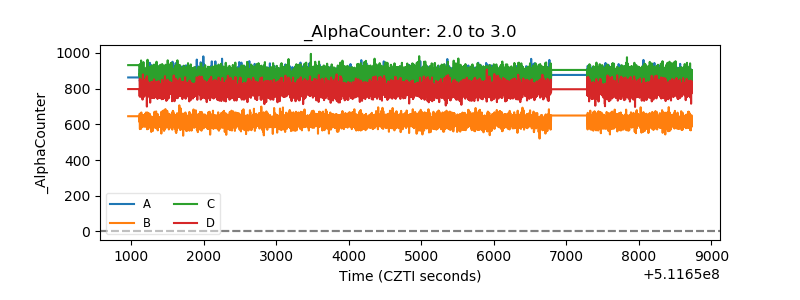 |
| _CPM_Rate | 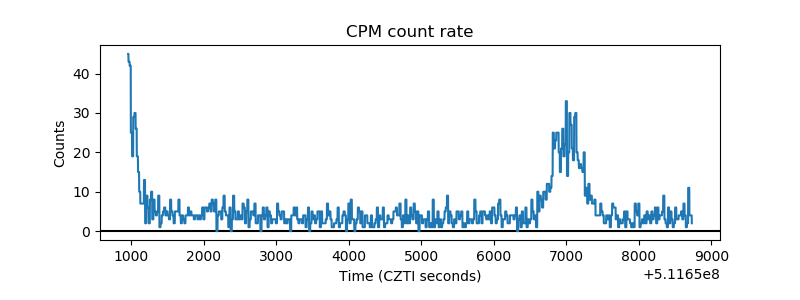 |
| CZT Counter | 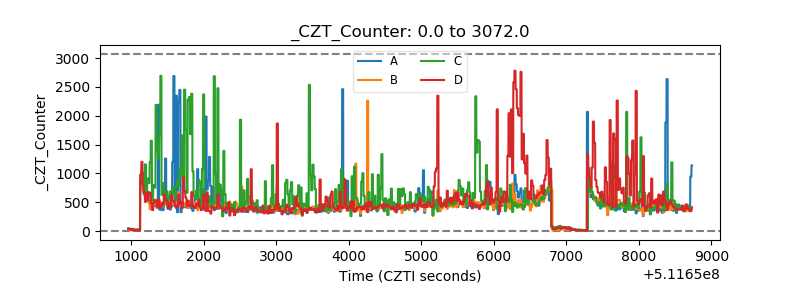 |
| +2.5 Volts monitor |  |
| +5 Volts monitor |  |
| _ROLL_ROT | 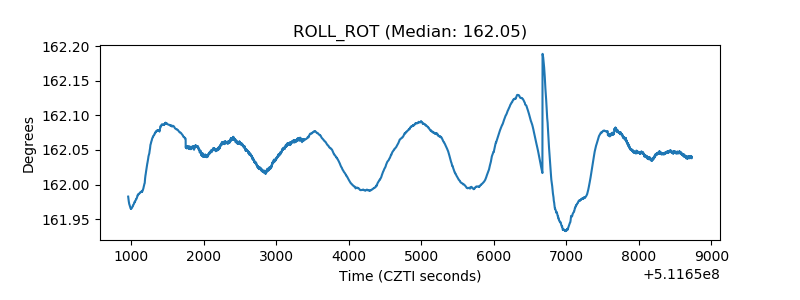 |
| _Roll_DEC | 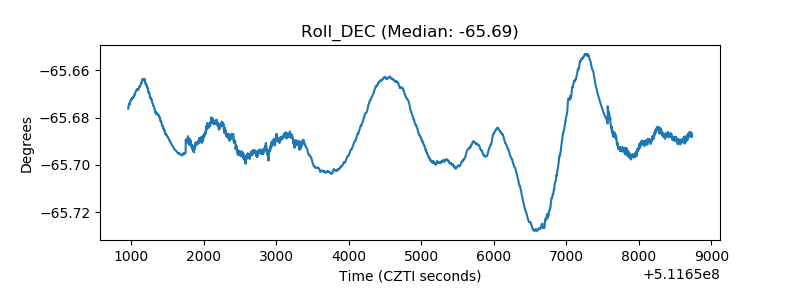 |
| _Roll_RA | 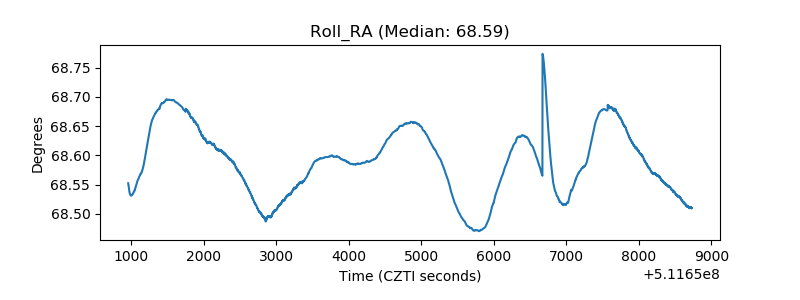 |
| Veto Counter | 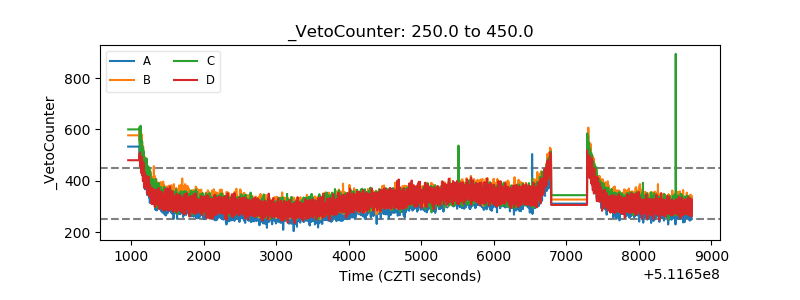 |