| Param | Original file | Final file |
|---|---|---|
| Filename | modeM0/AS1A14_083T06_9000006558_56672cztM0_level2.fits | modeM0/AS1A14_083T06_9000006558_56672cztM0_level2_quad_clean.evt |
| Size (bytes) | 607,331,520 | 130,452,480 |
| Size | 579.2 MB | 124.4 MB |
| Events in quadrant A | 5,830,244 | 832,727 |
| Events in quadrant B | 4,336,129 | 932,051 |
| Events in quadrant C | 4,743,490 | 811,369 |
| Events in quadrant D | 6,857,542 | 735,344 |
| Mode SS | |||
|---|---|---|---|
| Quadrant | BADHDUFLAG | Total packets | Discarded packets |
| A | 0 | 184 | 0 |
| B | 0 | 184 | 0 |
| C | 0 | 184 | 0 |
| D | 0 | 184 | 0 |
| Mode M0 | |||
|---|---|---|---|
| Quadrant | BADHDUFLAG | Total packets | Discarded packets |
| A | 0 | 24036 | 3 |
| B | 0 | 19709 | 0 |
| C | 0 | 20744 | 0 |
| D | 0 | 27045 | 0 |
| Quadrant | Total seconds | Saturated seconds | Saturation percentage |
|---|---|---|---|
| A | 9201 | 421 | 4.575590% |
| B | 9201 | 68 | 0.739050% |
| C | 9201 | 63 | 0.684708% |
| D | 9202 | 488 | 5.303195% |
Noise dominated data is calculated using 1-second bins in cleaned event files. If a bin has >2000 counts, and if more than 50% of those come from <1% of pixels, then it is considered to be noise-dominated and hence unusable.
| Quadrant | # 1 sec bins | Bins with >0 counts | Bins with >2000 counts | High rate bins dominated by noise | Noise dominated (total time) | Noise dominated (detector-on time) | Marked lightcurve |
|---|---|---|---|---|---|---|---|
| A | 9200 | 9200 | 410 | 410 | 4.46% | 4.46% | 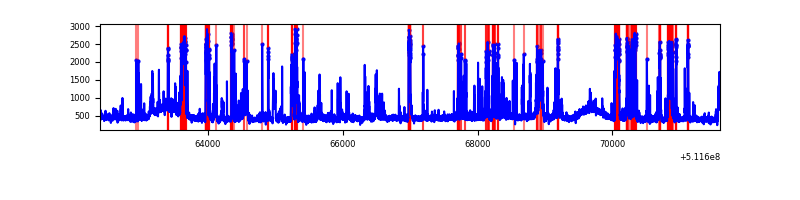 |
| B | 9200 | 9200 | 26 | 26 | 0.28% | 0.28% | 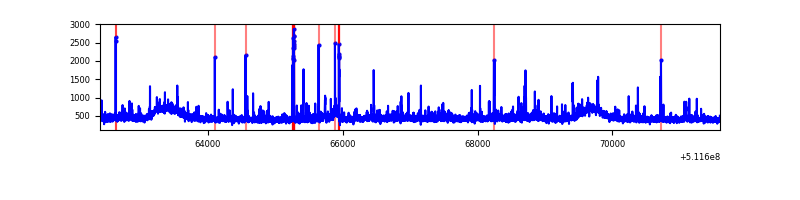 |
| C | 9200 | 9200 | 39 | 39 | 0.42% | 0.42% |  |
| D | 9201 | 9201 | 499 | 499 | 5.42% | 5.42% | 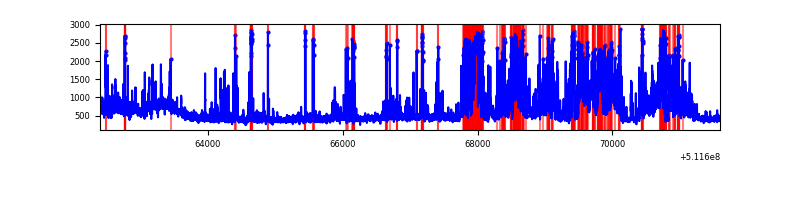 |
Top three noisy pixels from each quadrant. If the there are fewer than three noisy pixels in the level2.evt file, extra rows are filled as -1
| Pixel properties | Quadrant properties | ||||||
|---|---|---|---|---|---|---|---|
| Quadrant | DetID | PixID | Counts | Sigma | Mean | Median | Sigma |
| A | 8 | 26 | 1562805 | 6488.93 | 979 | 954 | 240.7 |
| A | 0 | 8 | 357236 | 1480.22 | 979 | 954 | 240.7 |
| A | 8 | 249 | 57806 | 236.2 | 979 | 954 | 240.7 |
| B | 4 | 21 | 125163 | 581.76 | 994 | 955 | 213.5 |
| B | 0 | 213 | 100856 | 467.91 | 994 | 955 | 213.5 |
| B | 10 | 247 | 42172 | 193.05 | 994 | 955 | 213.5 |
| C | 12 | 252 | 227863 | 863.31 | 968 | 960 | 262.8 |
| C | 15 | 148 | 190363 | 720.63 | 968 | 960 | 262.8 |
| C | 9 | 38 | 78226 | 293.98 | 968 | 960 | 262.8 |
| D | 8 | 240 | 1465492 | 5589.43 | 942 | 903 | 262.0 |
| D | 2 | 249 | 810860 | 3091.11 | 942 | 903 | 262.0 |
| D | 10 | 199 | 180694 | 686.15 | 942 | 903 | 262.0 |
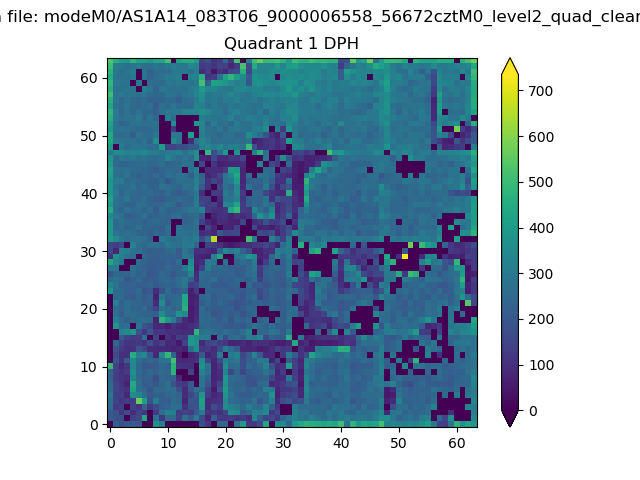
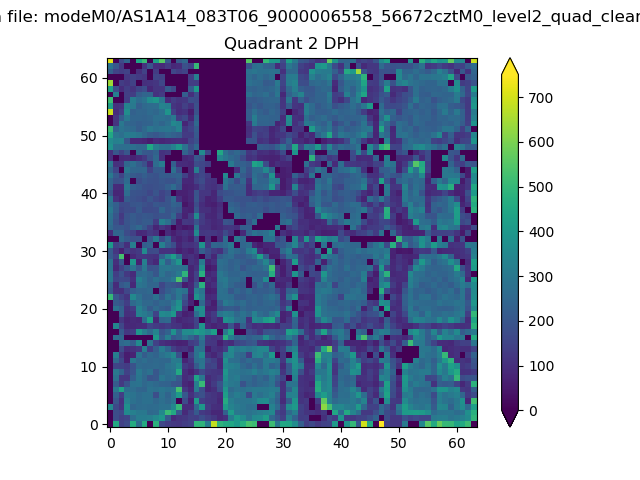
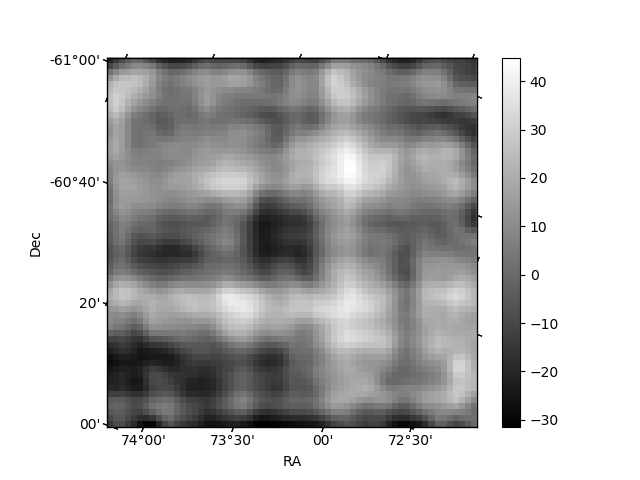
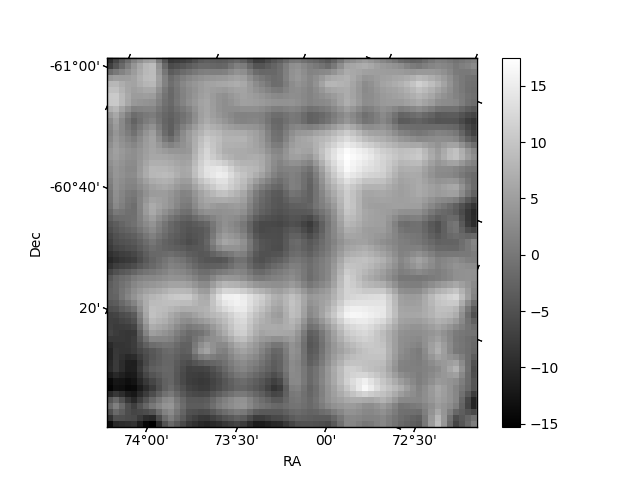
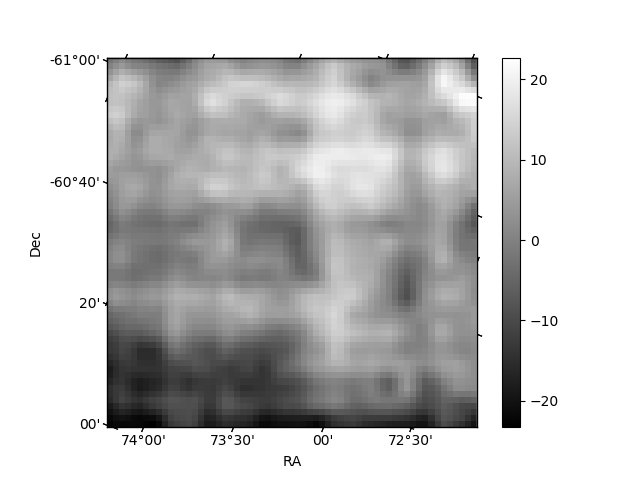
Histogram calculated using DETX and DETY for each event in the final _common_clean file
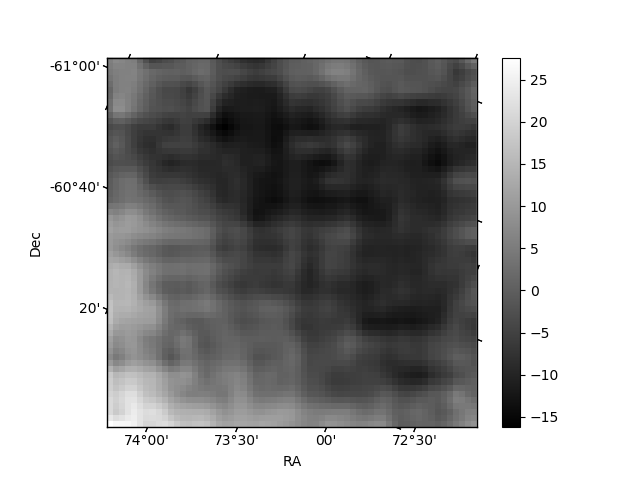
| Quadrant A | 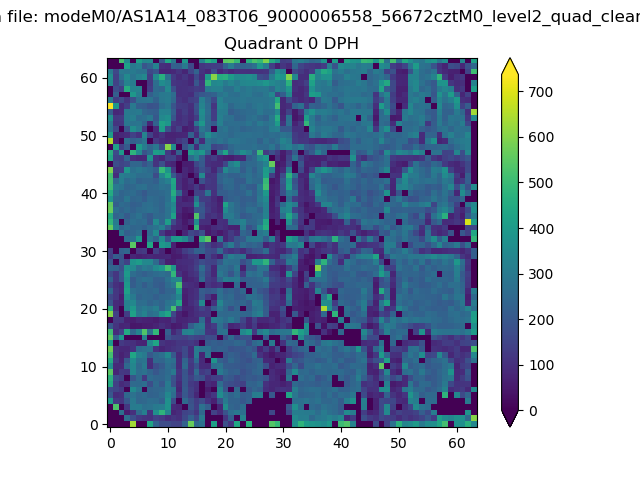 |
 |
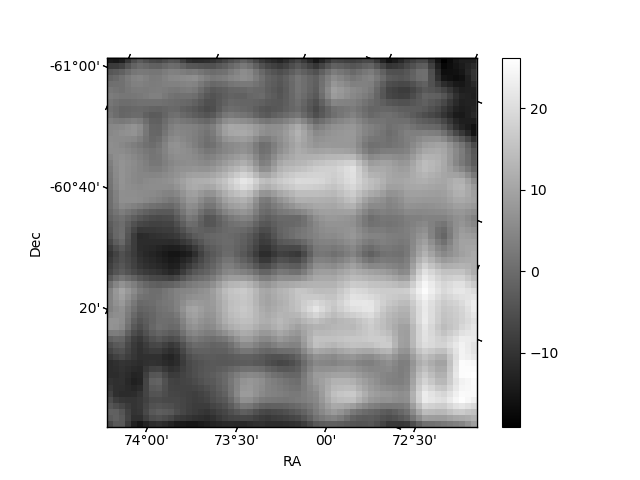
Quadrant B |
|---|---|---|---|
| Quadrant D | 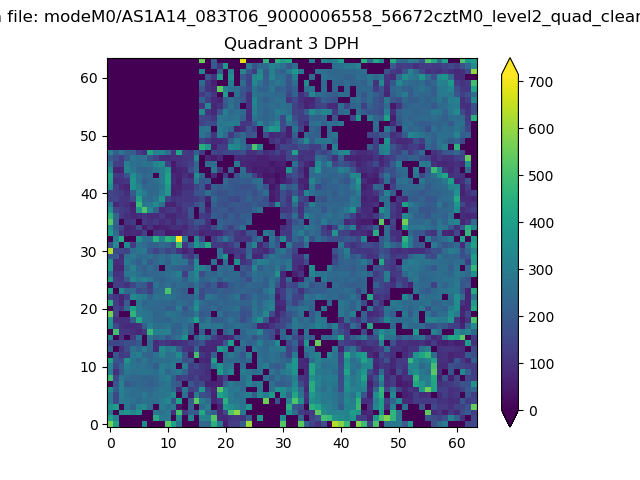 |
 |
Quadrant C |
| Plot type | Count rate plots | Images |
|---|---|---|
| Comparison with Poisson distribution Blue bars denote a histogram of data divided into 1 sec bins. Red curve is a Poisson curve with rate = median count rate of data. |
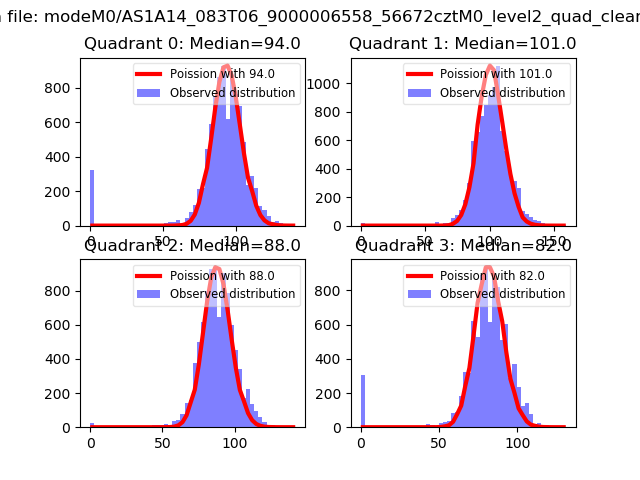 |
 |
| Quadrant-wise count rates Data is divided into 100 sec bins |
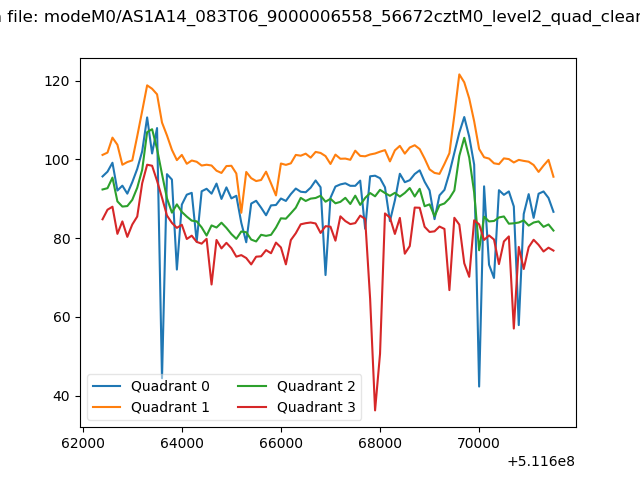 |
|
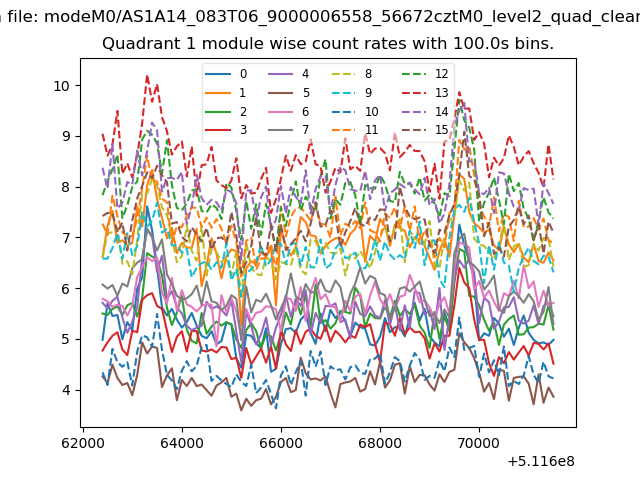
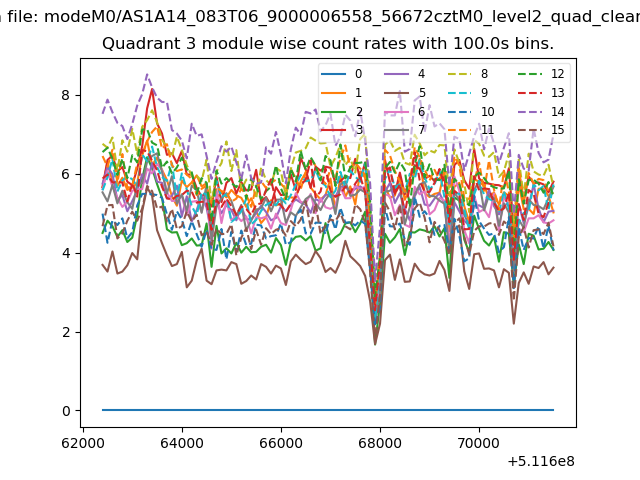
| Module-wise count rates for Quadrant A Data is divided into 100 sec bins |
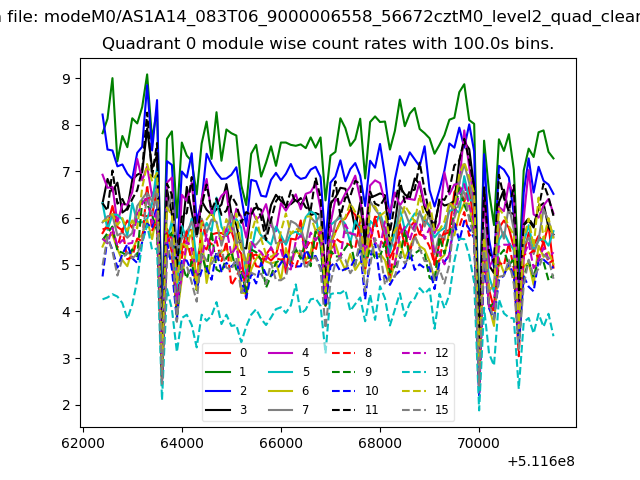 |
 |
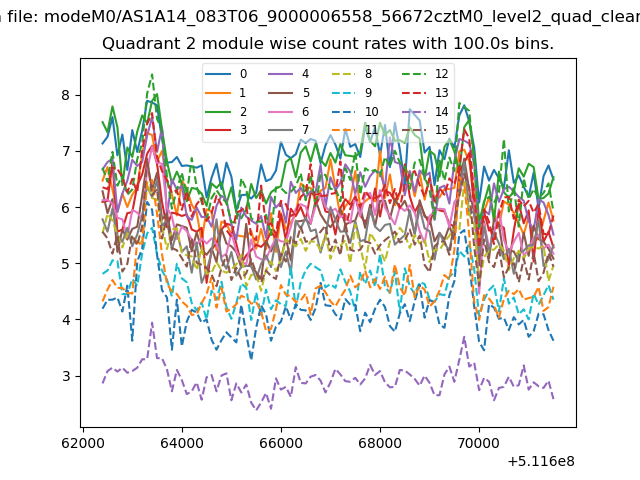
| Module-wise count rates for Quadrant B Data is divided into 100 sec bins |
 |
 |
| Module-wise count rates for Quadrant C Data is divided into 100 sec bins |
 |
 |
| Module-wise count rates for Quadrant D Data is divided into 100 sec bins |
 |
 |
| Parameter | Plot |
|---|---|
| CZT HV Monitor | 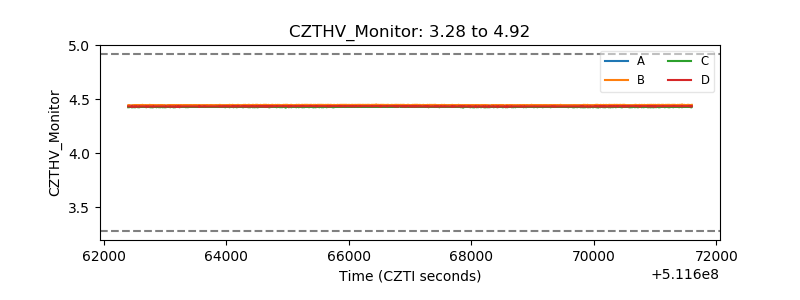 |
| D_VDD | 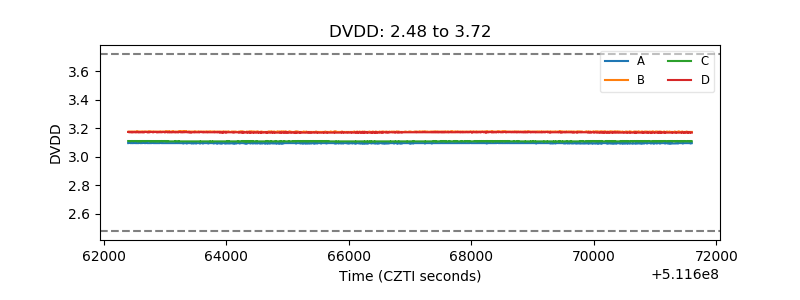 |
| Temperature 1 | 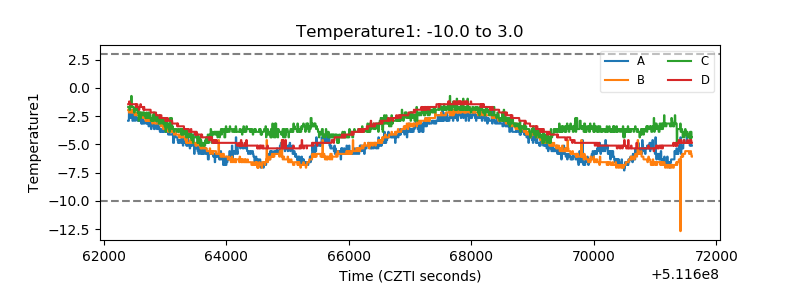 |
| Veto HV Monitor | 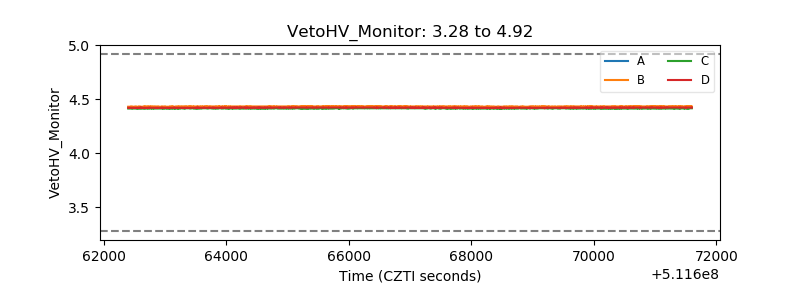 |
| Veto LLD | 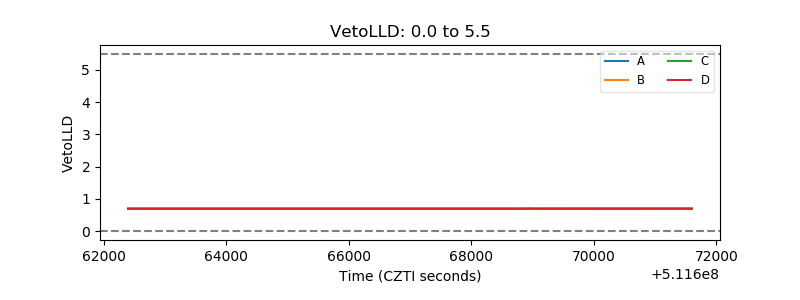 |
| Alpha Counter | 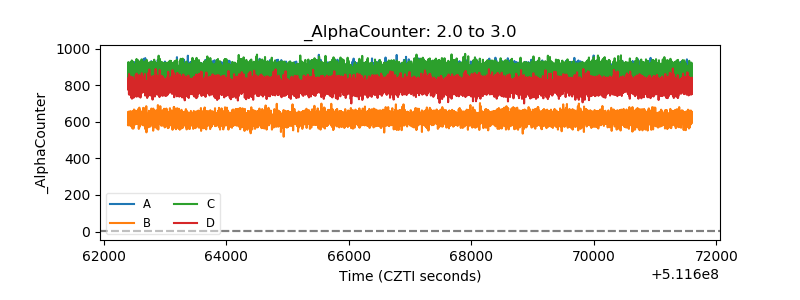 |
| _CPM_Rate | 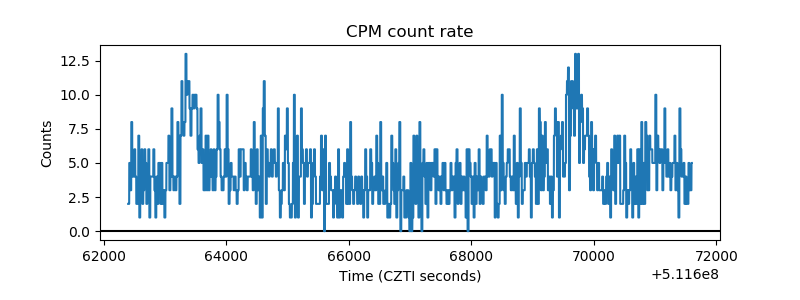 |
| CZT Counter | 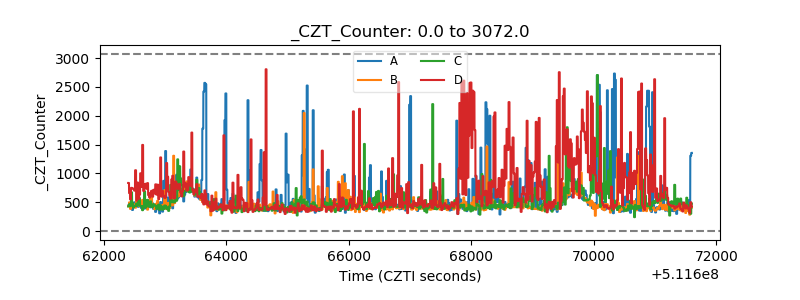 |
| +2.5 Volts monitor |  |
| +5 Volts monitor |  |
| _ROLL_ROT | 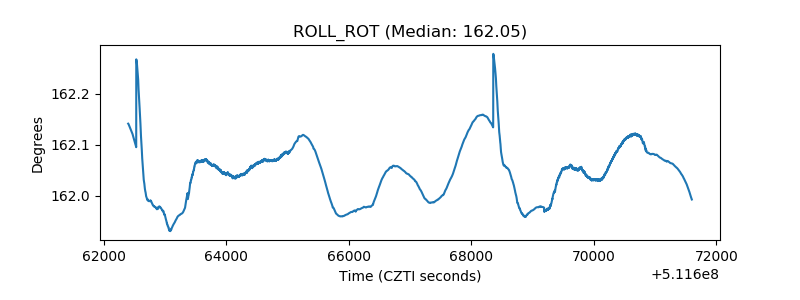 |
| _Roll_DEC | 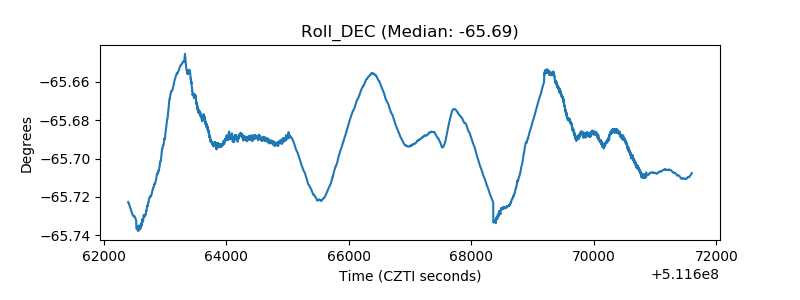 |
| _Roll_RA | 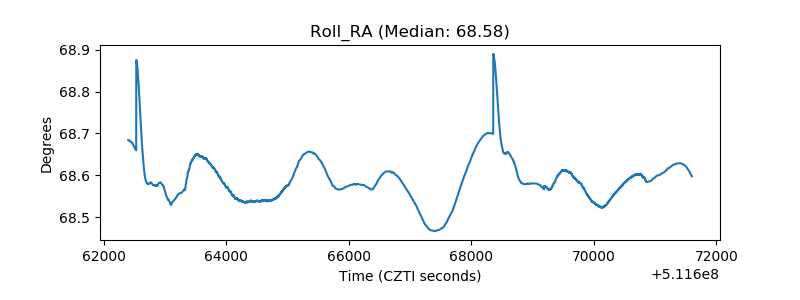 |
| Veto Counter | 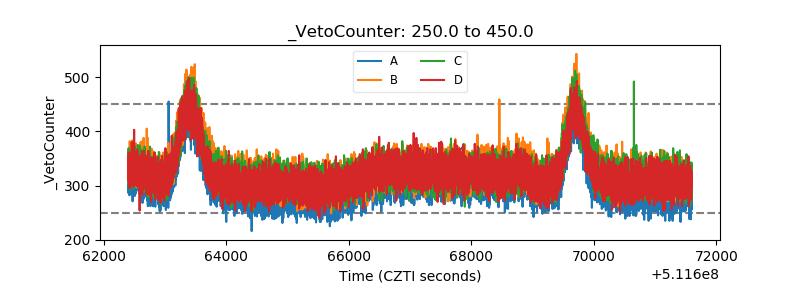 |