| Param | Original file | Final file |
|---|---|---|
| Filename | modeM0/AS1A14_083T06_9000006558_56675cztM0_level2.fits | modeM0/AS1A14_083T06_9000006558_56675cztM0_level2_quad_clean.evt |
| Size (bytes) | 1,366,968,960 | 262,961,280 |
| Size | 1.3 GB | 250.8 MB |
| Events in quadrant A | 11,909,247 | 1,708,052 |
| Events in quadrant B | 8,945,270 | 1,908,428 |
| Events in quadrant C | 13,325,869 | 1,606,024 |
| Events in quadrant D | 14,915,337 | 1,399,393 |
| Mode SS | |||
|---|---|---|---|
| Quadrant | BADHDUFLAG | Total packets | Discarded packets |
| A | 0 | 394 | 0 |
| B | 0 | 394 | 0 |
| C | 0 | 394 | 0 |
| D | 0 | 394 | 0 |
| Mode M9 | |||
|---|---|---|---|
| Quadrant | BADHDUFLAG | Total packets | Discarded packets |
| A | 0 | 8 | 0 |
| B | 0 | 8 | 0 |
| C | 0 | 8 | 0 |
| D | 0 | 8 | 0 |
| Mode M0 | |||
|---|---|---|---|
| Quadrant | BADHDUFLAG | Total packets | Discarded packets |
| A | 0 | 49241 | 4 |
| B | 0 | 40868 | 4 |
| C | 0 | 53255 | 4 |
| D | 0 | 57856 | 4 |
| Quadrant | Total seconds | Saturated seconds | Saturation percentage |
|---|---|---|---|
| A | 19439 | 1203 | 6.188590% |
| B | 19439 | 503 | 2.587582% |
| C | 19440 | 1209 | 6.219136% |
| D | 19440 | 1825 | 9.387860% |
Noise dominated data is calculated using 1-second bins in cleaned event files. If a bin has >2000 counts, and if more than 50% of those come from <1% of pixels, then it is considered to be noise-dominated and hence unusable.
| Quadrant | # 1 sec bins | Bins with >0 counts | Bins with >2000 counts | High rate bins dominated by noise | Noise dominated (total time) | Noise dominated (detector-on time) | Marked lightcurve |
|---|---|---|---|---|---|---|---|
| A | 20309 | 19443 | 791 | 791 | 3.89% | 4.07% | 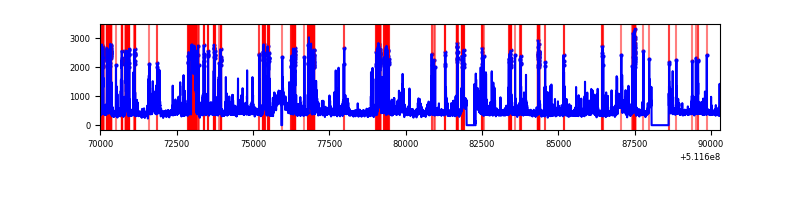 |
| B | 20309 | 19443 | 39 | 39 | 0.19% | 0.20% | 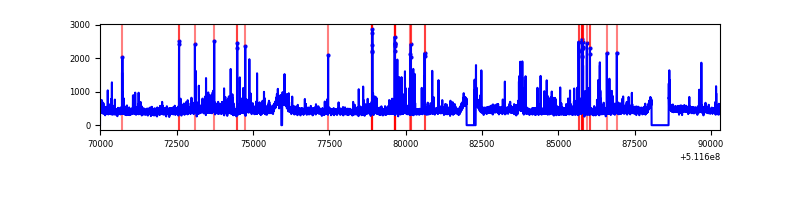 |
| C | 20310 | 19444 | 782 | 782 | 3.85% | 4.02% | 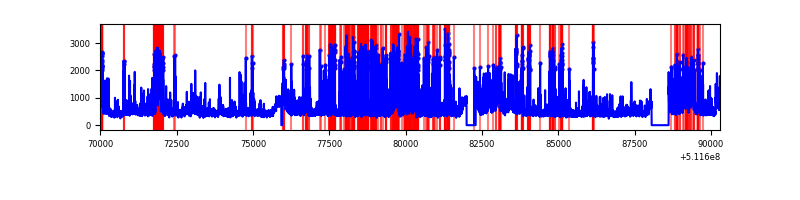 |
| D | 20310 | 19443 | 1662 | 1662 | 8.18% | 8.55% | 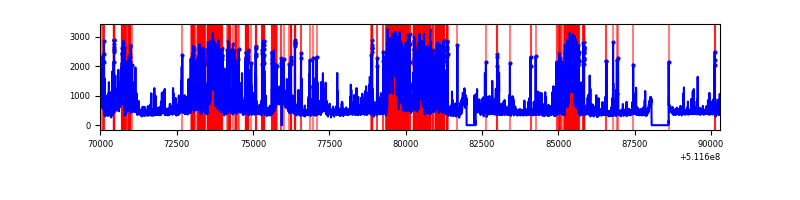 |
Top three noisy pixels from each quadrant. If the there are fewer than three noisy pixels in the level2.evt file, extra rows are filled as -1
| Pixel properties | Quadrant properties | ||||||
|---|---|---|---|---|---|---|---|
| Quadrant | DetID | PixID | Counts | Sigma | Mean | Median | Sigma |
| A | 8 | 26 | 2952706 | 5863.06 | 2057 | 2003 | 503.3 |
| A | 12 | 3 | 262541 | 517.69 | 2057 | 2003 | 503.3 |
| A | 0 | 8 | 193157 | 379.82 | 2057 | 2003 | 503.3 |
| B | 4 | 21 | 202623 | 453.73 | 2076 | 1992 | 442.2 |
| B | 0 | 245 | 138650 | 309.06 | 2076 | 1992 | 442.2 |
| B | 8 | 128 | 101822 | 225.77 | 2076 | 1992 | 442.2 |
| C | 12 | 252 | 2029594 | 3745.56 | 2008 | 1986 | 541.3 |
| C | 9 | 38 | 1233342 | 2274.66 | 2008 | 1986 | 541.3 |
| C | 15 | 148 | 635629 | 1170.52 | 2008 | 1986 | 541.3 |
| D | 2 | 249 | 3868898 | 7061.17 | 1967 | 1878 | 547.6 |
| D | 8 | 240 | 1530228 | 2790.77 | 1967 | 1878 | 547.6 |
| D | 7 | 96 | 539066 | 980.9 | 1967 | 1878 | 547.6 |
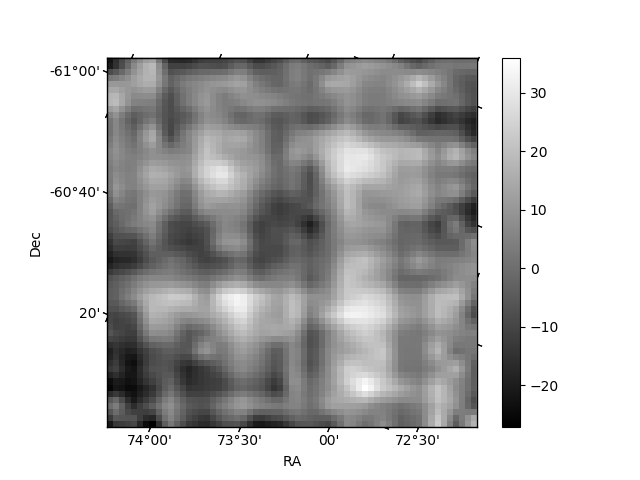
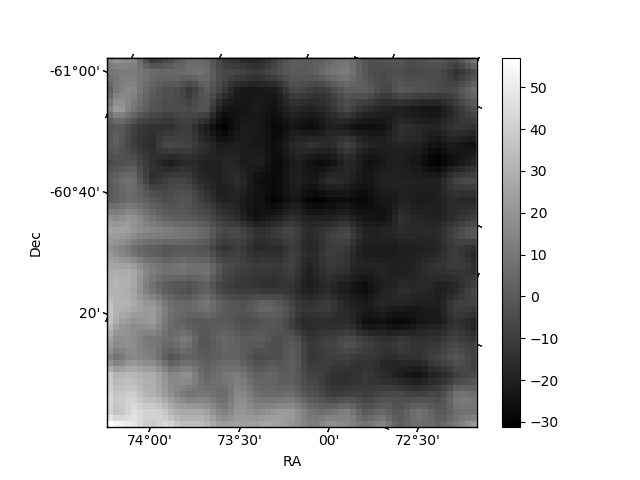
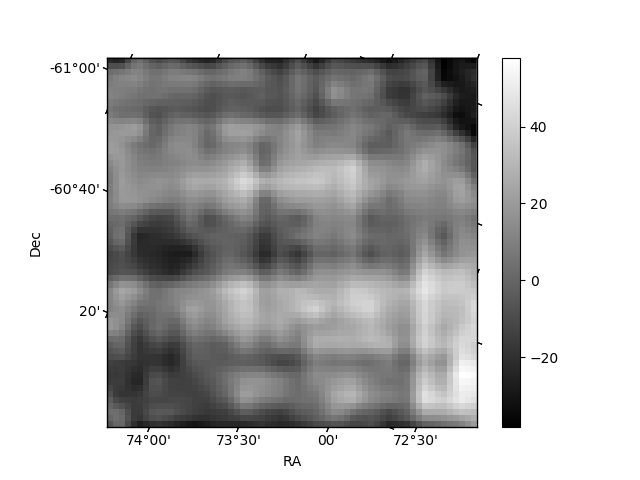
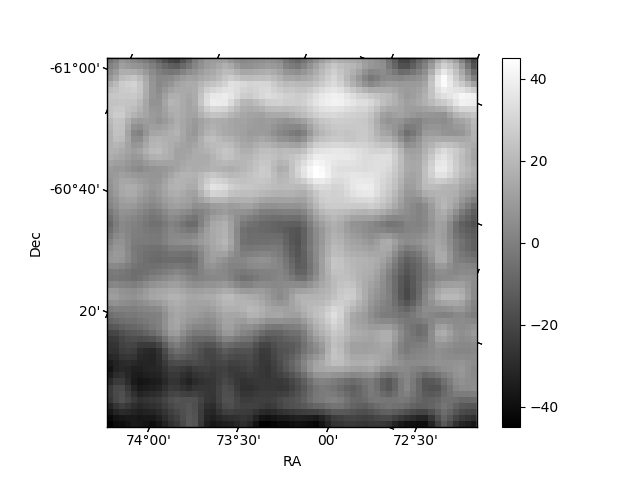
Histogram calculated using DETX and DETY for each event in the final _common_clean file
| Quadrant A | 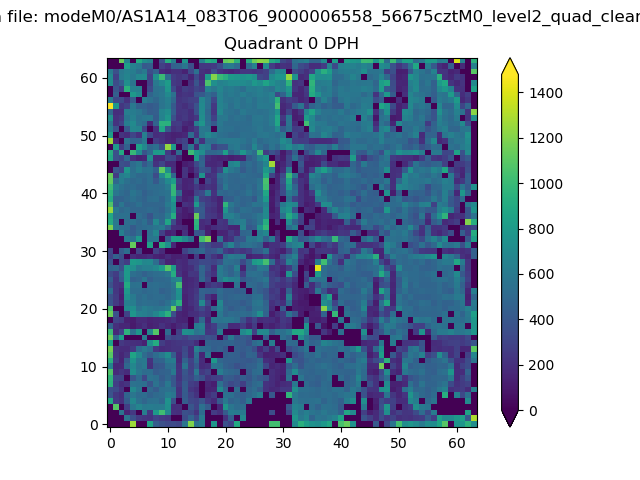 |
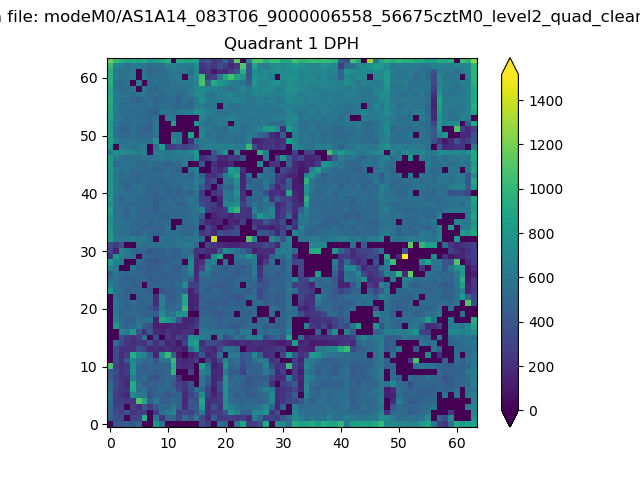 |
Quadrant B |
|---|---|---|---|
| Quadrant D | 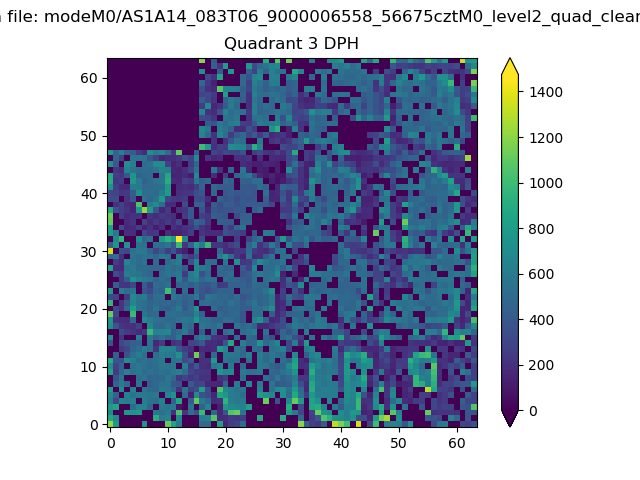 |
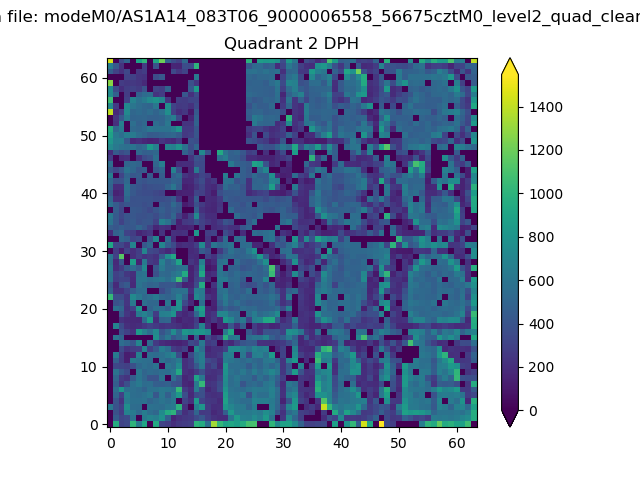 |
Quadrant C |
| Plot type | Count rate plots | Images |
|---|---|---|
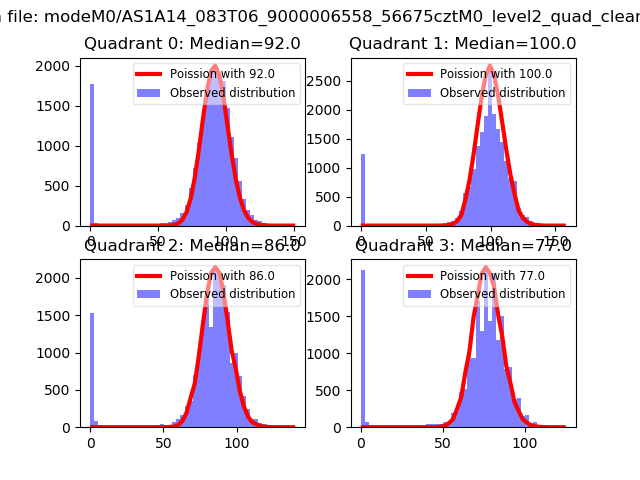
| Comparison with Poisson distribution Blue bars denote a histogram of data divided into 1 sec bins. Red curve is a Poisson curve with rate = median count rate of data. |
 |
 |
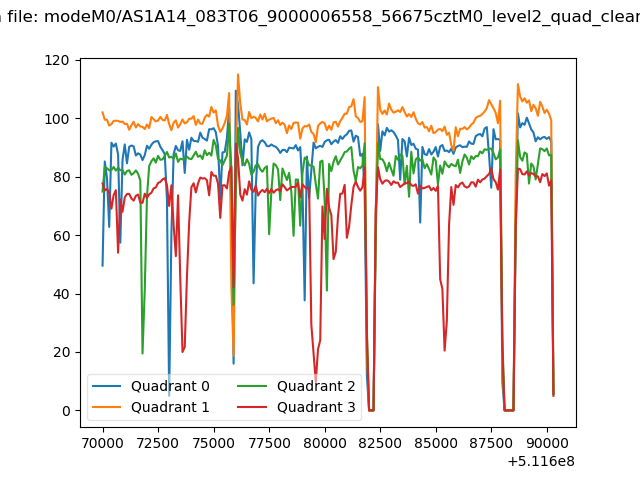
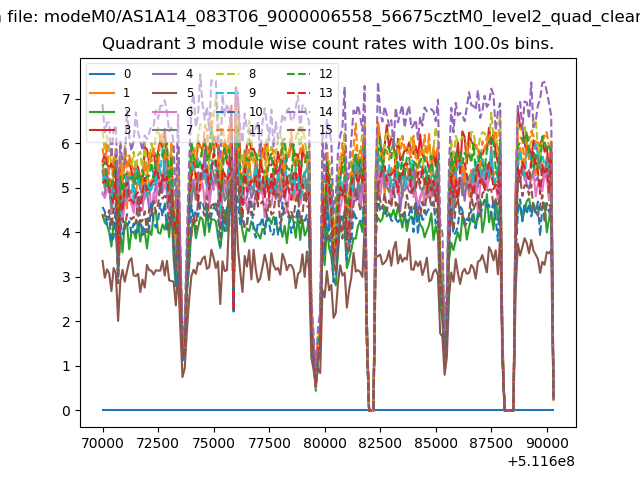
| Quadrant-wise count rates Data is divided into 100 sec bins |
 |
|
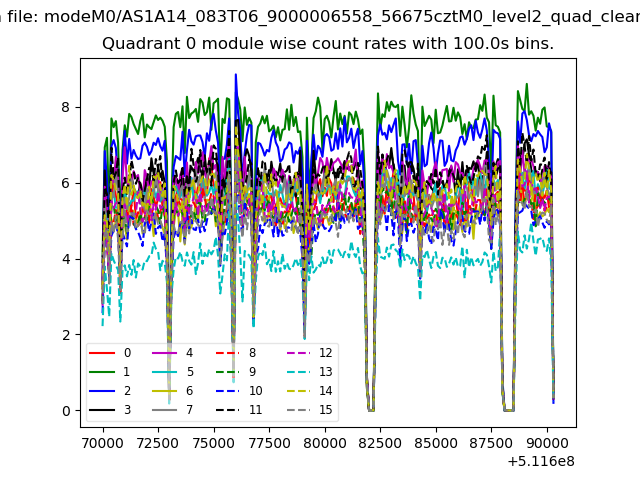
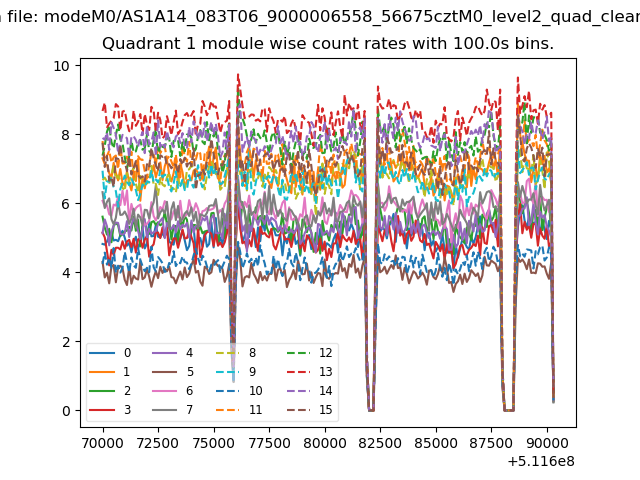
| Module-wise count rates for Quadrant A Data is divided into 100 sec bins |
 |
 |
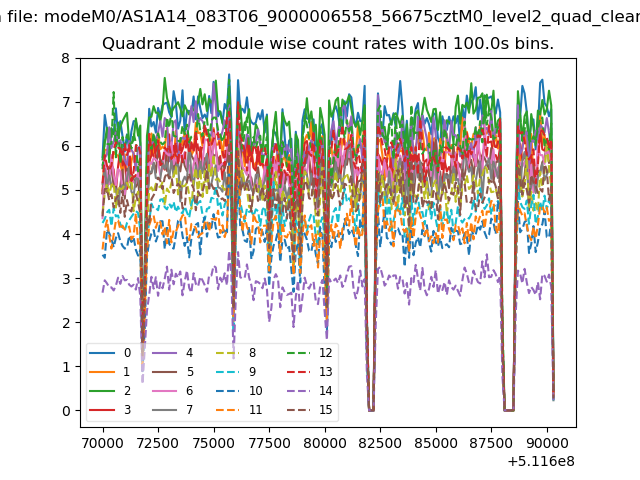
| Module-wise count rates for Quadrant B Data is divided into 100 sec bins |
 |
 |
| Module-wise count rates for Quadrant C Data is divided into 100 sec bins |
 |
 |
| Module-wise count rates for Quadrant D Data is divided into 100 sec bins |
 |
 |
| Parameter | Plot |
|---|---|
| CZT HV Monitor | 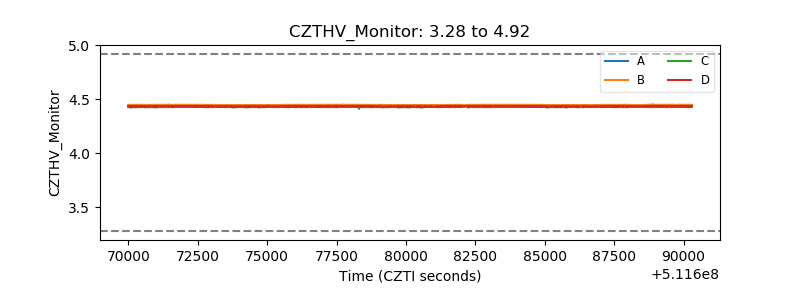 |
| D_VDD | 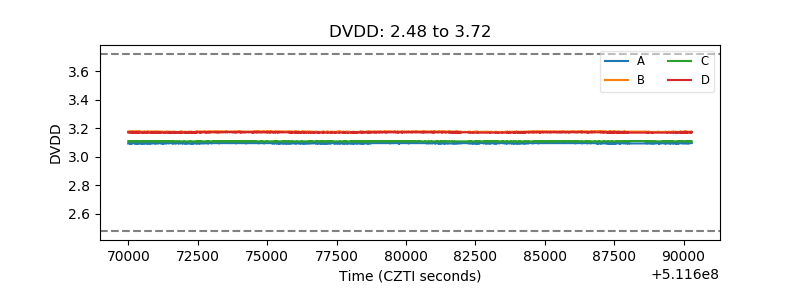 |
| Temperature 1 | 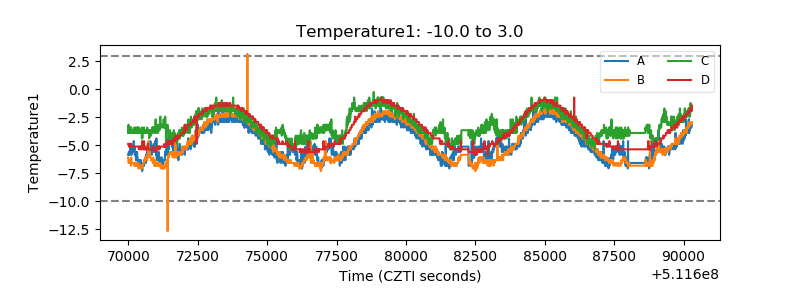 |
| Veto HV Monitor | 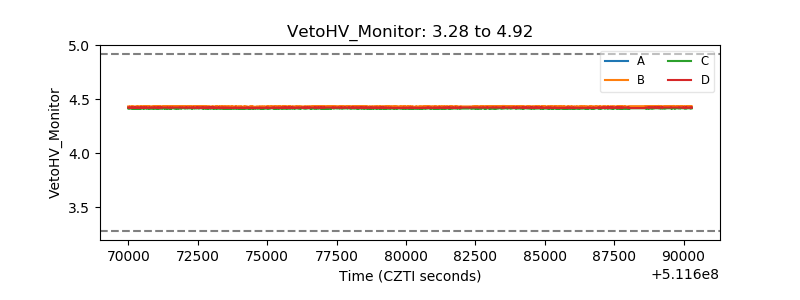 |
| Veto LLD | 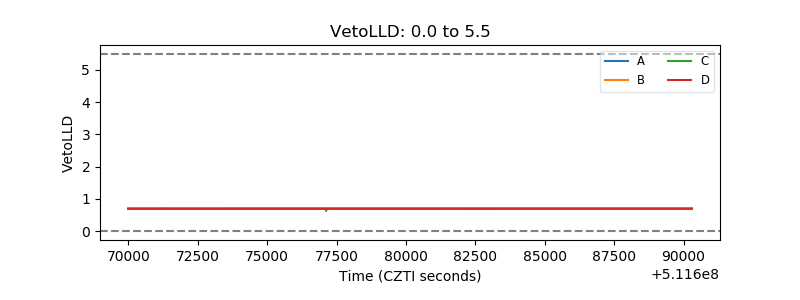 |
| Alpha Counter | 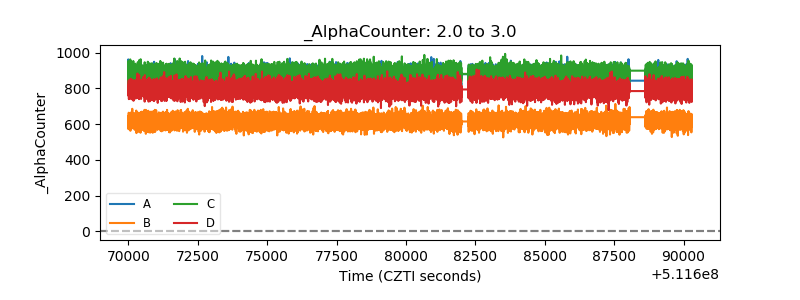 |
| _CPM_Rate | 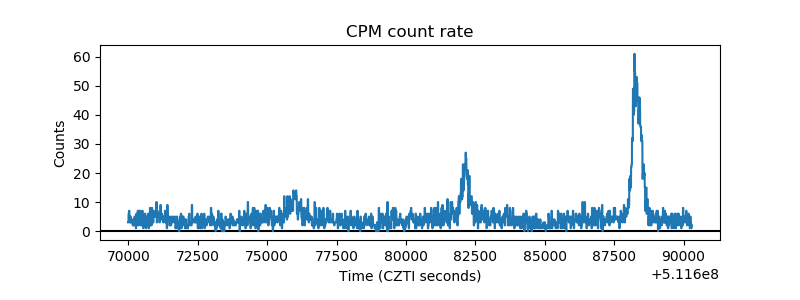 |
| CZT Counter | 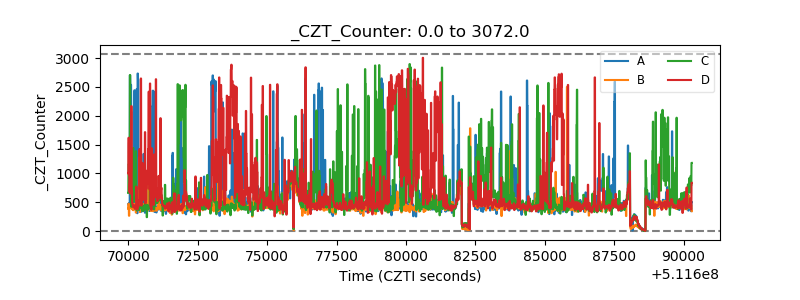 |
| +2.5 Volts monitor |  |
| +5 Volts monitor |  |
| _ROLL_ROT | 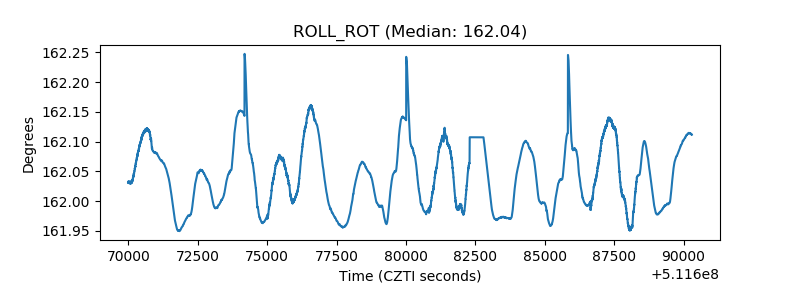 |
| _Roll_DEC | 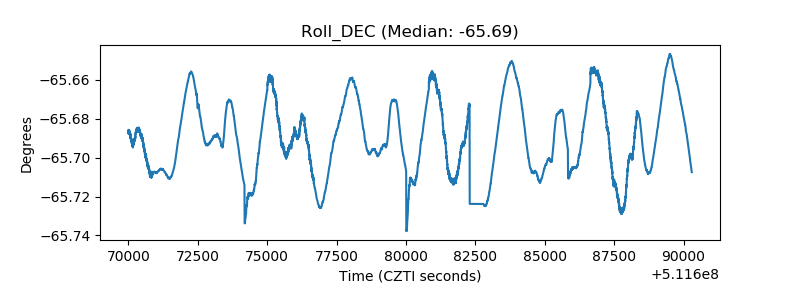 |
| _Roll_RA | 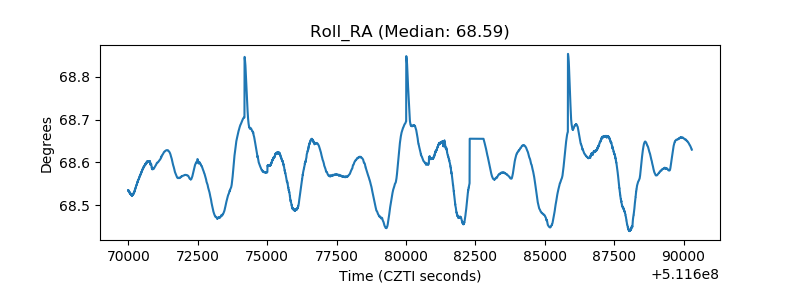 |
| Veto Counter | 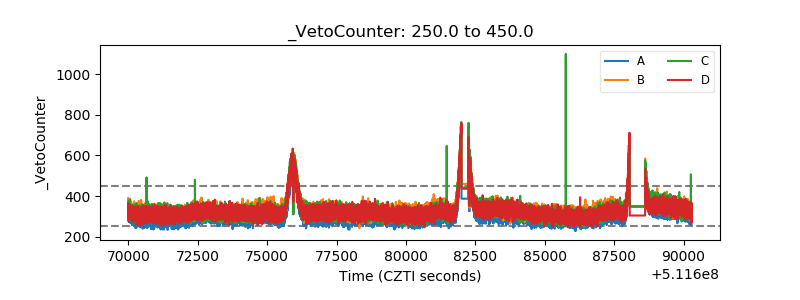 |