| Param | Original file | Final file |
|---|---|---|
| Filename | modeM0/AS1A14_083T06_9000006558_56676cztM0_level2.fits | modeM0/AS1A14_083T06_9000006558_56676cztM0_level2_quad_clean.evt |
| Size (bytes) | 538,565,760 | 87,462,720 |
| Size | 513.6 MB | 83.4 MB |
| Events in quadrant A | 3,726,745 | 601,613 |
| Events in quadrant B | 3,178,183 | 657,111 |
| Events in quadrant C | 8,663,751 | 401,980 |
| Events in quadrant D | 3,859,470 | 531,581 |
| Mode SS | |||
|---|---|---|---|
| Quadrant | BADHDUFLAG | Total packets | Discarded packets |
| A | 0 | 134 | 0 |
| B | 0 | 134 | 0 |
| C | 0 | 134 | 0 |
| D | 0 | 134 | 0 |
| Mode M9 | |||
|---|---|---|---|
| Quadrant | BADHDUFLAG | Total packets | Discarded packets |
| A | 0 | 7 | 0 |
| B | 0 | 7 | 0 |
| C | 0 | 7 | 0 |
| D | 0 | 7 | 0 |
| Mode M0 | |||
|---|---|---|---|
| Quadrant | BADHDUFLAG | Total packets | Discarded packets |
| A | 0 | 15565 | 1 |
| B | 0 | 13778 | 1 |
| C | 0 | 30378 | 1 |
| D | 0 | 15969 | 1 |
| Quadrant | Total seconds | Saturated seconds | Saturation percentage |
|---|---|---|---|
| A | 6529 | 194 | 2.971359% |
| B | 6529 | 84 | 1.286568% |
| C | 6530 | 2210 | 33.843798% |
| D | 6530 | 265 | 4.058193% |
Noise dominated data is calculated using 1-second bins in cleaned event files. If a bin has >2000 counts, and if more than 50% of those come from <1% of pixels, then it is considered to be noise-dominated and hence unusable.
| Quadrant | # 1 sec bins | Bins with >0 counts | Bins with >2000 counts | High rate bins dominated by noise | Noise dominated (total time) | Noise dominated (detector-on time) | Marked lightcurve |
|---|---|---|---|---|---|---|---|
| A | 7279 | 6530 | 123 | 123 | 1.69% | 1.88% | 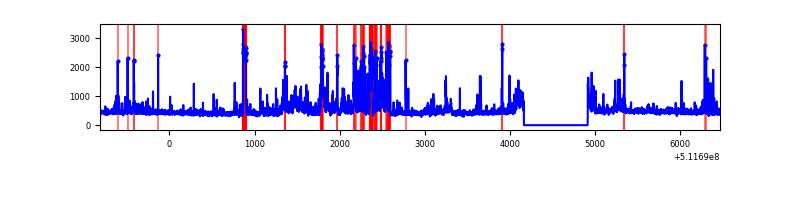 |
| B | 7279 | 6530 | 9 | 9 | 0.12% | 0.14% | 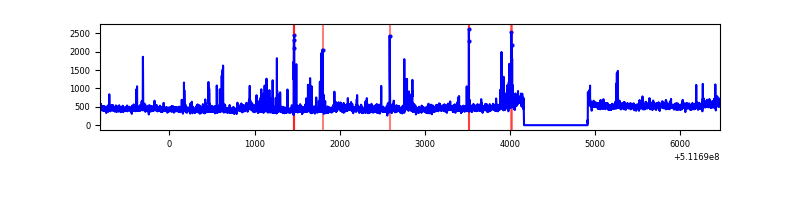 |
| C | 7280 | 6531 | 2058 | 2058 | 28.27% | 31.51% | 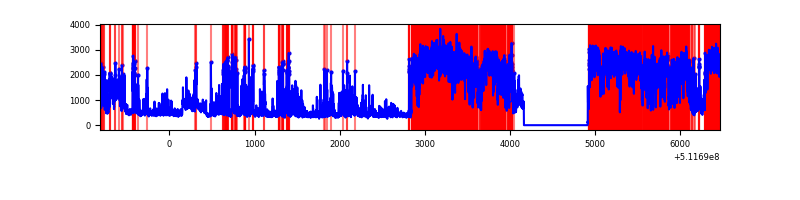 |
| D | 7280 | 6531 | 202 | 202 | 2.77% | 3.09% | 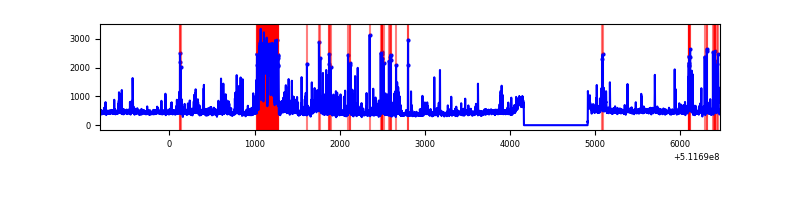 |
Top three noisy pixels from each quadrant. If the there are fewer than three noisy pixels in the level2.evt file, extra rows are filled as -1
| Pixel properties | Quadrant properties | ||||||
|---|---|---|---|---|---|---|---|
| Quadrant | DetID | PixID | Counts | Sigma | Mean | Median | Sigma |
| A | 8 | 26 | 569691 | 3286.01 | 700 | 682 | 173.2 |
| A | 8 | 249 | 115103 | 660.78 | 700 | 682 | 173.2 |
| A | 10 | 251 | 109988 | 631.24 | 700 | 682 | 173.2 |
| B | 7 | 0 | 148799 | 986.55 | 696 | 670 | 150.1 |
| B | 4 | 21 | 55521 | 365.31 | 696 | 670 | 150.1 |
| B | 10 | 247 | 47136 | 309.47 | 696 | 670 | 150.1 |
| C | 15 | 230 | 5005000 | 32317.42 | 570 | 564 | 154.9 |
| C | 6 | 223 | 786806 | 5077.36 | 570 | 564 | 154.9 |
| C | 9 | 38 | 390107 | 2515.57 | 570 | 564 | 154.9 |
| D | 2 | 249 | 638238 | 3327.22 | 676 | 646 | 191.6 |
| D | 13 | 153 | 134131 | 696.58 | 676 | 646 | 191.6 |
| D | 3 | 12 | 102550 | 531.78 | 676 | 646 | 191.6 |
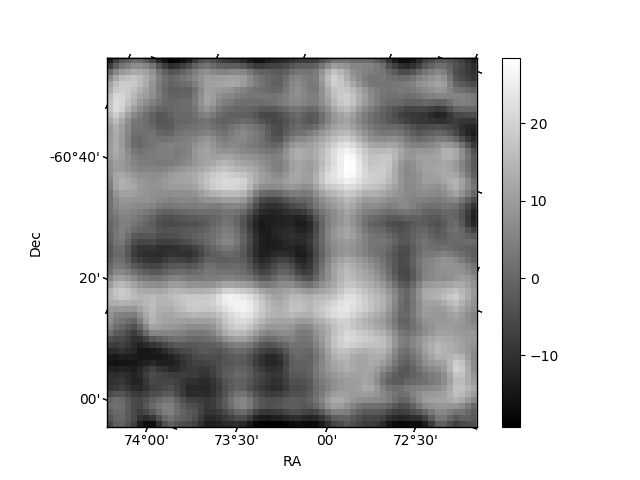
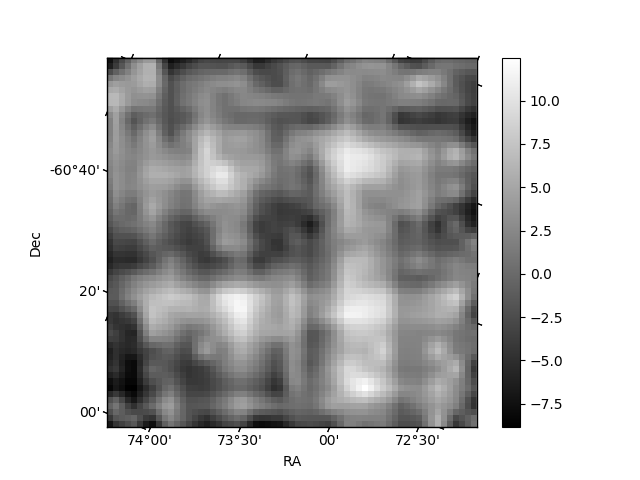
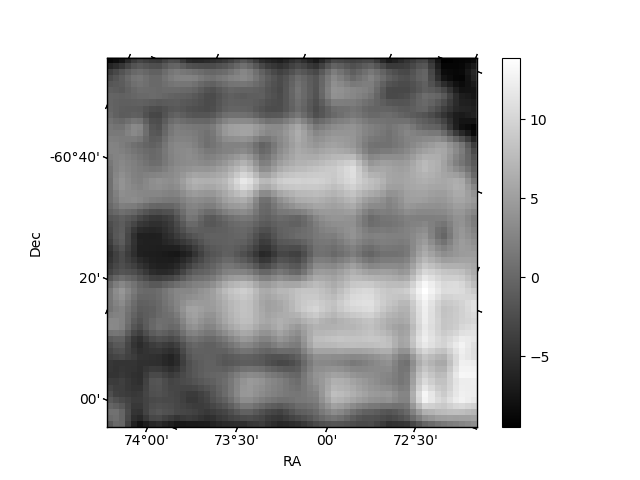
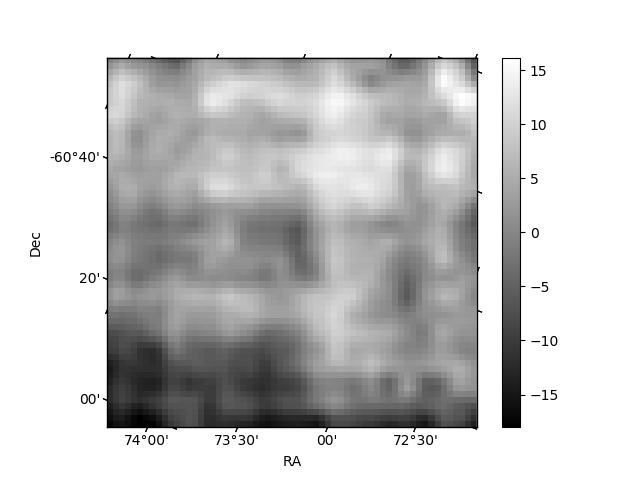
Histogram calculated using DETX and DETY for each event in the final _common_clean file
| Quadrant A | 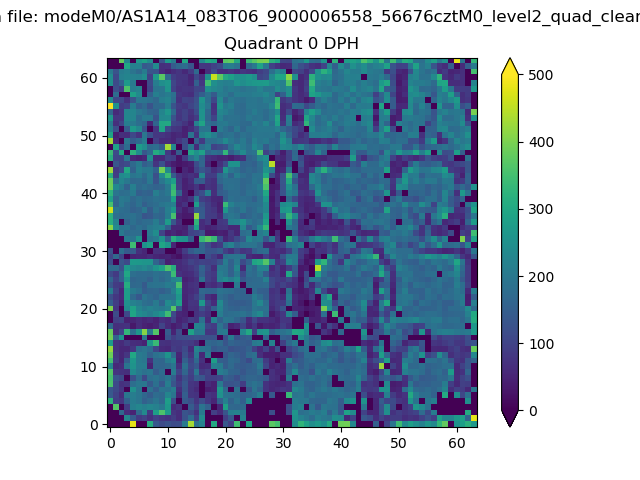 |
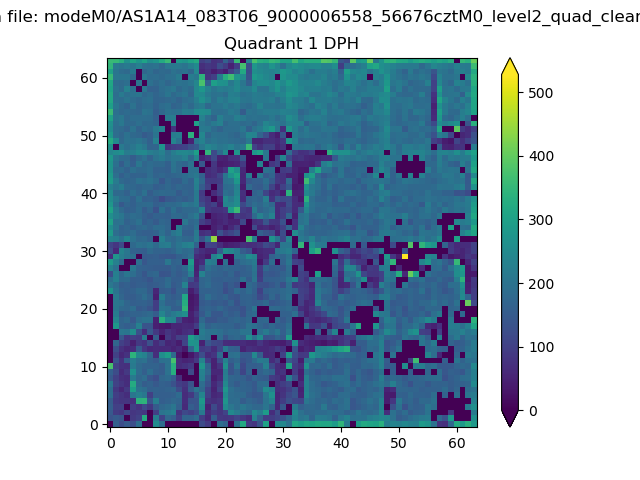 |
Quadrant B |
|---|---|---|---|
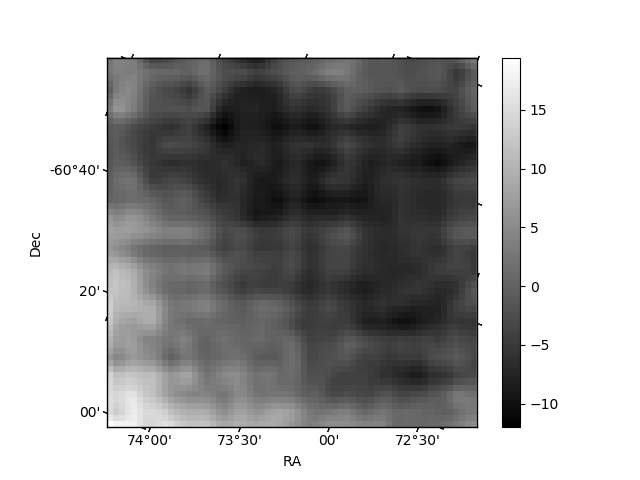
| Quadrant D | 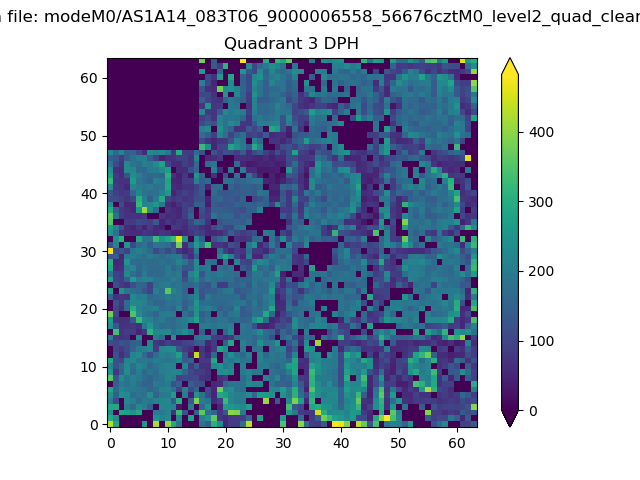 |
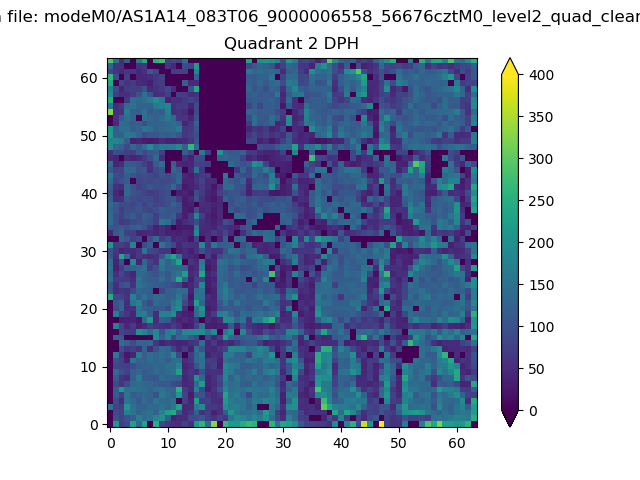 |
Quadrant C |
| Plot type | Count rate plots | Images |
|---|---|---|
| Comparison with Poisson distribution Blue bars denote a histogram of data divided into 1 sec bins. Red curve is a Poisson curve with rate = median count rate of data. |
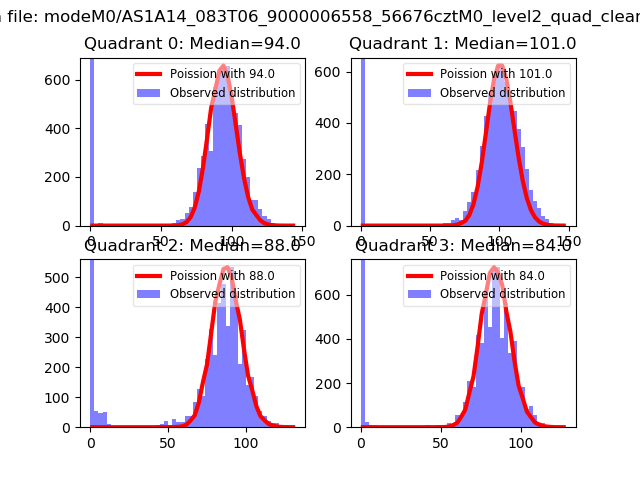 |
 |
| Quadrant-wise count rates Data is divided into 100 sec bins |
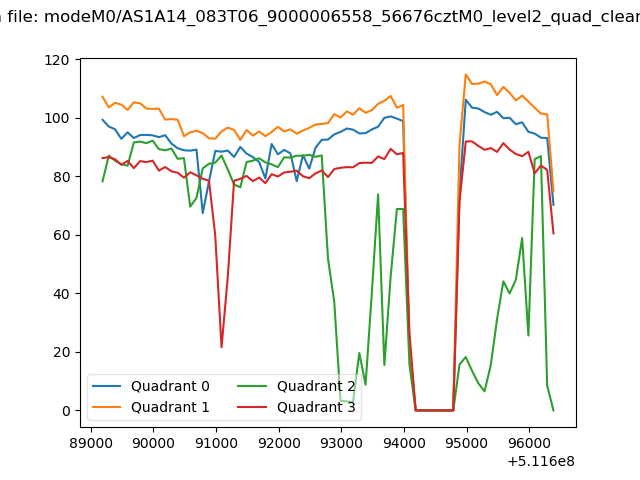 |
|
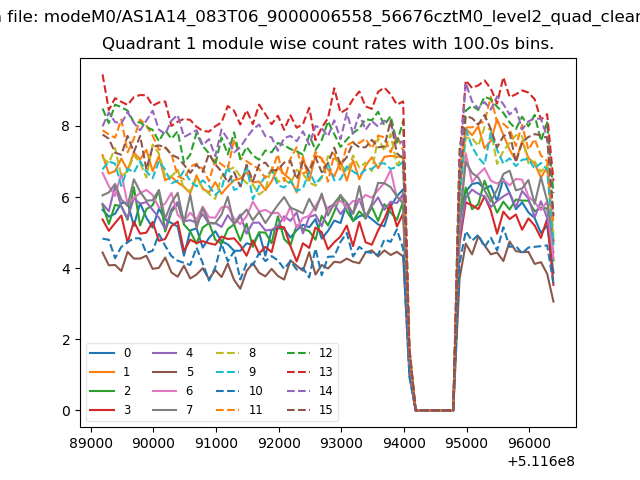
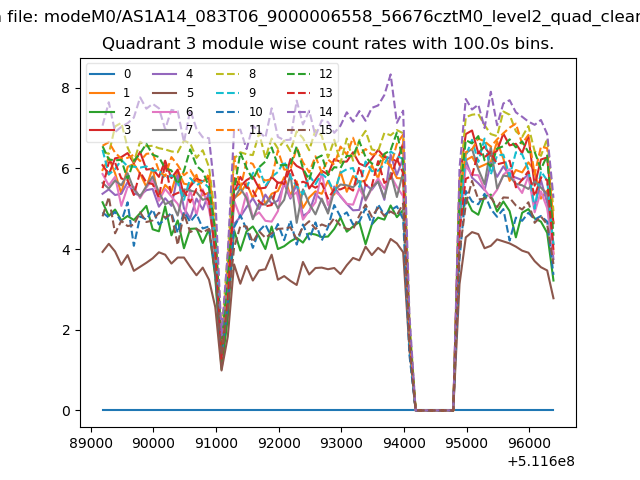
| Module-wise count rates for Quadrant A Data is divided into 100 sec bins |
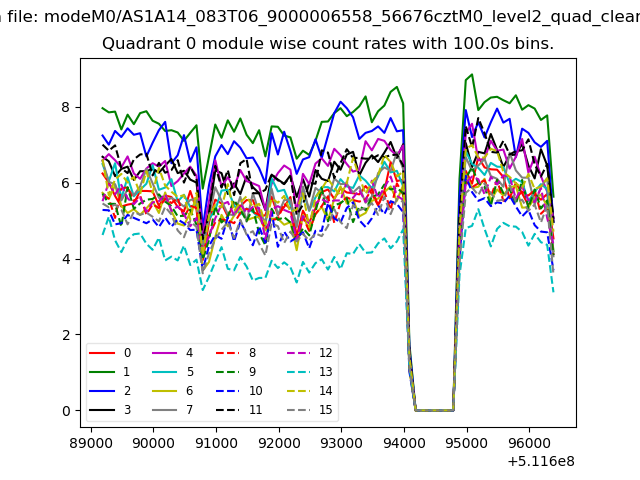 |
 |
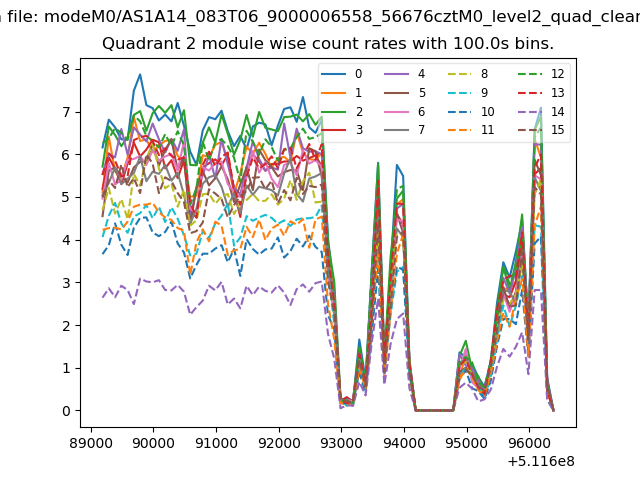
| Module-wise count rates for Quadrant B Data is divided into 100 sec bins |
 |
 |
| Module-wise count rates for Quadrant C Data is divided into 100 sec bins |
 |
 |
| Module-wise count rates for Quadrant D Data is divided into 100 sec bins |
 |
 |
| Parameter | Plot |
|---|---|
| CZT HV Monitor | 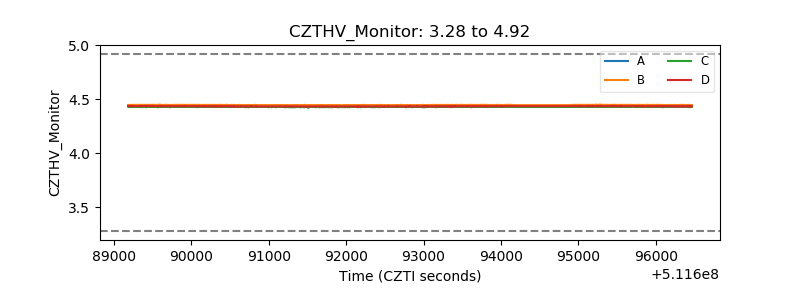 |
| D_VDD | 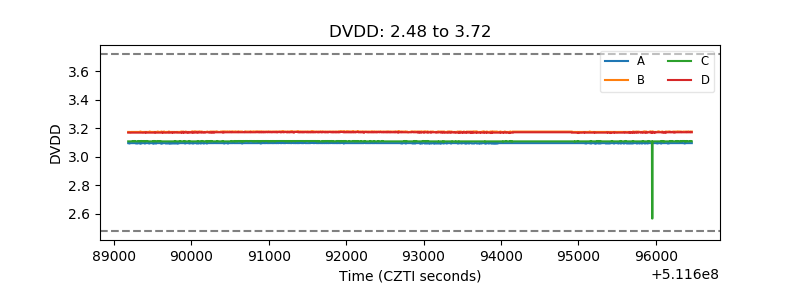 |
| Temperature 1 | 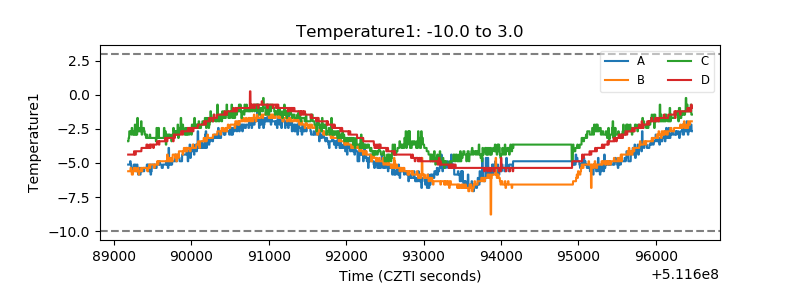 |
| Veto HV Monitor | 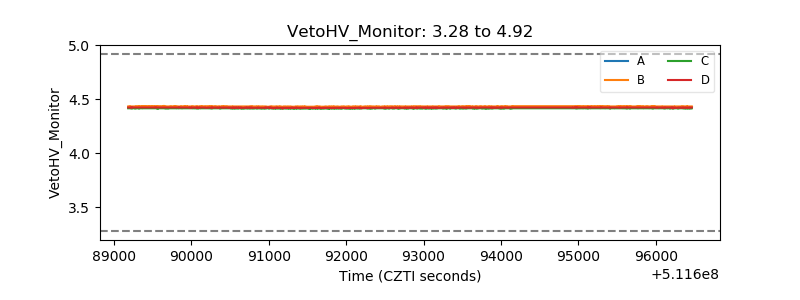 |
| Veto LLD | 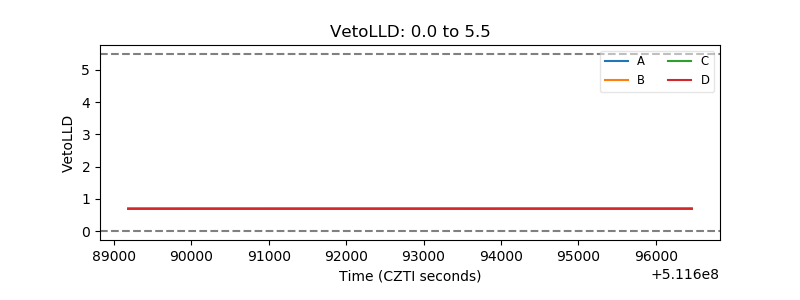 |
| Alpha Counter | 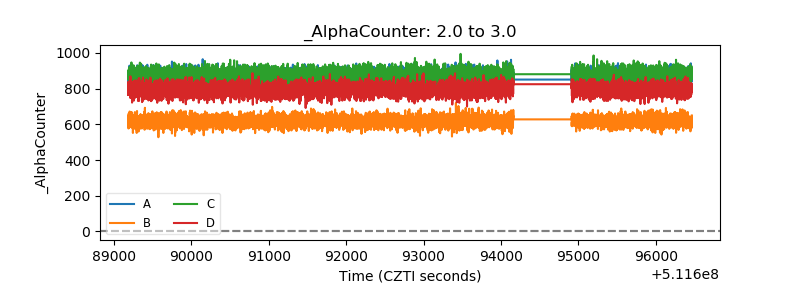 |
| _CPM_Rate | 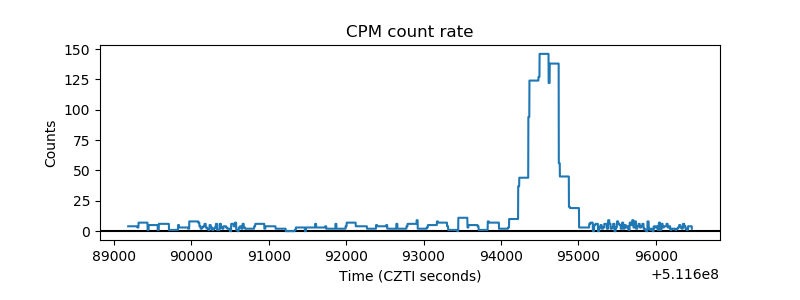 |
| CZT Counter | 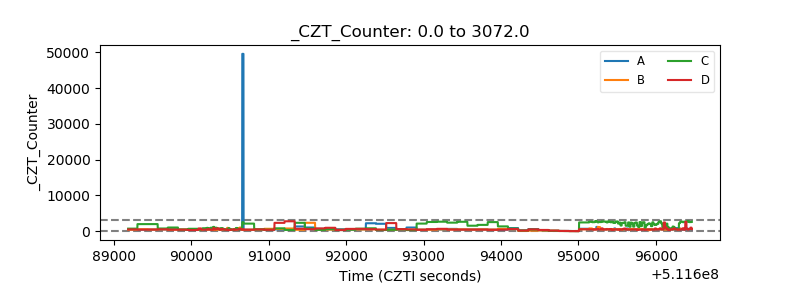 |
| +2.5 Volts monitor |  |
| +5 Volts monitor |  |
| _ROLL_ROT | 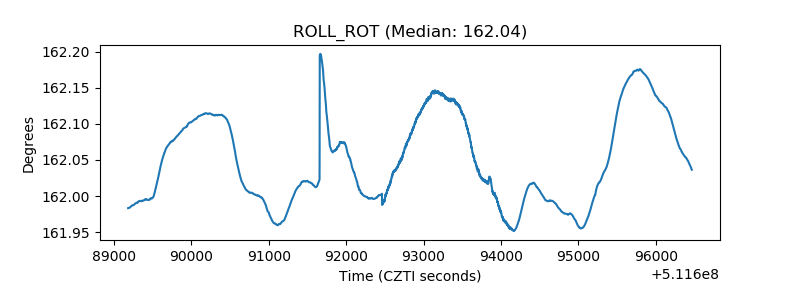 |
| _Roll_DEC | 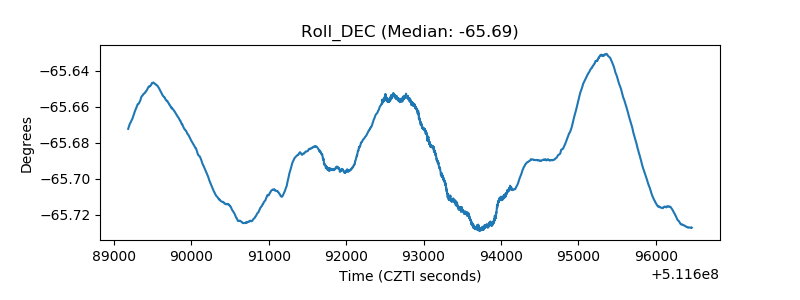 |
| _Roll_RA | 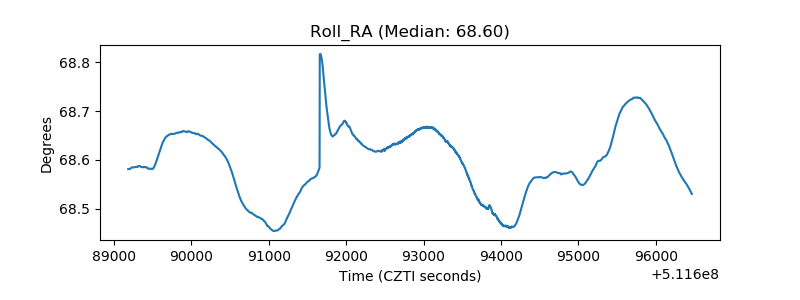 |
| Veto Counter | 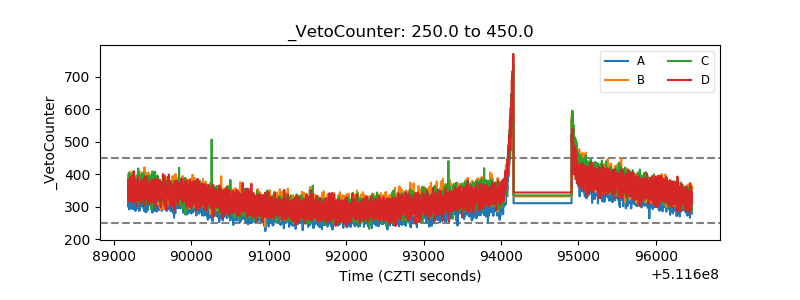 |