| Param | Original file | Final file |
|---|---|---|
| Filename | modeM0/AS1A14_083T06_9000006558_56677cztM0_level2.fits | modeM0/AS1A14_083T06_9000006558_56677cztM0_level2_quad_clean.evt |
| Size (bytes) | 592,027,200 | 91,906,560 |
| Size | 564.6 MB | 87.6 MB |
| Events in quadrant A | 4,074,194 | 624,152 |
| Events in quadrant B | 3,433,684 | 689,681 |
| Events in quadrant C | 9,375,452 | 433,674 |
| Events in quadrant D | 4,507,235 | 564,554 |
| Mode SS | |||
|---|---|---|---|
| Quadrant | BADHDUFLAG | Total packets | Discarded packets |
| A | 0 | 136 | 0 |
| B | 0 | 136 | 0 |
| C | 0 | 136 | 0 |
| D | 0 | 136 | 0 |
| Mode M9 | |||
|---|---|---|---|
| Quadrant | BADHDUFLAG | Total packets | Discarded packets |
| A | 0 | 10 | 0 |
| B | 0 | 10 | 0 |
| C | 0 | 10 | 0 |
| D | 0 | 10 | 0 |
| Mode M0 | |||
|---|---|---|---|
| Quadrant | BADHDUFLAG | Total packets | Discarded packets |
| A | 0 | 16837 | 1 |
| B | 0 | 14394 | 1 |
| C | 0 | 32532 | 1 |
| D | 0 | 17975 | 1 |
| Quadrant | Total seconds | Saturated seconds | Saturation percentage |
|---|---|---|---|
| A | 6756 | 280 | 4.144464% |
| B | 6756 | 65 | 0.962108% |
| C | 6756 | 2270 | 33.599763% |
| D | 6756 | 276 | 4.085258% |
Noise dominated data is calculated using 1-second bins in cleaned event files. If a bin has >2000 counts, and if more than 50% of those come from <1% of pixels, then it is considered to be noise-dominated and hence unusable.
| Quadrant | # 1 sec bins | Bins with >0 counts | Bins with >2000 counts | High rate bins dominated by noise | Noise dominated (total time) | Noise dominated (detector-on time) | Marked lightcurve |
|---|---|---|---|---|---|---|---|
| A | 7686 | 6757 | 223 | 223 | 2.90% | 3.30% | 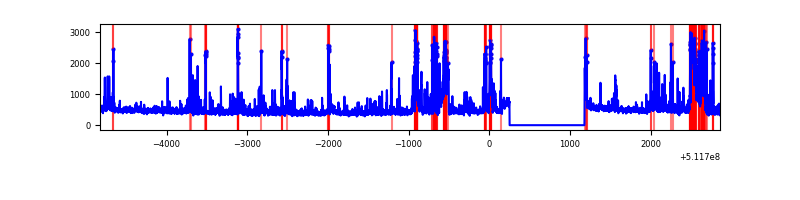 |
| B | 7686 | 6757 | 14 | 14 | 0.18% | 0.21% | 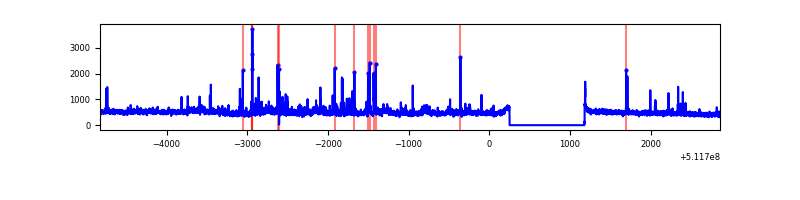 |
| C | 7686 | 6757 | 2340 | 2340 | 30.44% | 34.63% | 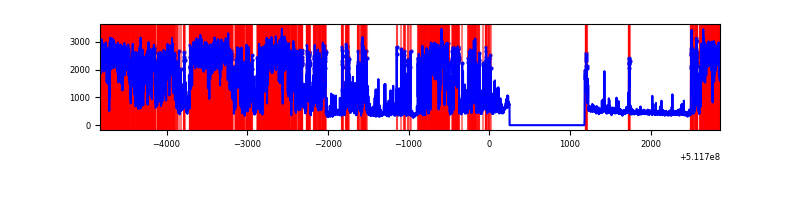 |
| D | 7686 | 6757 | 286 | 286 | 3.72% | 4.23% | 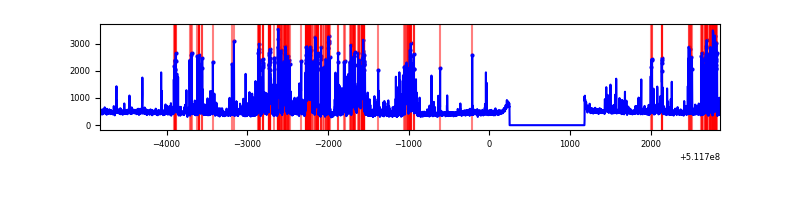 |
Top three noisy pixels from each quadrant. If the there are fewer than three noisy pixels in the level2.evt file, extra rows are filled as -1
| Pixel properties | Quadrant properties | ||||||
|---|---|---|---|---|---|---|---|
| Quadrant | DetID | PixID | Counts | Sigma | Mean | Median | Sigma |
| A | 8 | 26 | 563033 | 3167.43 | 721 | 701 | 177.5 |
| A | 3 | 14 | 381648 | 2145.75 | 721 | 701 | 177.5 |
| A | 8 | 249 | 92003 | 514.27 | 721 | 701 | 177.5 |
| B | 7 | 0 | 286800 | 1872.34 | 718 | 691 | 152.8 |
| B | 4 | 21 | 102521 | 666.39 | 718 | 691 | 152.8 |
| B | 10 | 247 | 70274 | 455.36 | 718 | 691 | 152.8 |
| C | 15 | 230 | 5802097 | 35137.94 | 600 | 592 | 165.1 |
| C | 6 | 223 | 790686 | 4785.36 | 600 | 592 | 165.1 |
| C | 9 | 38 | 206244 | 1245.57 | 600 | 592 | 165.1 |
| D | 2 | 249 | 654638 | 3344.07 | 699 | 669 | 195.6 |
| D | 6 | 239 | 388877 | 1985.1 | 699 | 669 | 195.6 |
| D | 13 | 153 | 209982 | 1070.32 | 699 | 669 | 195.6 |
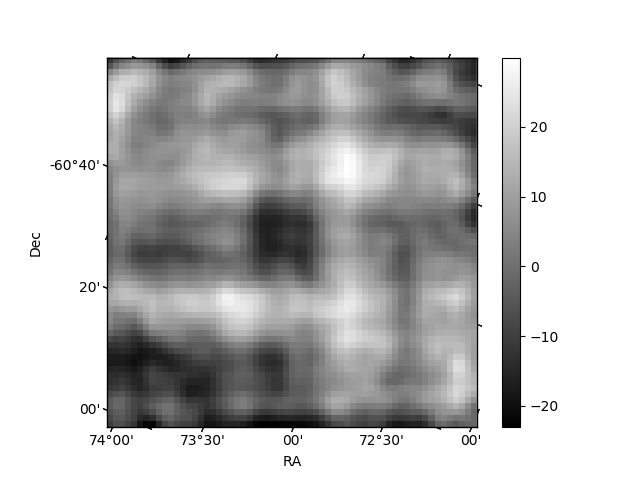
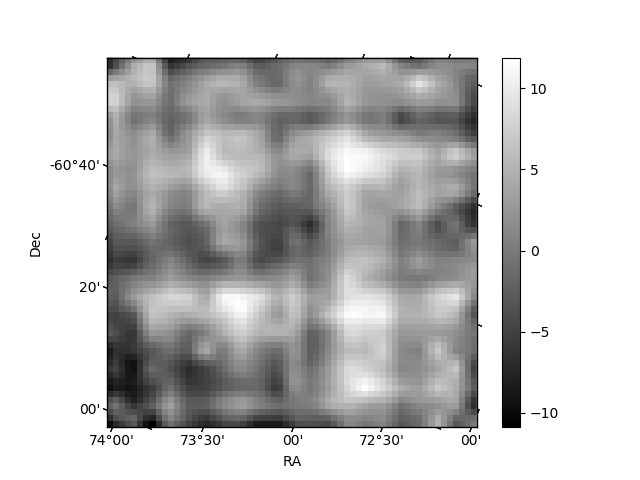
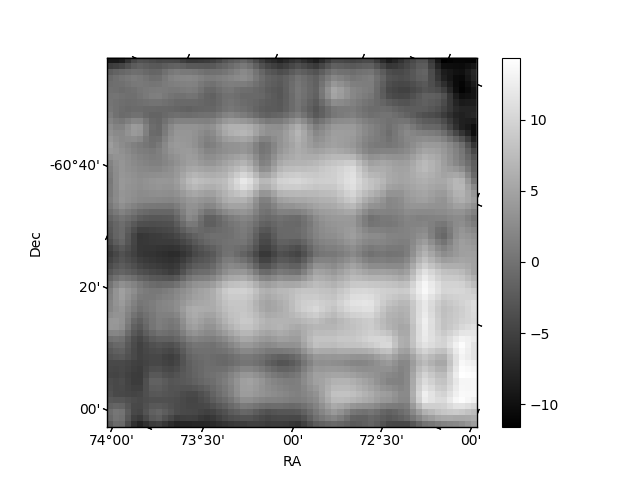
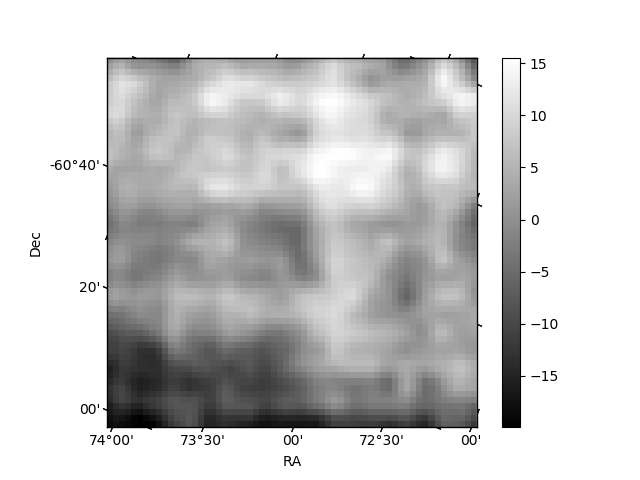
Histogram calculated using DETX and DETY for each event in the final _common_clean file
| Quadrant A | 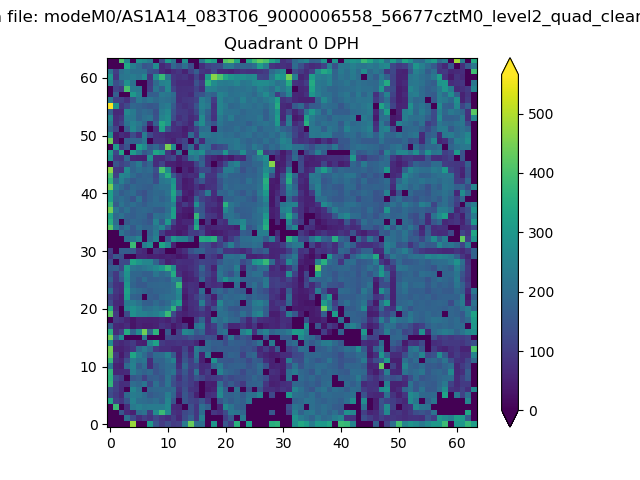 |
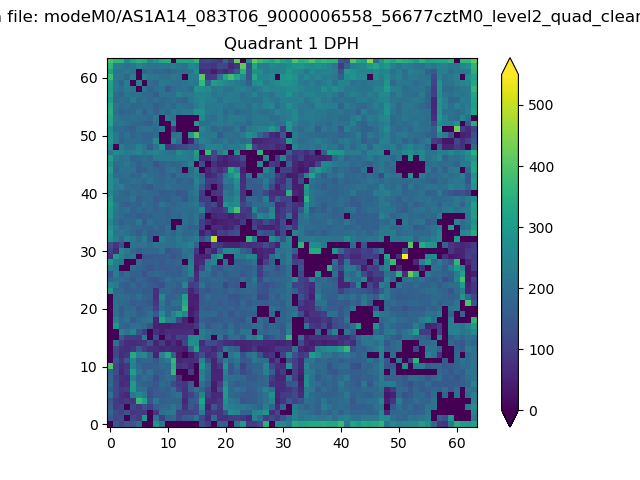 |
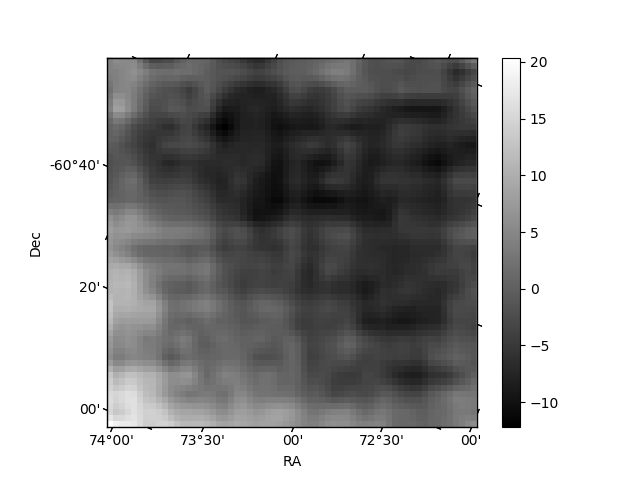
Quadrant B |
|---|---|---|---|
| Quadrant D | 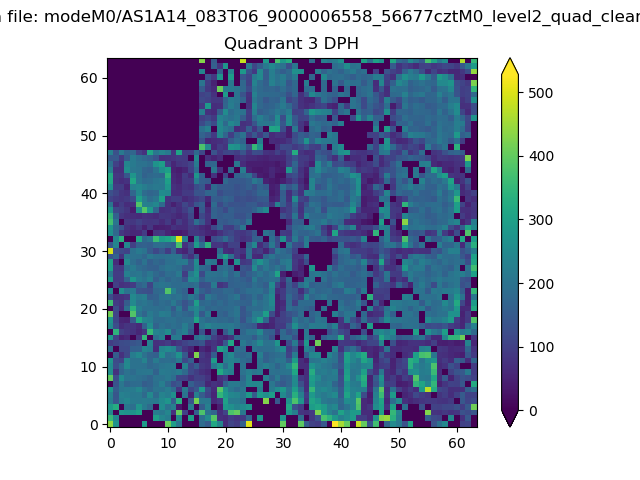 |
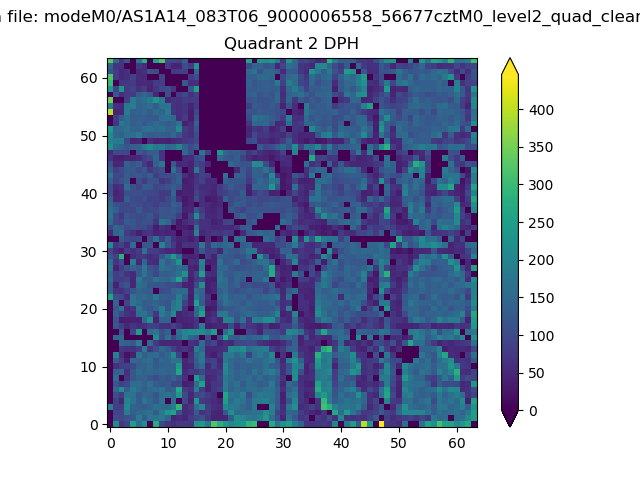 |
Quadrant C |
| Plot type | Count rate plots | Images |
|---|---|---|
| Comparison with Poisson distribution Blue bars denote a histogram of data divided into 1 sec bins. Red curve is a Poisson curve with rate = median count rate of data. |
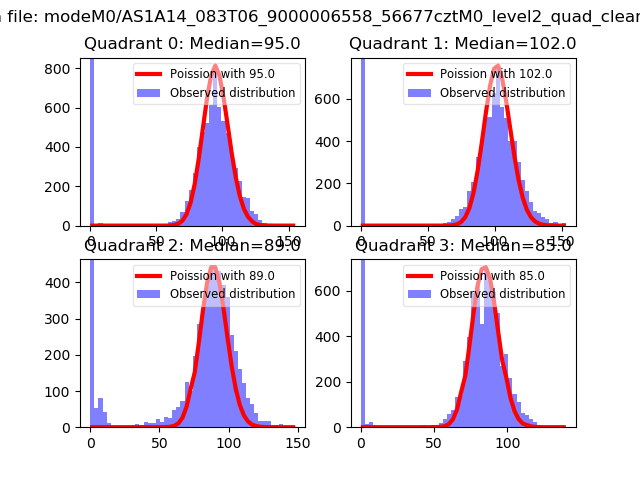 |
 |
| Quadrant-wise count rates Data is divided into 100 sec bins |
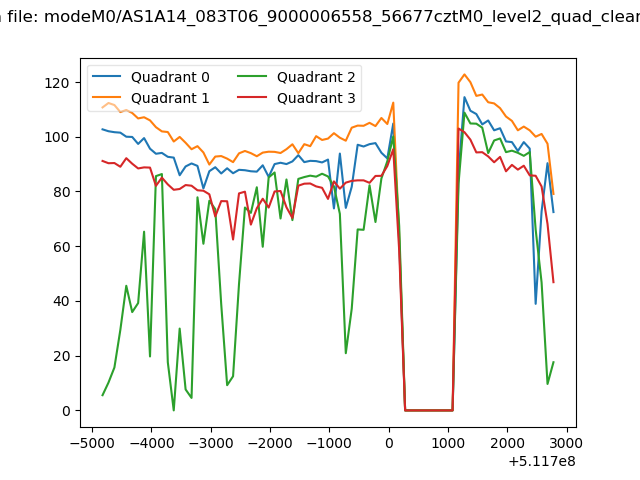 |
|
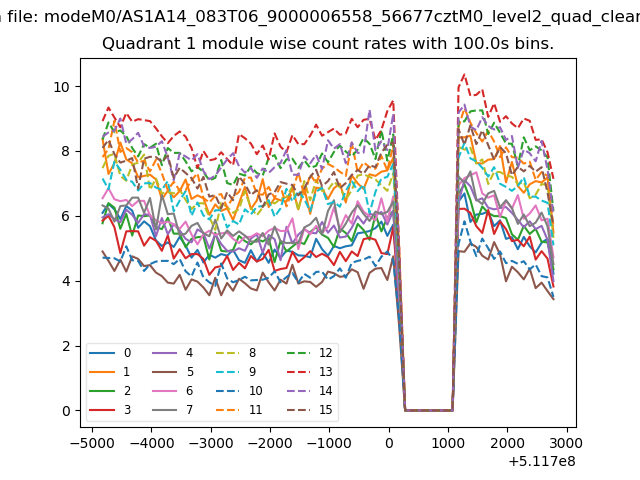
| Module-wise count rates for Quadrant A Data is divided into 100 sec bins |
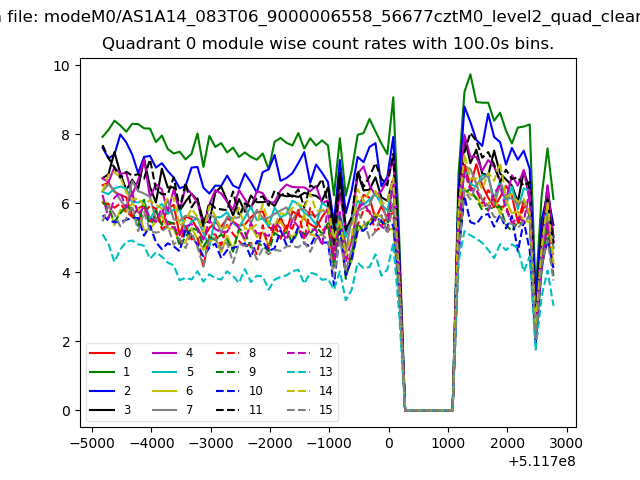 |
 |
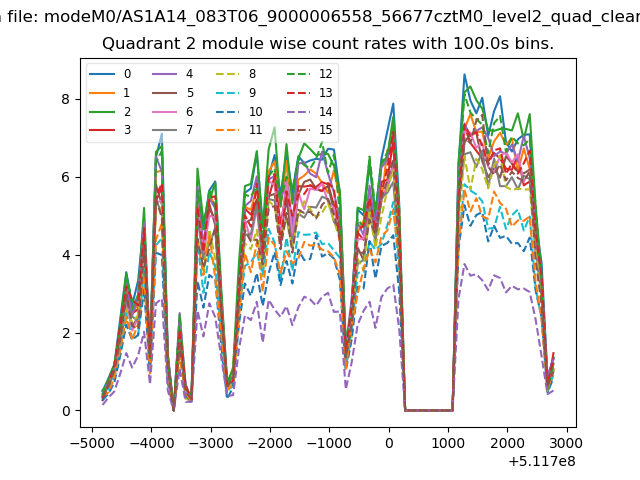
| Module-wise count rates for Quadrant B Data is divided into 100 sec bins |
 |
 |
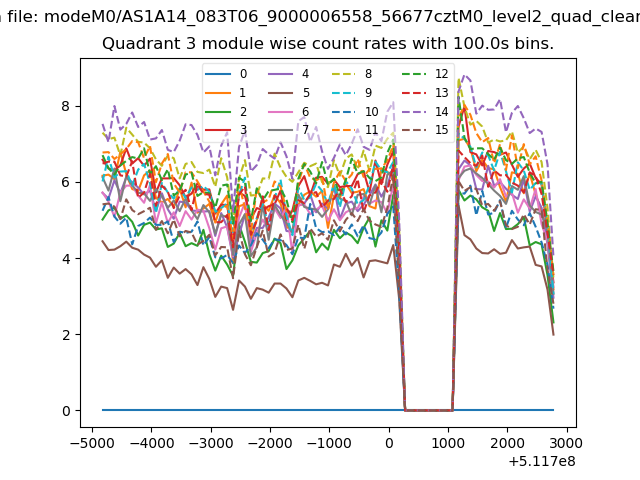
| Module-wise count rates for Quadrant C Data is divided into 100 sec bins |
 |
 |
| Module-wise count rates for Quadrant D Data is divided into 100 sec bins |
 |
 |
| Parameter | Plot |
|---|---|
| CZT HV Monitor | 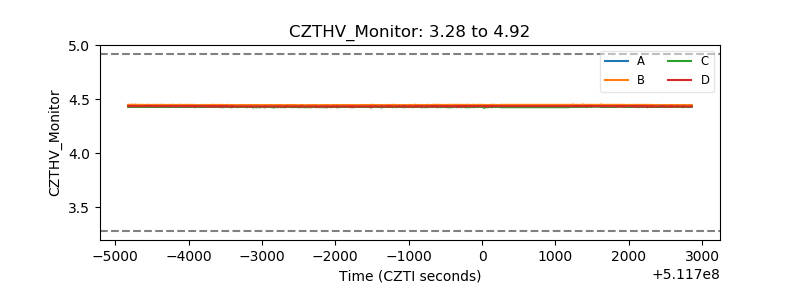 |
| D_VDD | 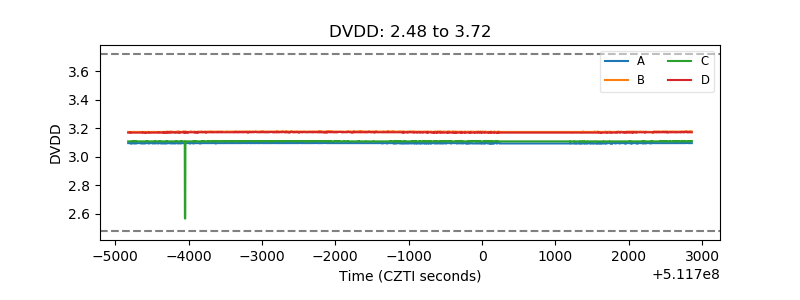 |
| Temperature 1 | 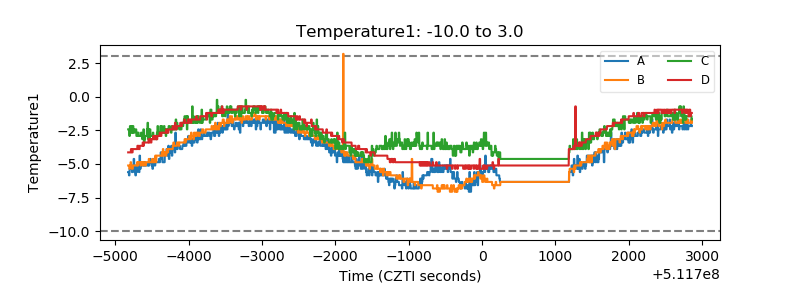 |
| Veto HV Monitor | 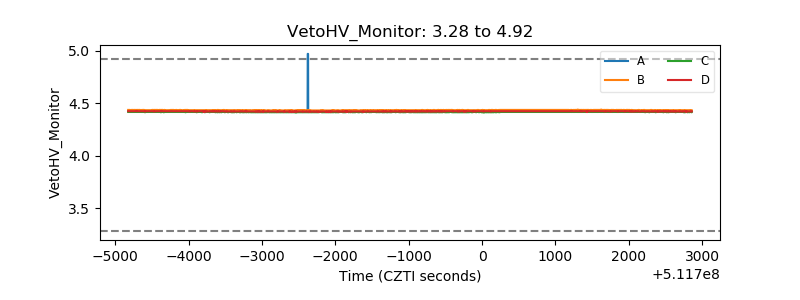 |
| Veto LLD | 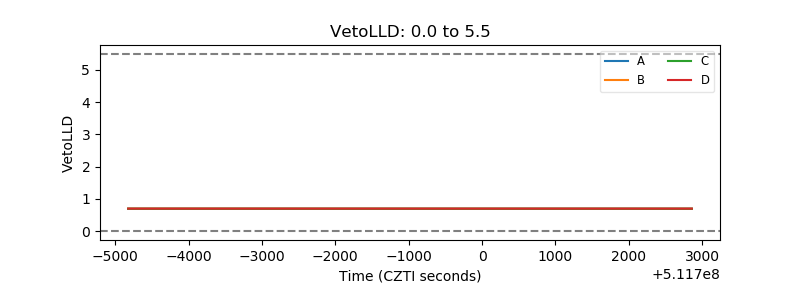 |
| Alpha Counter | 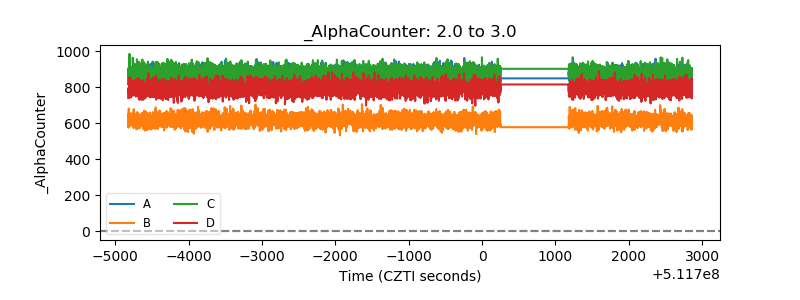 |
| _CPM_Rate | 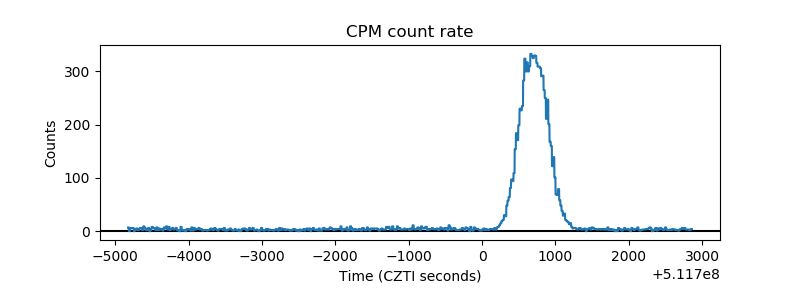 |
| CZT Counter | 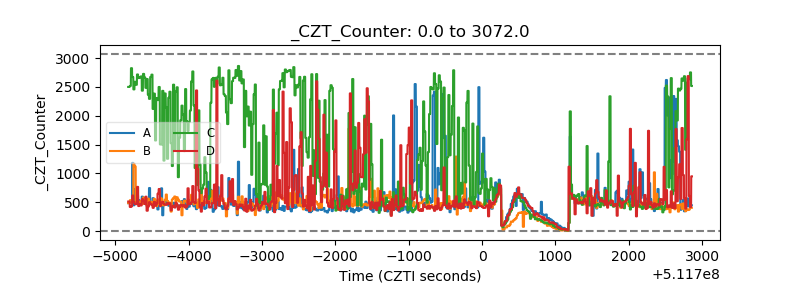 |
| +2.5 Volts monitor |  |
| +5 Volts monitor |  |
| _ROLL_ROT | 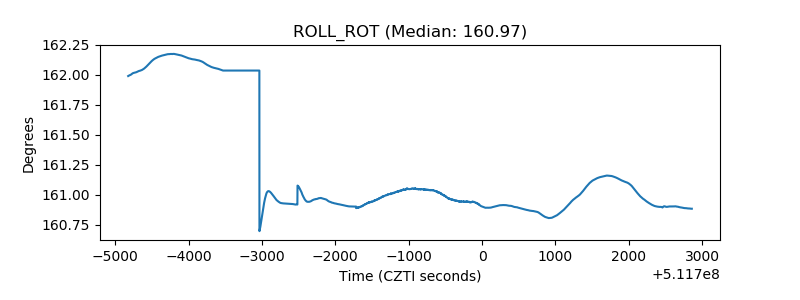 |
| _Roll_DEC | 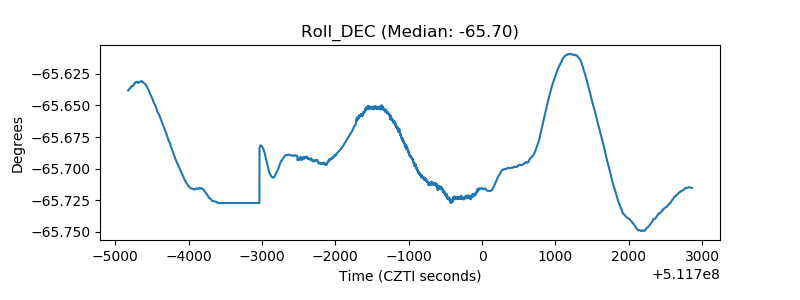 |
| _Roll_RA | 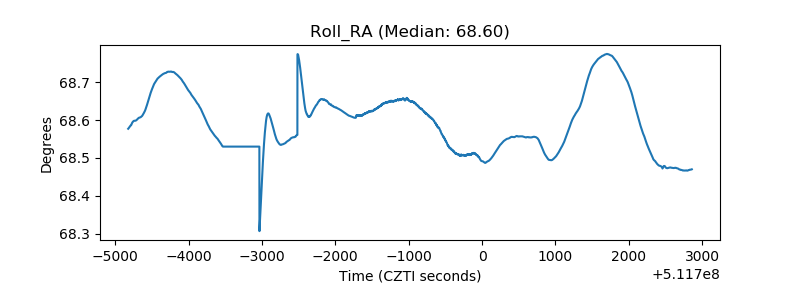 |
| Veto Counter | 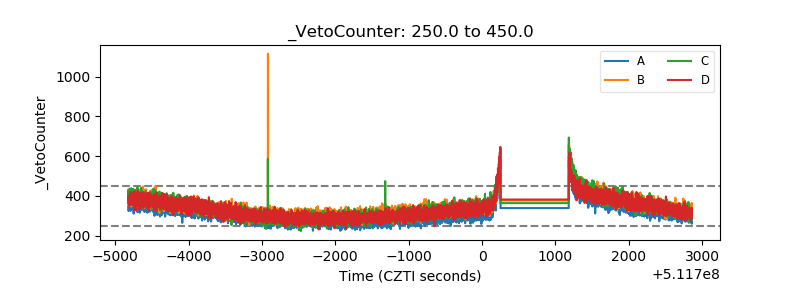 |