| Param | Original file | Final file |
|---|---|---|
| Filename | modeM0/AS1A14_083T06_9000006558_56682cztM0_level2.fits | modeM0/AS1A14_083T06_9000006558_56682cztM0_level2_quad_clean.evt |
| Size (bytes) | 578,206,080 | 87,721,920 |
| Size | 551.4 MB | 83.7 MB |
| Events in quadrant A | 8,745,674 | 480,626 |
| Events in quadrant B | 2,951,112 | 664,016 |
| Events in quadrant C | 5,838,216 | 530,519 |
| Events in quadrant D | 3,378,890 | 541,027 |
| Mode SS | |||
|---|---|---|---|
| Quadrant | BADHDUFLAG | Total packets | Discarded packets |
| A | 0 | 126 | 0 |
| B | 0 | 126 | 0 |
| C | 0 | 126 | 0 |
| D | 0 | 126 | 0 |
| Mode M9 | |||
|---|---|---|---|
| Quadrant | BADHDUFLAG | Total packets | Discarded packets |
| A | 0 | 12 | 0 |
| B | 0 | 12 | 0 |
| C | 0 | 12 | 0 |
| D | 0 | 12 | 0 |
| Mode M0 | |||
|---|---|---|---|
| Quadrant | BADHDUFLAG | Total packets | Discarded packets |
| A | 0 | 30364 | 1 |
| B | 0 | 13335 | 1 |
| C | 0 | 21918 | 8 |
| D | 0 | 14719 | 1 |
| Quadrant | Total seconds | Saturated seconds | Saturation percentage |
|---|---|---|---|
| A | 6310 | 1748 | 27.702060% |
| B | 6310 | 65 | 1.030111% |
| C | 6309 | 657 | 10.413695% |
| D | 6309 | 107 | 1.695990% |
Noise dominated data is calculated using 1-second bins in cleaned event files. If a bin has >2000 counts, and if more than 50% of those come from <1% of pixels, then it is considered to be noise-dominated and hence unusable.
| Quadrant | # 1 sec bins | Bins with >0 counts | Bins with >2000 counts | High rate bins dominated by noise | Noise dominated (total time) | Noise dominated (detector-on time) | Marked lightcurve |
|---|---|---|---|---|---|---|---|
| A | 7460 | 6311 | 1462 | 1462 | 19.60% | 23.17% | 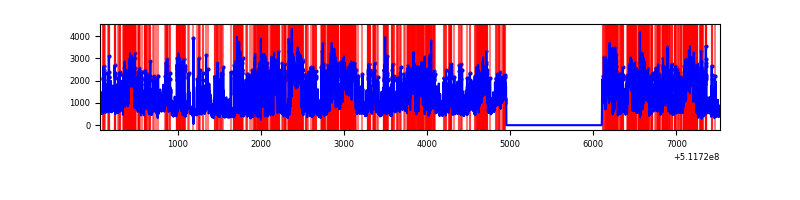 |
| B | 7460 | 6311 | 11 | 11 | 0.15% | 0.17% | 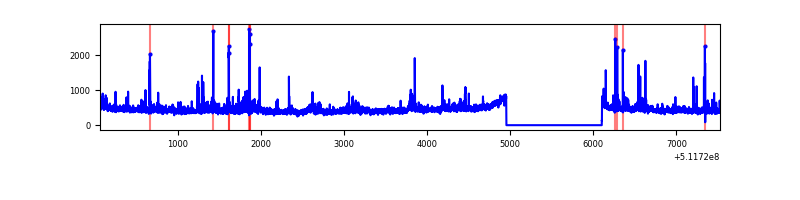 |
| C | 7459 | 6310 | 731 | 731 | 9.80% | 11.58% | 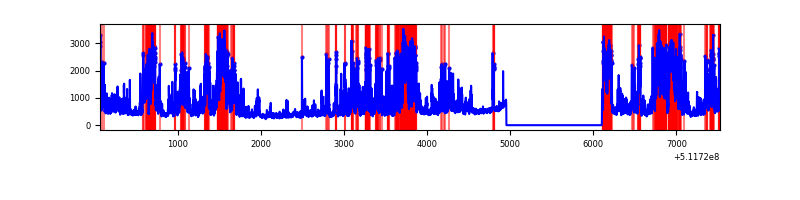 |
| D | 7459 | 6310 | 91 | 91 | 1.22% | 1.44% | 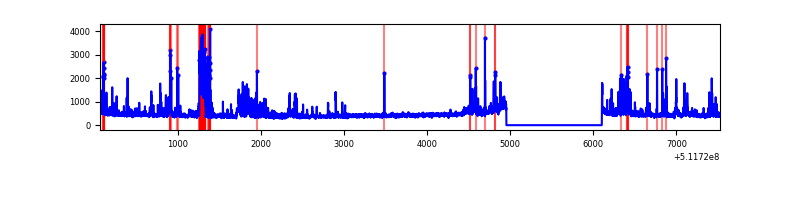 |
Top three noisy pixels from each quadrant. If the there are fewer than three noisy pixels in the level2.evt file, extra rows are filled as -1
| Pixel properties | Quadrant properties | ||||||
|---|---|---|---|---|---|---|---|
| Quadrant | DetID | PixID | Counts | Sigma | Mean | Median | Sigma |
| A | 10 | 251 | 5027795 | 33591.43 | 602 | 587 | 149.7 |
| A | 8 | 26 | 585692 | 3909.63 | 602 | 587 | 149.7 |
| A | 3 | 14 | 353261 | 2356.54 | 602 | 587 | 149.7 |
| B | 10 | 247 | 97063 | 675.09 | 665 | 639 | 142.8 |
| B | 0 | 171 | 94054 | 654.02 | 665 | 639 | 142.8 |
| B | 8 | 128 | 40681 | 280.34 | 665 | 639 | 142.8 |
| C | 15 | 230 | 3108276 | 18271.82 | 614 | 607 | 170.1 |
| C | 6 | 223 | 92718 | 541.57 | 614 | 607 | 170.1 |
| C | 14 | 96 | 56937 | 331.2 | 614 | 607 | 170.1 |
| D | 2 | 249 | 474748 | 2652.47 | 633 | 604 | 178.8 |
| D | 5 | 173 | 56196 | 310.99 | 633 | 604 | 178.8 |
| D | 3 | 12 | 53826 | 297.74 | 633 | 604 | 178.8 |
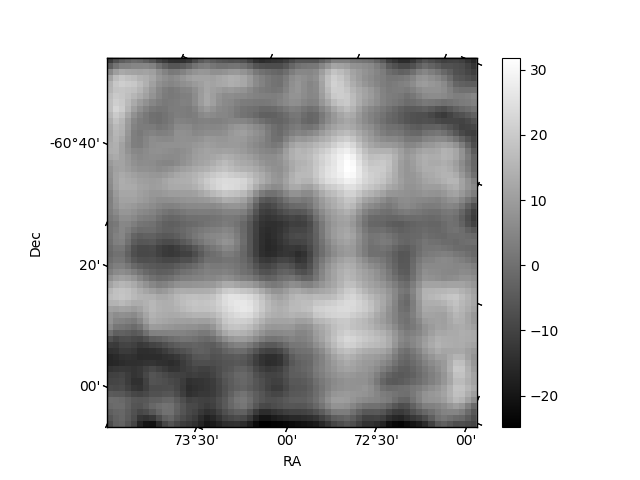
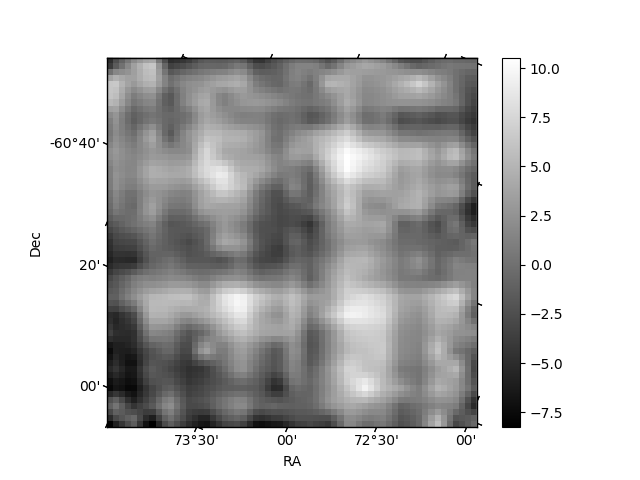
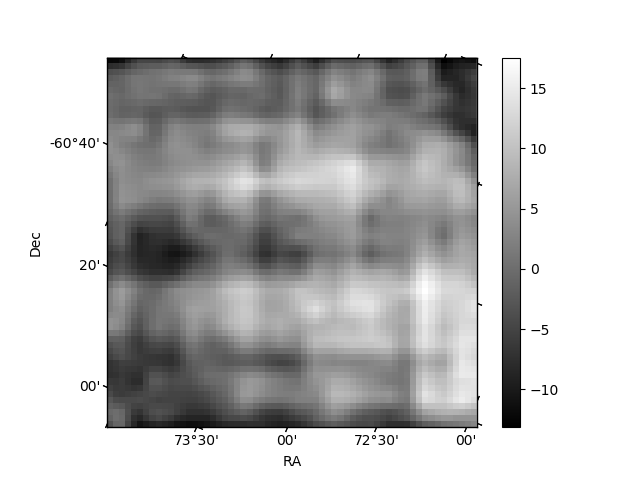
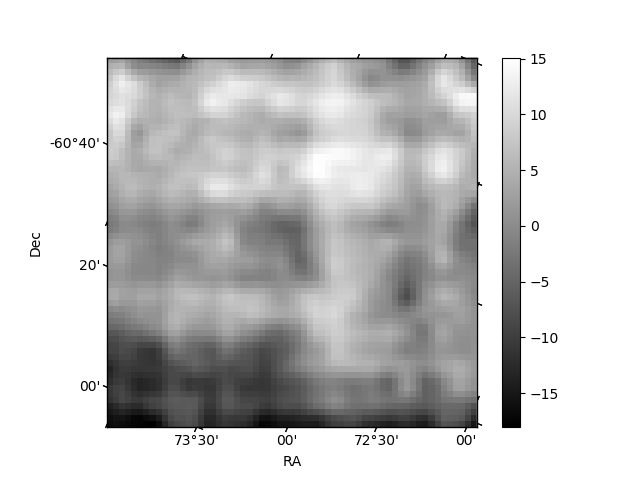
Histogram calculated using DETX and DETY for each event in the final _common_clean file
| Quadrant A | 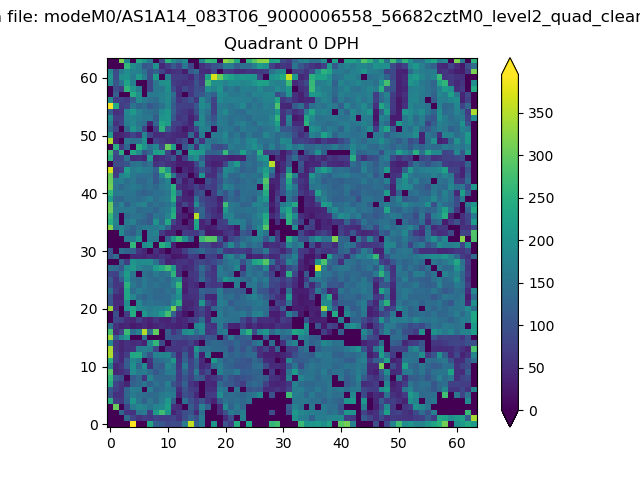 |
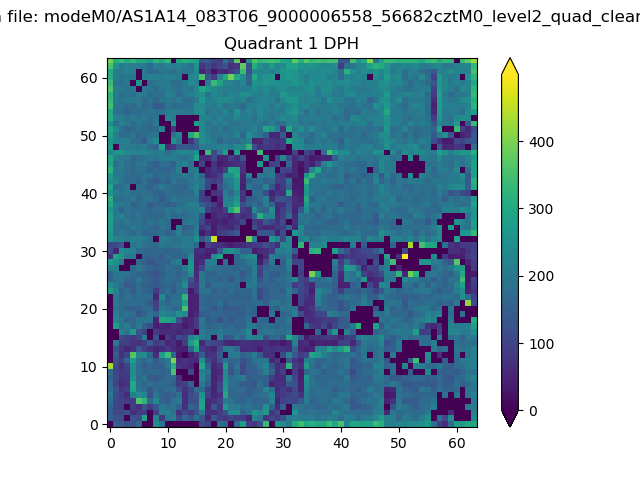 |
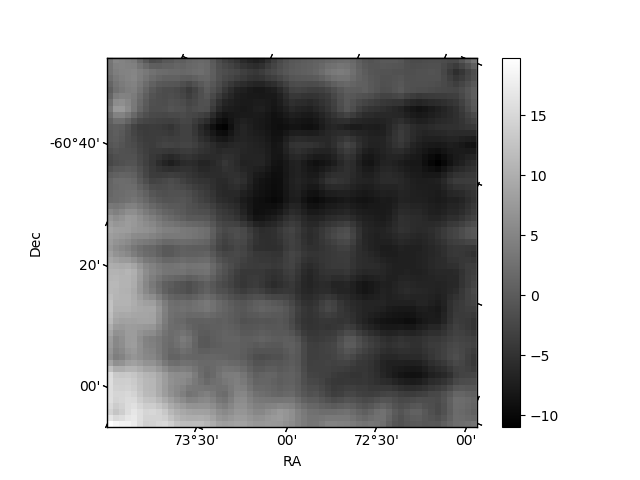
Quadrant B |
|---|---|---|---|
| Quadrant D | 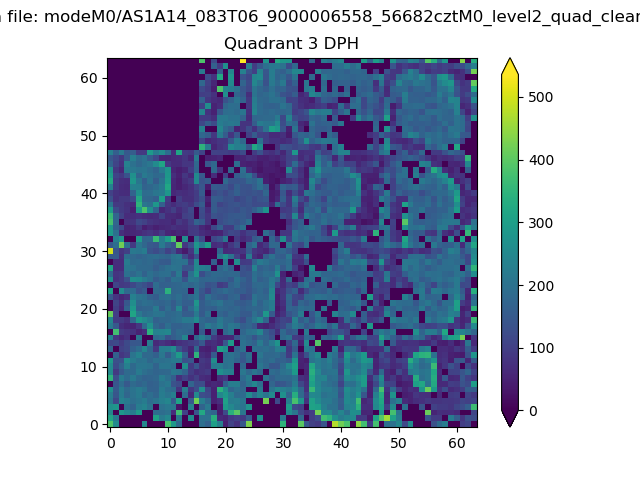 |
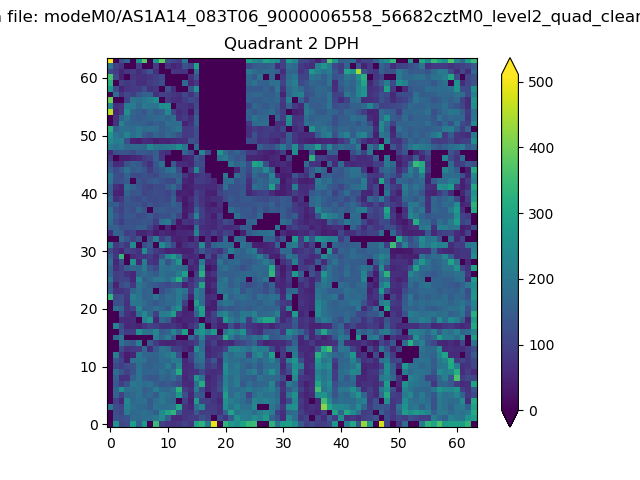 |
Quadrant C |
| Plot type | Count rate plots | Images |
|---|---|---|
| Comparison with Poisson distribution Blue bars denote a histogram of data divided into 1 sec bins. Red curve is a Poisson curve with rate = median count rate of data. |
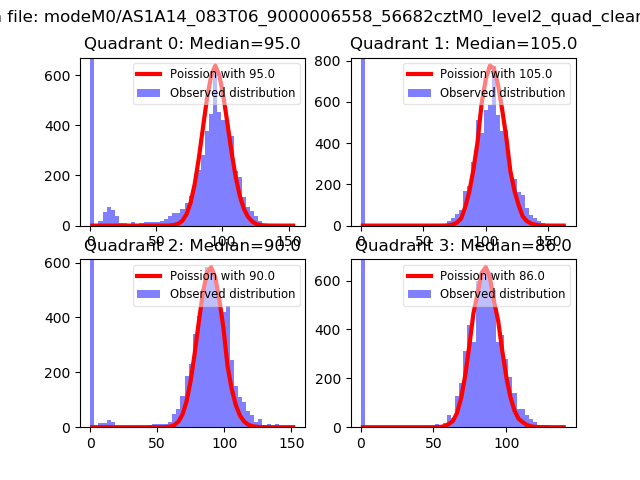 |
 |
| Quadrant-wise count rates Data is divided into 100 sec bins |
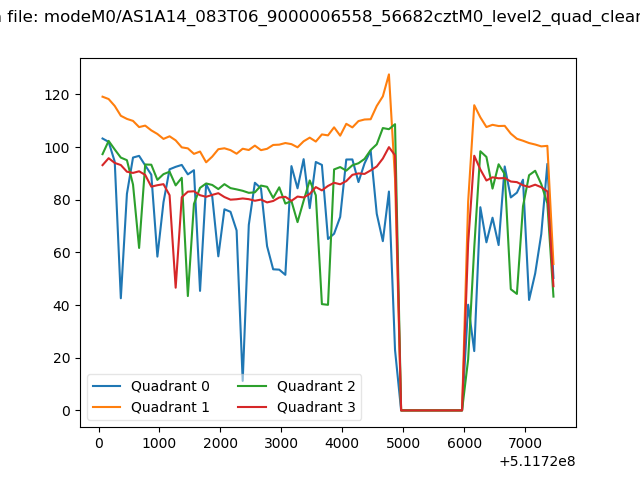 |
|
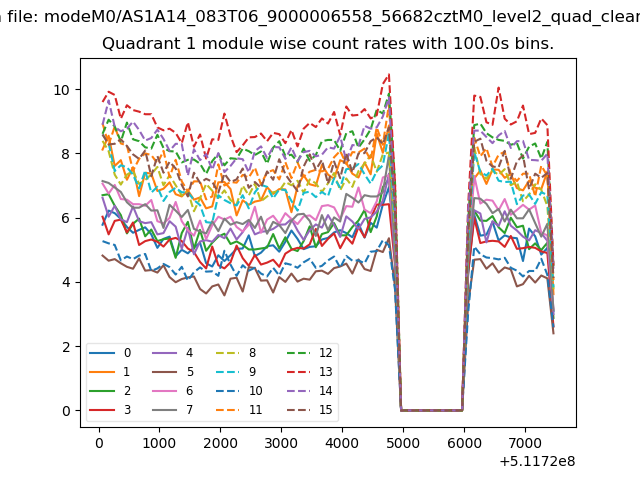
| Module-wise count rates for Quadrant A Data is divided into 100 sec bins |
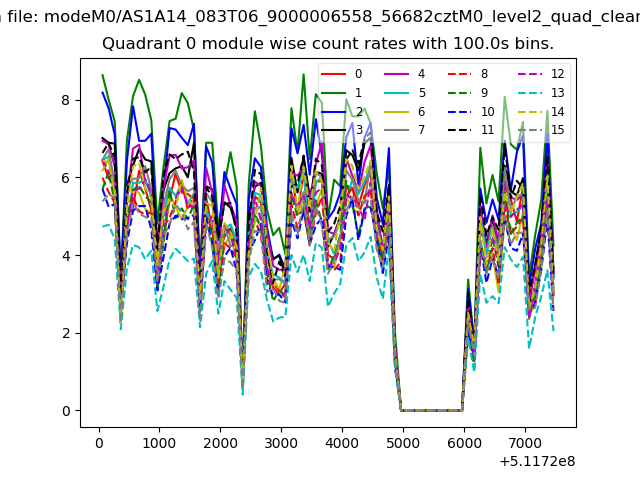 |
 |
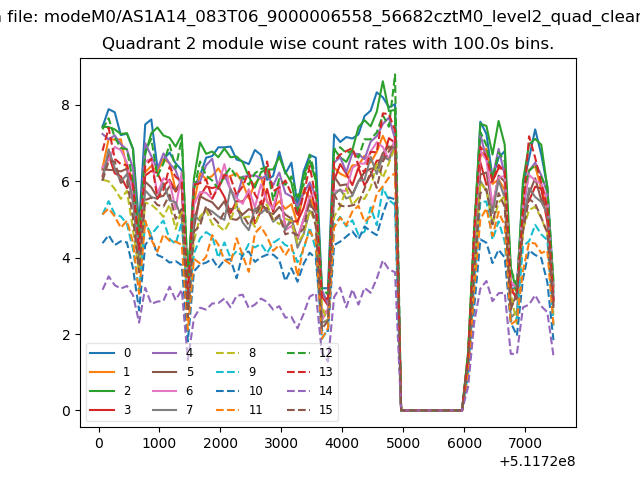
| Module-wise count rates for Quadrant B Data is divided into 100 sec bins |
 |
 |
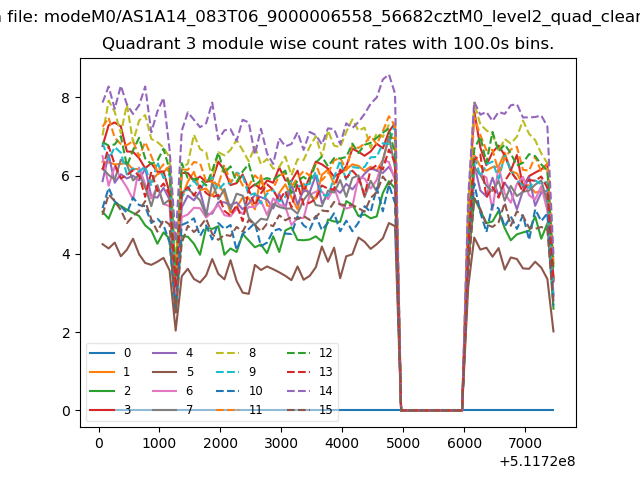
| Module-wise count rates for Quadrant C Data is divided into 100 sec bins |
 |
 |
| Module-wise count rates for Quadrant D Data is divided into 100 sec bins |
 |
 |
| Parameter | Plot |
|---|---|
| CZT HV Monitor | 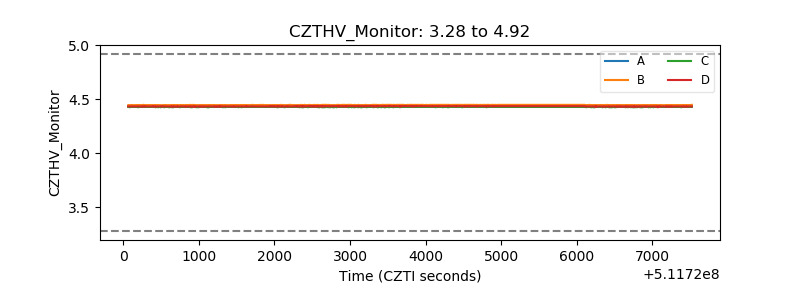 |
| D_VDD | 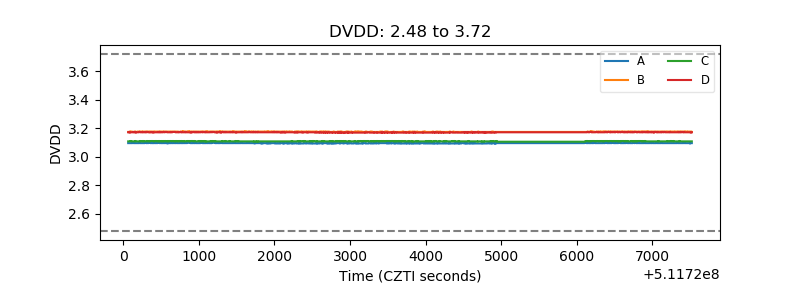 |
| Temperature 1 | 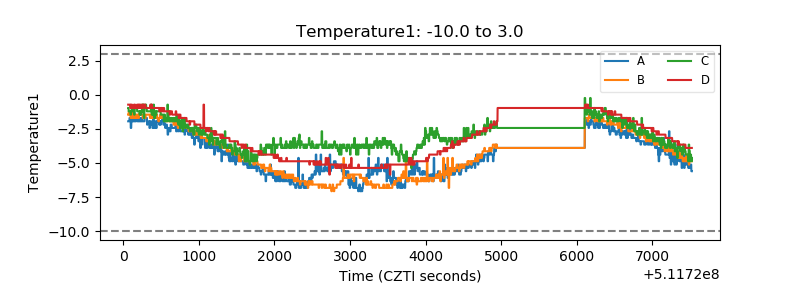 |
| Veto HV Monitor | 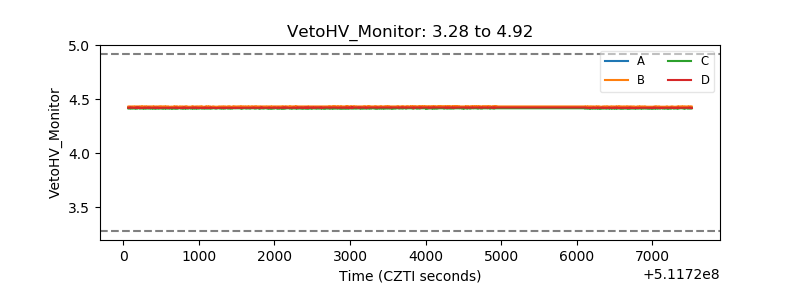 |
| Veto LLD | 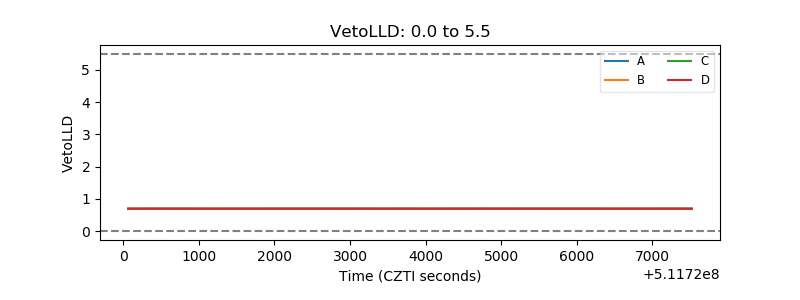 |
| Alpha Counter | 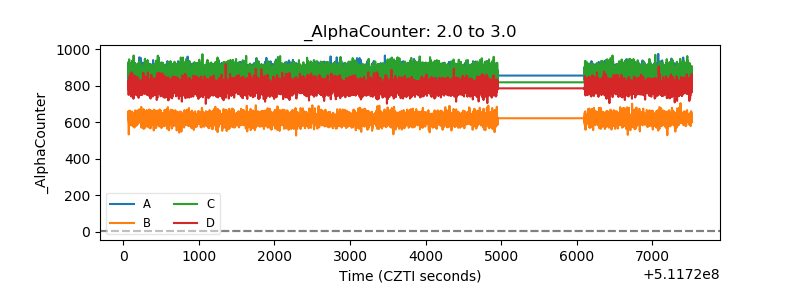 |
| _CPM_Rate | 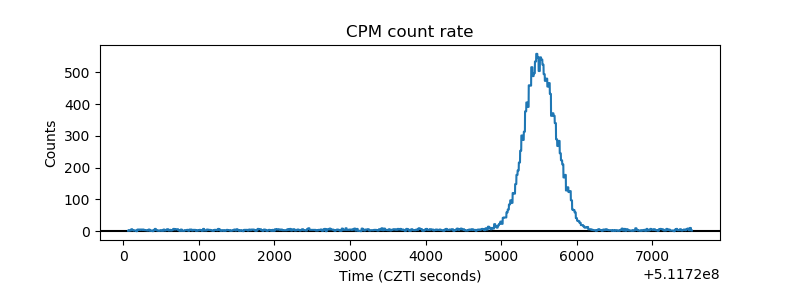 |
| CZT Counter | 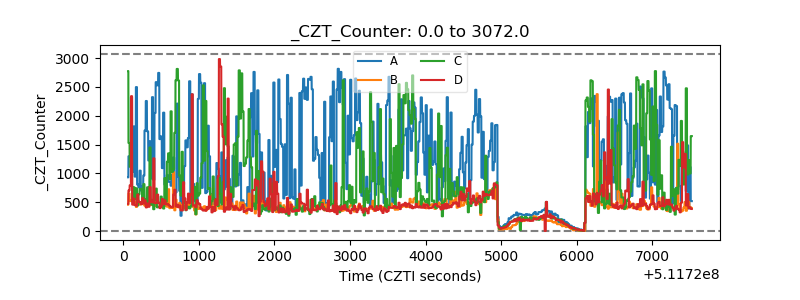 |
| +2.5 Volts monitor |  |
| +5 Volts monitor |  |
| _ROLL_ROT | 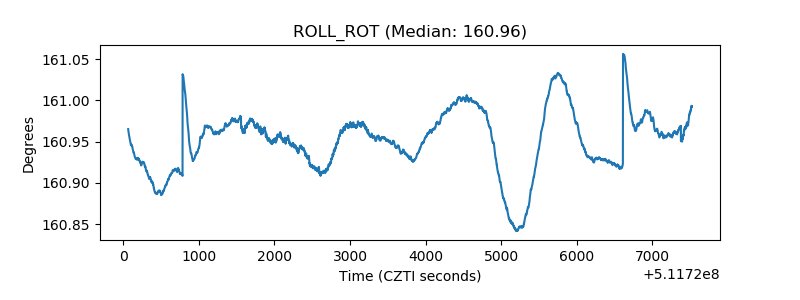 |
| _Roll_DEC | 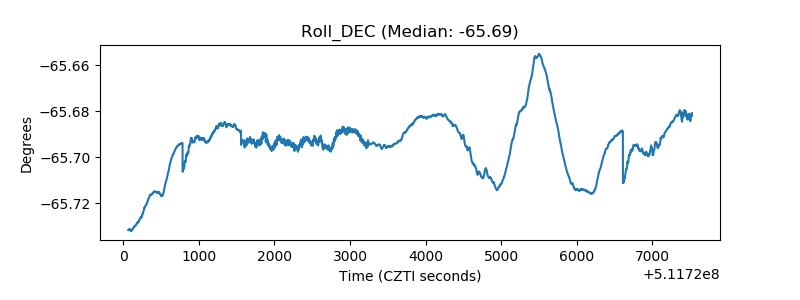 |
| _Roll_RA | 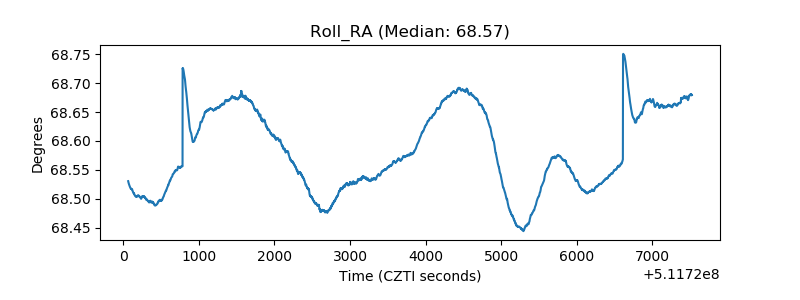 |
| Veto Counter | 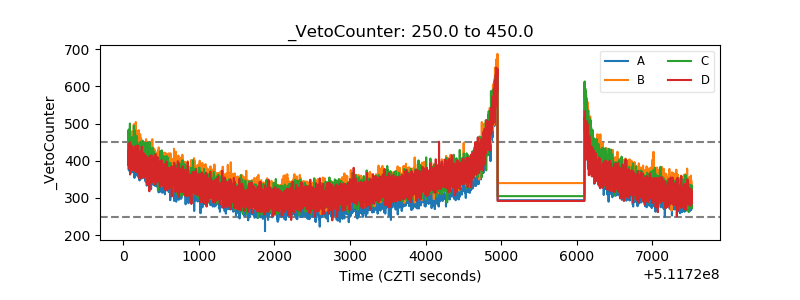 |