| Param | Original file | Final file |
|---|---|---|
| Filename | modeM0/AS1A14_083T06_9000006558_56685cztM0_level2.fits | modeM0/AS1A14_083T06_9000006558_56685cztM0_level2_quad_clean.evt |
| Size (bytes) | 479,810,880 | 108,541,440 |
| Size | 457.6 MB | 103.5 MB |
| Events in quadrant A | 4,305,020 | 715,500 |
| Events in quadrant B | 3,641,301 | 777,483 |
| Events in quadrant C | 5,165,470 | 613,707 |
| Events in quadrant D | 4,054,111 | 648,061 |
| Mode SS | |||
|---|---|---|---|
| Quadrant | BADHDUFLAG | Total packets | Discarded packets |
| A | 0 | 156 | 0 |
| B | 0 | 156 | 0 |
| C | 0 | 156 | 0 |
| D | 0 | 156 | 0 |
| Mode M9 | |||
|---|---|---|---|
| Quadrant | BADHDUFLAG | Total packets | Discarded packets |
| A | 0 | 10 | 0 |
| B | 0 | 10 | 0 |
| C | 0 | 10 | 0 |
| D | 0 | 10 | 0 |
| Mode M0 | |||
|---|---|---|---|
| Quadrant | BADHDUFLAG | Total packets | Discarded packets |
| A | 0 | 18551 | 2 |
| B | 0 | 16378 | 2 |
| C | 0 | 21281 | 2 |
| D | 0 | 17831 | 2 |
| Quadrant | Total seconds | Saturated seconds | Saturation percentage |
|---|---|---|---|
| A | 7646 | 245 | 3.204290% |
| B | 7646 | 148 | 1.935653% |
| C | 7647 | 863 | 11.285471% |
| D | 7647 | 150 | 1.961554% |
Noise dominated data is calculated using 1-second bins in cleaned event files. If a bin has >2000 counts, and if more than 50% of those come from <1% of pixels, then it is considered to be noise-dominated and hence unusable.
| Quadrant | # 1 sec bins | Bins with >0 counts | Bins with >2000 counts | High rate bins dominated by noise | Noise dominated (total time) | Noise dominated (detector-on time) | Marked lightcurve |
|---|---|---|---|---|---|---|---|
| A | 8576 | 7649 | 166 | 166 | 1.94% | 2.17% | 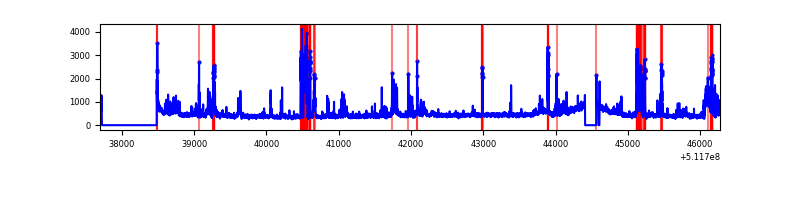 |
| B | 8576 | 7649 | 9 | 9 | 0.10% | 0.12% | 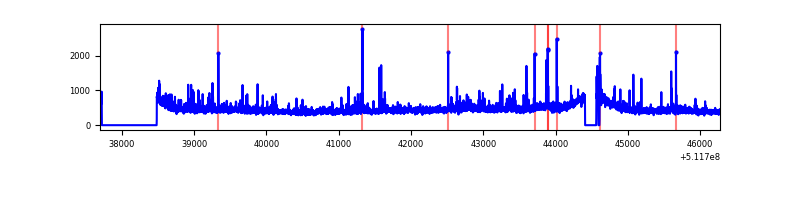 |
| C | 8577 | 7649 | 557 | 557 | 6.49% | 7.28% | 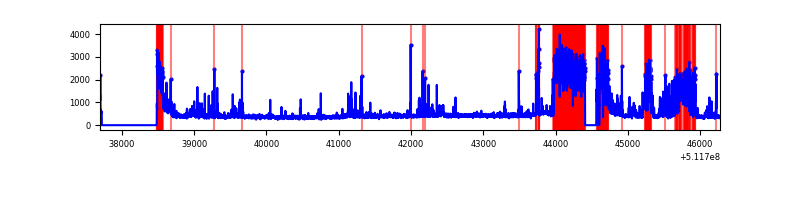 |
| D | 8577 | 7650 | 86 | 86 | 1.00% | 1.12% | 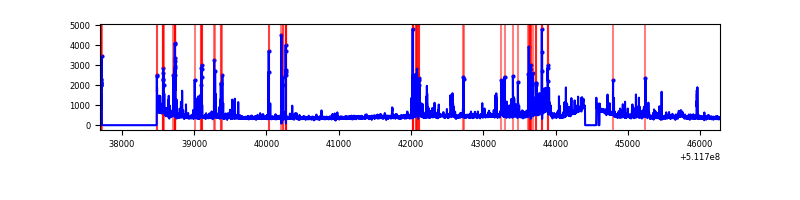 |
Top three noisy pixels from each quadrant. If the there are fewer than three noisy pixels in the level2.evt file, extra rows are filled as -1
| Pixel properties | Quadrant properties | ||||||
|---|---|---|---|---|---|---|---|
| Quadrant | DetID | PixID | Counts | Sigma | Mean | Median | Sigma |
| A | 8 | 26 | 885318 | 4365.37 | 818 | 799 | 202.6 |
| A | 3 | 62 | 67124 | 327.33 | 818 | 799 | 202.6 |
| A | 10 | 251 | 39233 | 189.68 | 818 | 799 | 202.6 |
| B | 4 | 21 | 165062 | 940.25 | 818 | 788 | 174.7 |
| B | 10 | 247 | 55359 | 312.35 | 818 | 788 | 174.7 |
| B | 8 | 128 | 35557 | 199.0 | 818 | 788 | 174.7 |
| C | 15 | 230 | 1462013 | 7242.9 | 734 | 726 | 201.8 |
| C | 15 | 215 | 361972 | 1790.52 | 734 | 726 | 201.8 |
| C | 6 | 223 | 189616 | 936.24 | 734 | 726 | 201.8 |
| D | 2 | 249 | 288953 | 1285.4 | 792 | 756 | 224.2 |
| D | 8 | 240 | 104286 | 461.76 | 792 | 756 | 224.2 |
| D | 6 | 239 | 79205 | 349.9 | 792 | 756 | 224.2 |
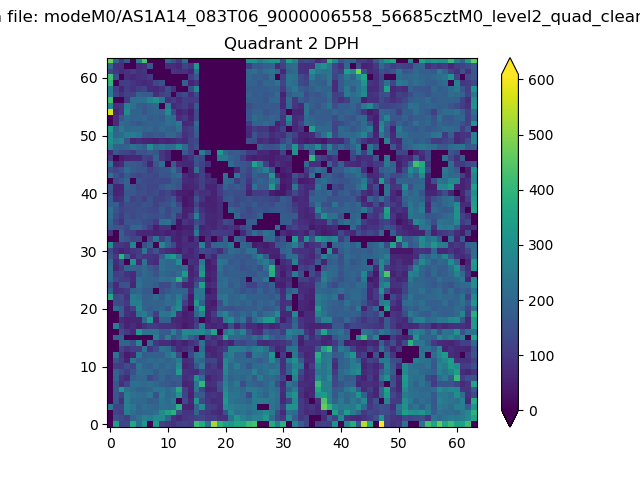
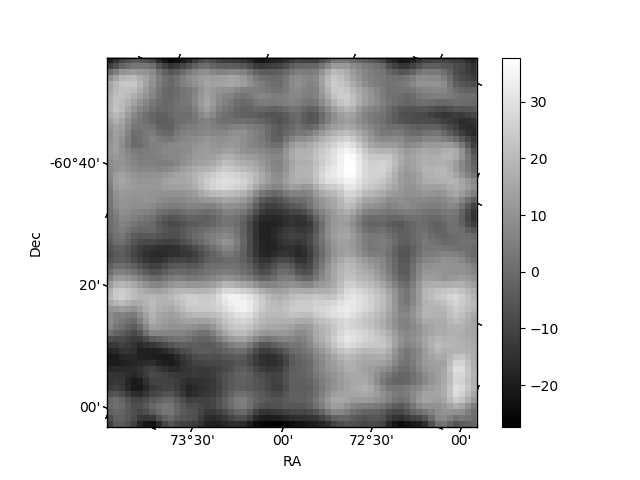
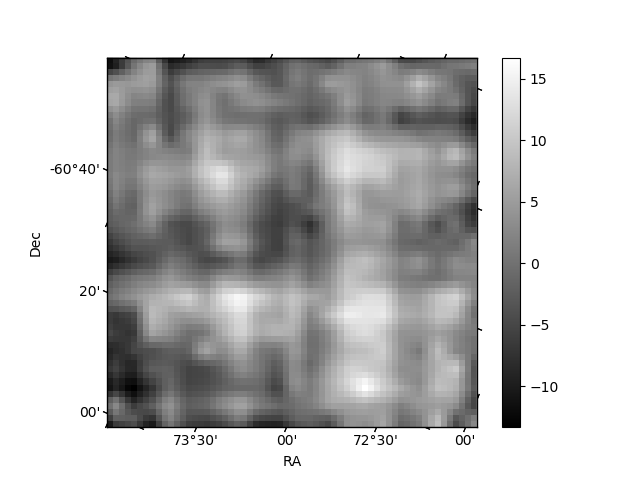
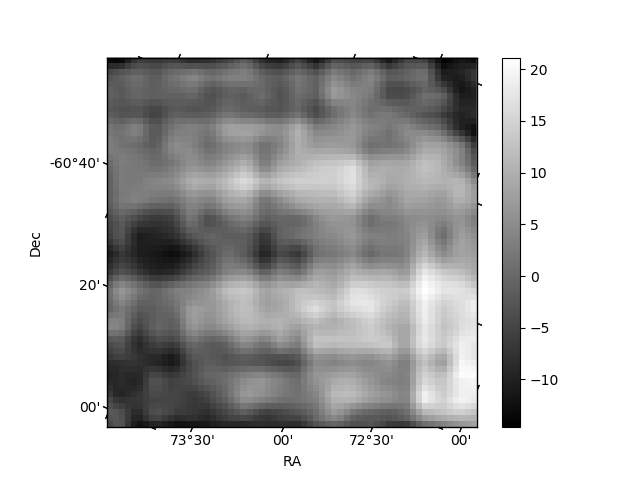
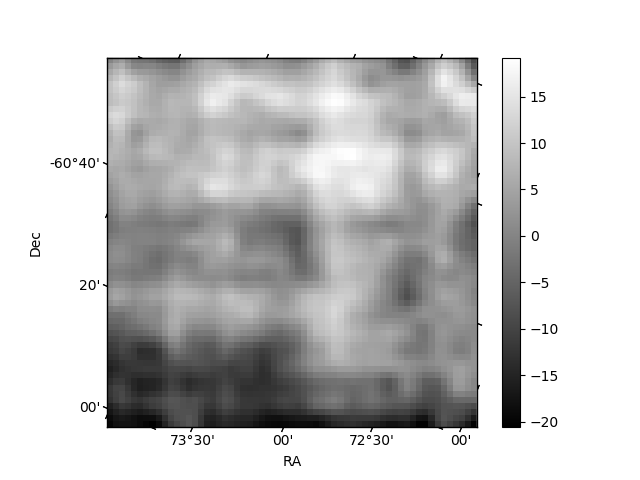
Histogram calculated using DETX and DETY for each event in the final _common_clean file
| Quadrant A | 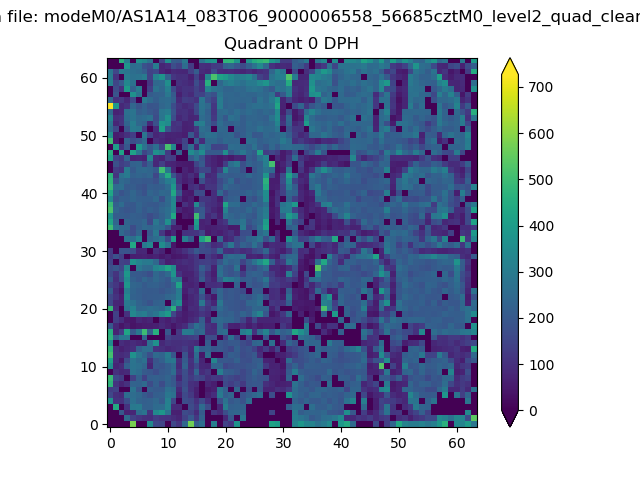 |
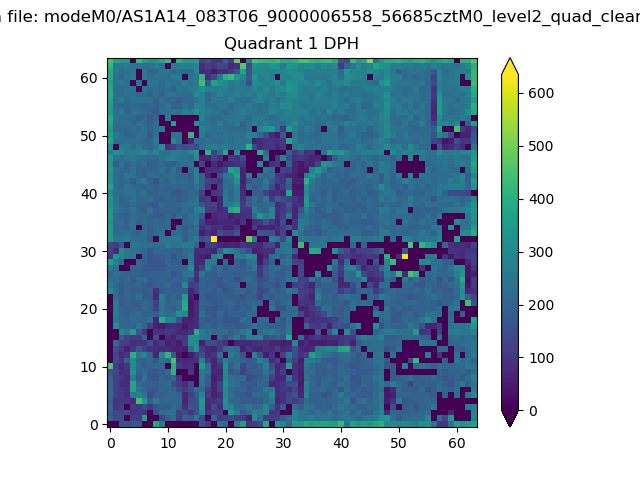 |
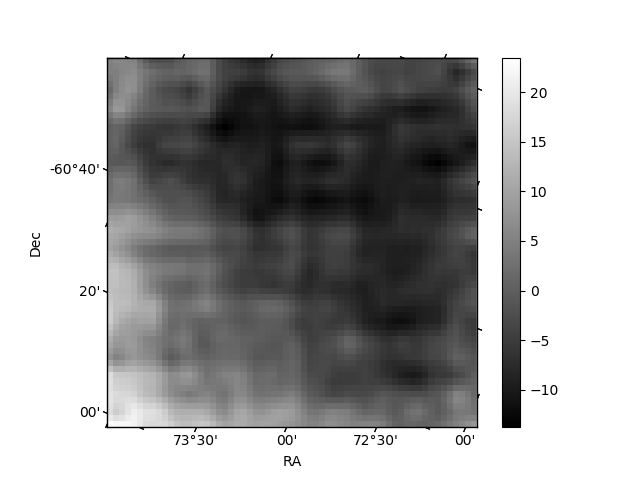
Quadrant B |
|---|---|---|---|
| Quadrant D | 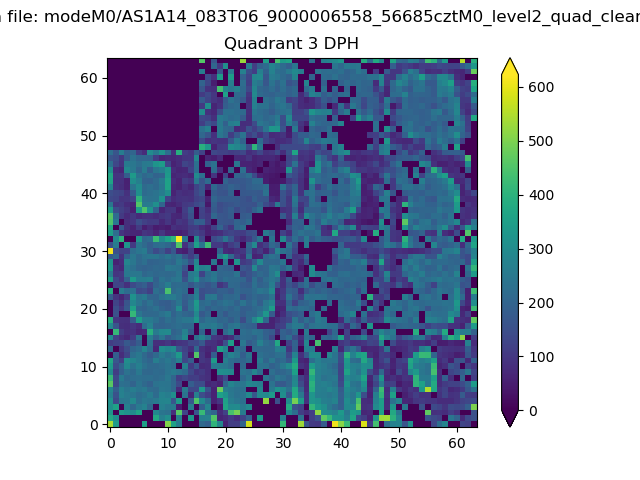 |
 |
Quadrant C |
| Plot type | Count rate plots | Images |
|---|---|---|
| Comparison with Poisson distribution Blue bars denote a histogram of data divided into 1 sec bins. Red curve is a Poisson curve with rate = median count rate of data. |
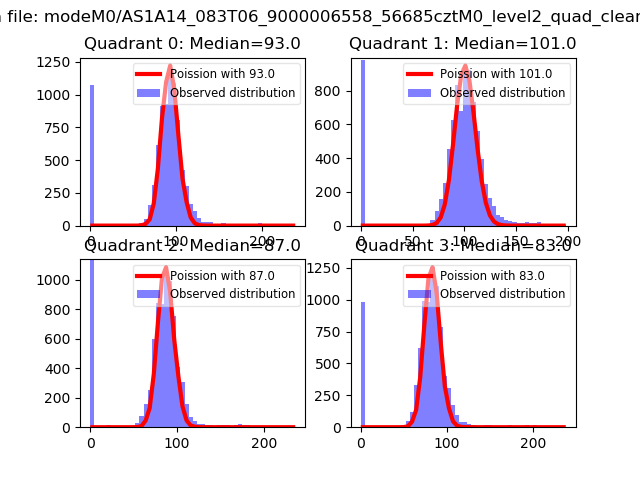 |
 |
| Quadrant-wise count rates Data is divided into 100 sec bins |
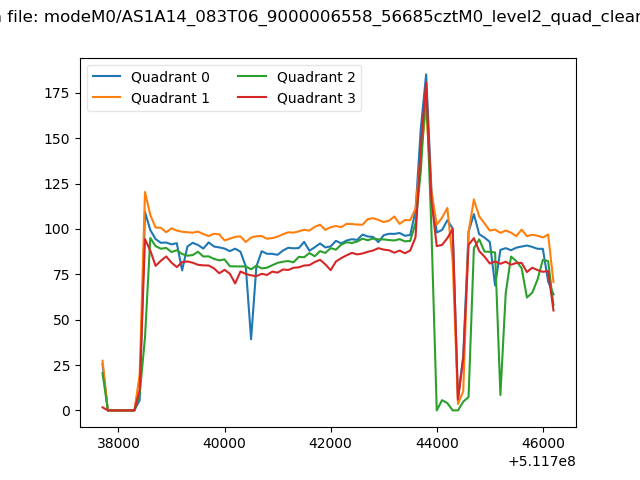 |
|
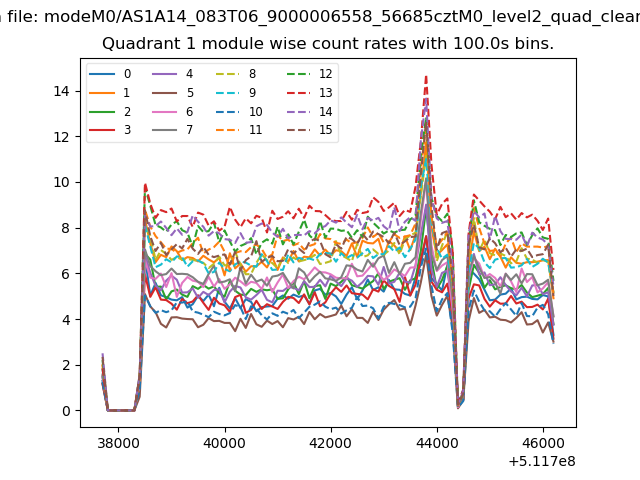
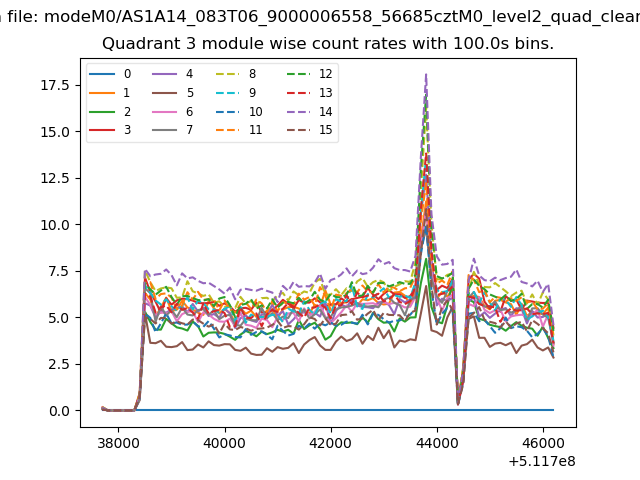
| Module-wise count rates for Quadrant A Data is divided into 100 sec bins |
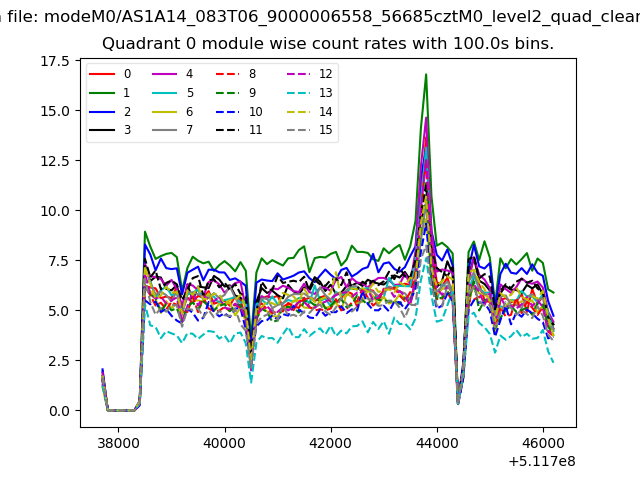 |
 |
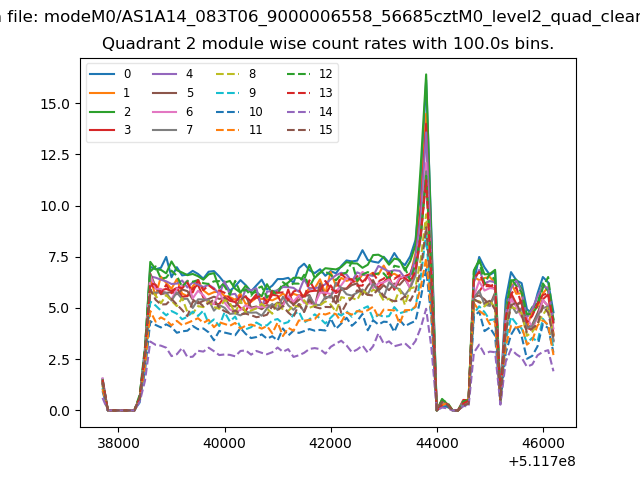
| Module-wise count rates for Quadrant B Data is divided into 100 sec bins |
 |
 |
| Module-wise count rates for Quadrant C Data is divided into 100 sec bins |
 |
 |
| Module-wise count rates for Quadrant D Data is divided into 100 sec bins |
 |
 |
| Parameter | Plot |
|---|---|
| CZT HV Monitor | 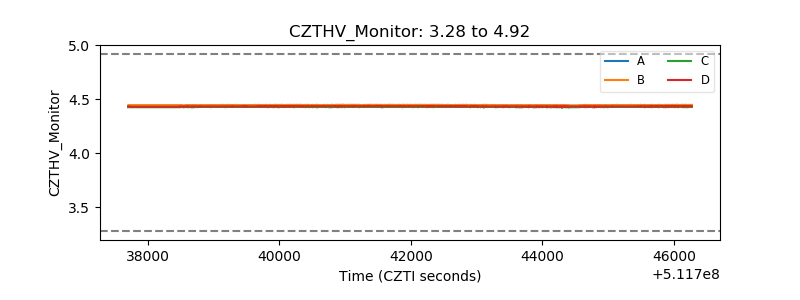 |
| D_VDD | 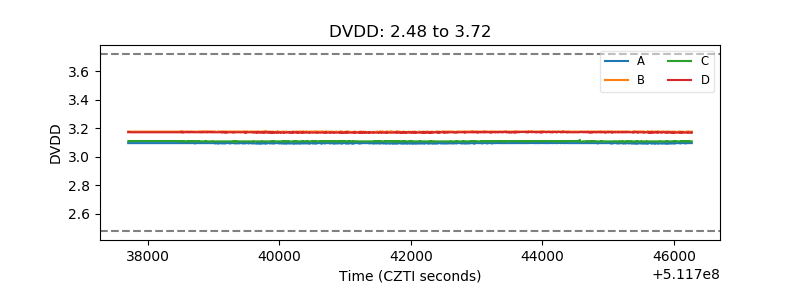 |
| Temperature 1 | 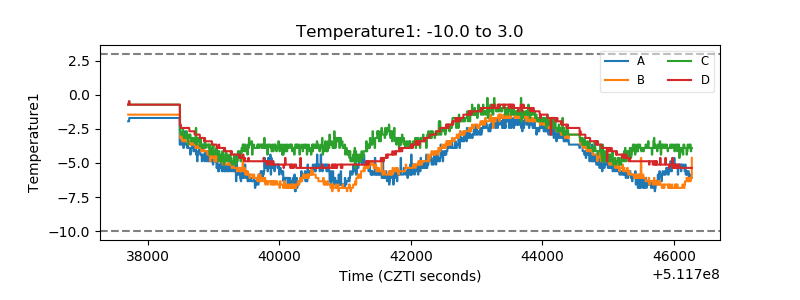 |
| Veto HV Monitor | 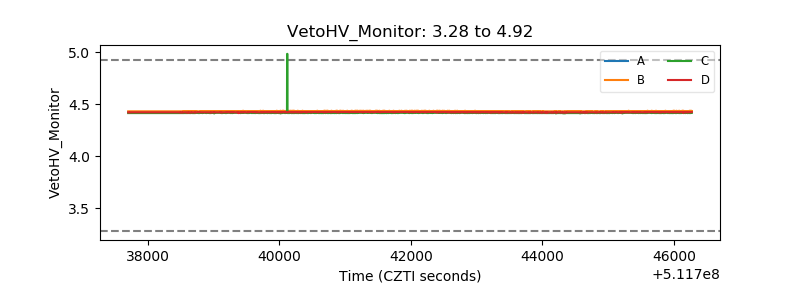 |
| Veto LLD | 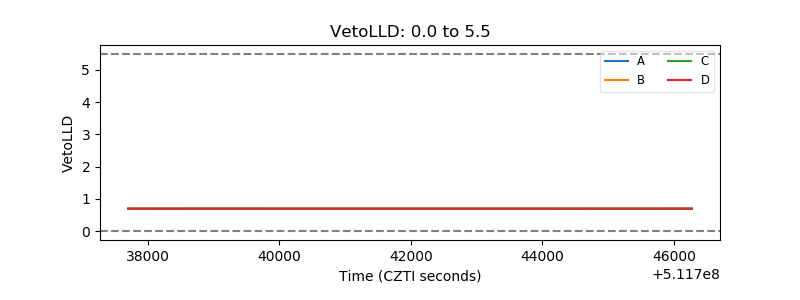 |
| Alpha Counter | 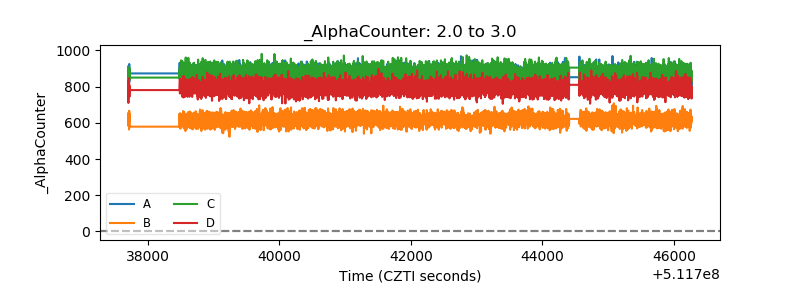 |
| _CPM_Rate | 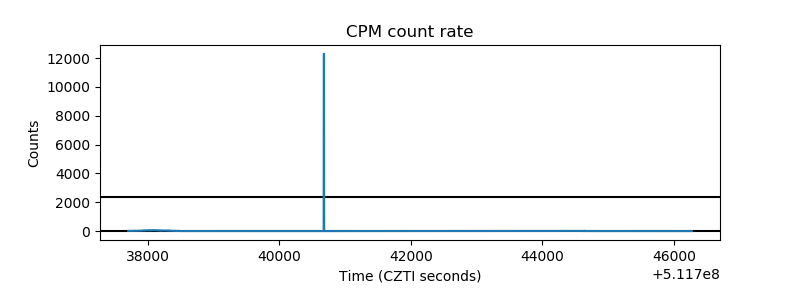 |
| CZT Counter | 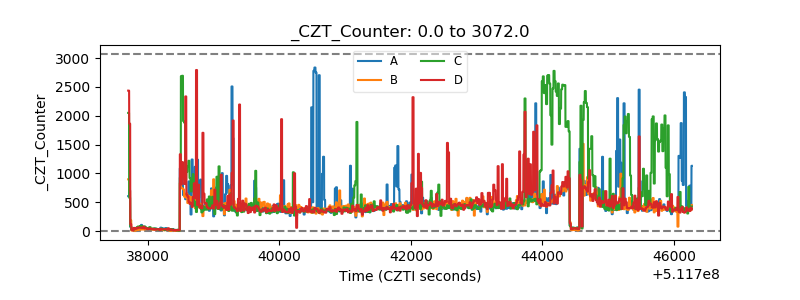 |
| +2.5 Volts monitor |  |
| +5 Volts monitor |  |
| _ROLL_ROT | 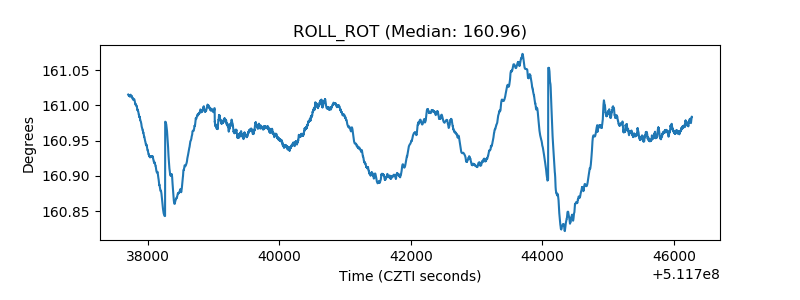 |
| _Roll_DEC | 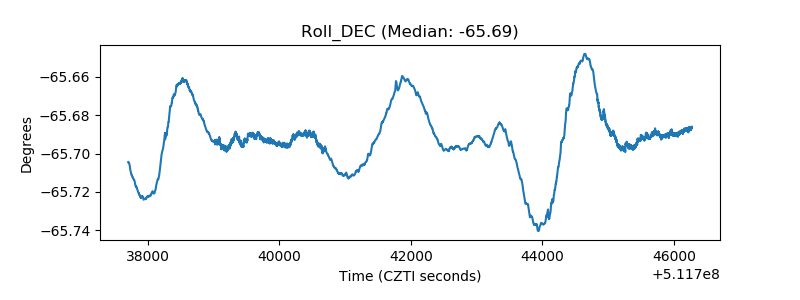 |
| _Roll_RA | 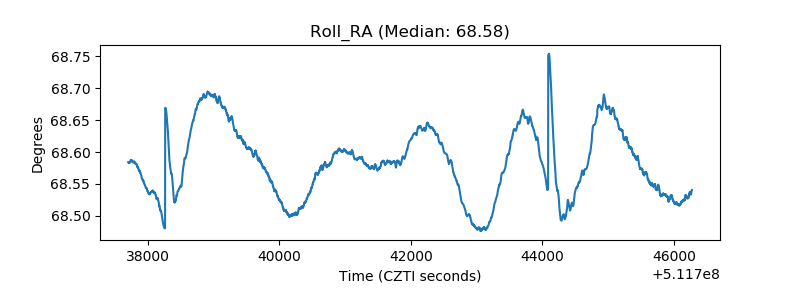 |
| Veto Counter | 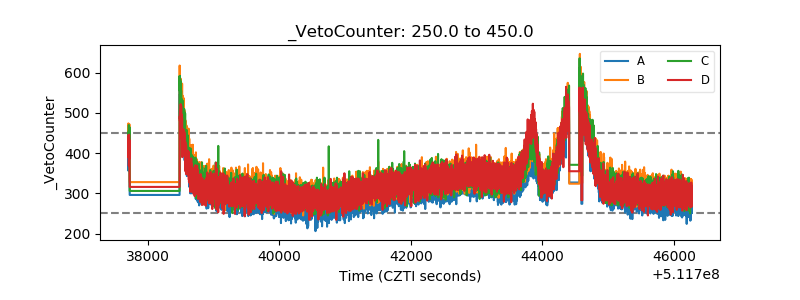 |