| Param | Original file | Final file |
|---|---|---|
| Filename | modeM0/AS1A14_083T06_9000006558_56686cztM0_level2.fits | modeM0/AS1A14_083T06_9000006558_56686cztM0_level2_quad_clean.evt |
| Size (bytes) | 598,826,880 | 141,494,400 |
| Size | 571.1 MB | 134.9 MB |
| Events in quadrant A | 5,507,220 | 1,060,156 |
| Events in quadrant B | 4,191,565 | 1,010,381 |
| Events in quadrant C | 7,164,165 | 615,924 |
| Events in quadrant D | 4,653,261 | 1,016,527 |
| Mode SS | |||
|---|---|---|---|
| Quadrant | BADHDUFLAG | Total packets | Discarded packets |
| A | 0 | 170 | 0 |
| B | 0 | 170 | 0 |
| C | 0 | 170 | 0 |
| D | 0 | 170 | 0 |
| Mode M9 | |||
|---|---|---|---|
| Quadrant | BADHDUFLAG | Total packets | Discarded packets |
| A | 0 | 2 | 0 |
| B | 0 | 2 | 0 |
| C | 0 | 2 | 0 |
| D | 0 | 2 | 0 |
| Mode M0 | |||
|---|---|---|---|
| Quadrant | BADHDUFLAG | Total packets | Discarded packets |
| A | 0 | 22640 | 1 |
| B | 0 | 18728 | 1 |
| C | 0 | 27657 | 1 |
| D | 0 | 20265 | 1 |
| Quadrant | Total seconds | Saturated seconds | Saturation percentage |
|---|---|---|---|
| A | 8372 | 449 | 5.363115% |
| B | 8373 | 159 | 1.898961% |
| C | 8373 | 1490 | 17.795294% |
| D | 8373 | 131 | 1.564553% |
Noise dominated data is calculated using 1-second bins in cleaned event files. If a bin has >2000 counts, and if more than 50% of those come from <1% of pixels, then it is considered to be noise-dominated and hence unusable.
| Quadrant | # 1 sec bins | Bins with >0 counts | Bins with >2000 counts | High rate bins dominated by noise | Noise dominated (total time) | Noise dominated (detector-on time) | Marked lightcurve |
|---|---|---|---|---|---|---|---|
| A | 8542 | 8374 | 315 | 315 | 3.69% | 3.76% | 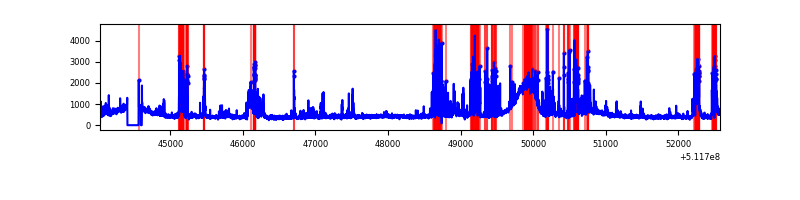 |
| B | 8543 | 8375 | 23 | 23 | 0.27% | 0.27% | 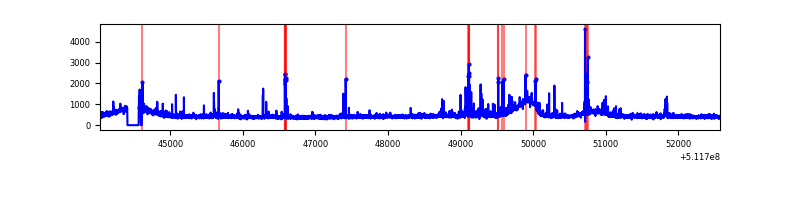 |
| C | 8543 | 8374 | 1125 | 1125 | 13.17% | 13.43% | 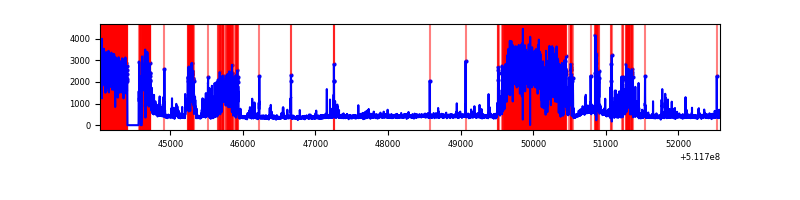 |
| D | 8543 | 8375 | 164 | 164 | 1.92% | 1.96% | 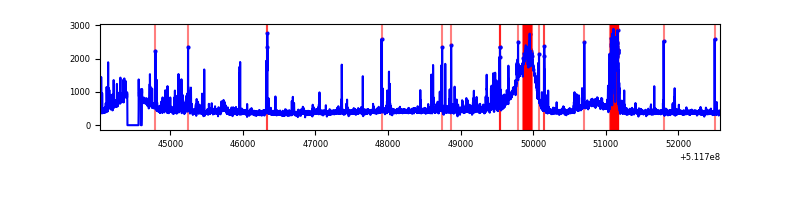 |
Top three noisy pixels from each quadrant. If the there are fewer than three noisy pixels in the level2.evt file, extra rows are filled as -1
| Pixel properties | Quadrant properties | ||||||
|---|---|---|---|---|---|---|---|
| Quadrant | DetID | PixID | Counts | Sigma | Mean | Median | Sigma |
| A | 8 | 26 | 753251 | 2725.91 | 1010 | 988 | 276.0 |
| A | 4 | 249 | 303195 | 1095.08 | 1010 | 988 | 276.0 |
| A | 10 | 251 | 276531 | 998.46 | 1010 | 988 | 276.0 |
| B | 4 | 21 | 147281 | 698.17 | 957 | 922 | 209.6 |
| B | 10 | 247 | 62709 | 294.74 | 957 | 922 | 209.6 |
| B | 8 | 128 | 57203 | 268.48 | 957 | 922 | 209.6 |
| C | 15 | 230 | 2935943 | 13174.53 | 804 | 795 | 222.8 |
| C | 15 | 215 | 561130 | 2515.09 | 804 | 795 | 222.8 |
| C | 13 | 3 | 141863 | 633.19 | 804 | 795 | 222.8 |
| D | 2 | 249 | 300280 | 982.63 | 997 | 952 | 304.6 |
| D | 5 | 173 | 78091 | 253.23 | 997 | 952 | 304.6 |
| D | 2 | 236 | 57095 | 184.31 | 997 | 952 | 304.6 |
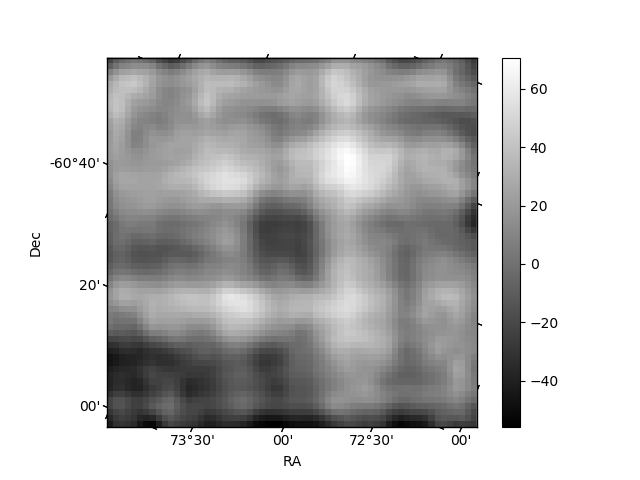
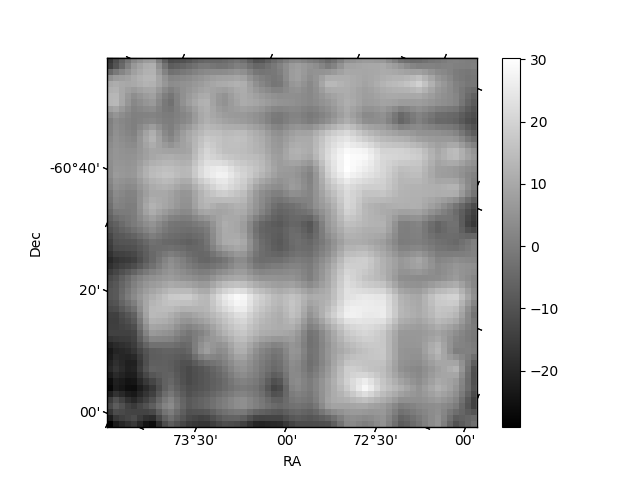
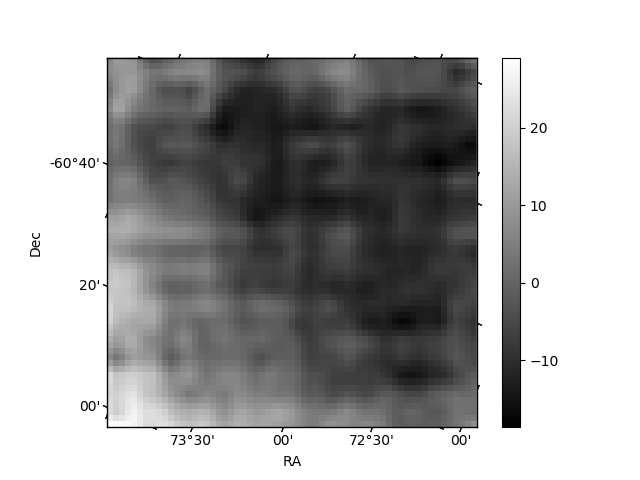
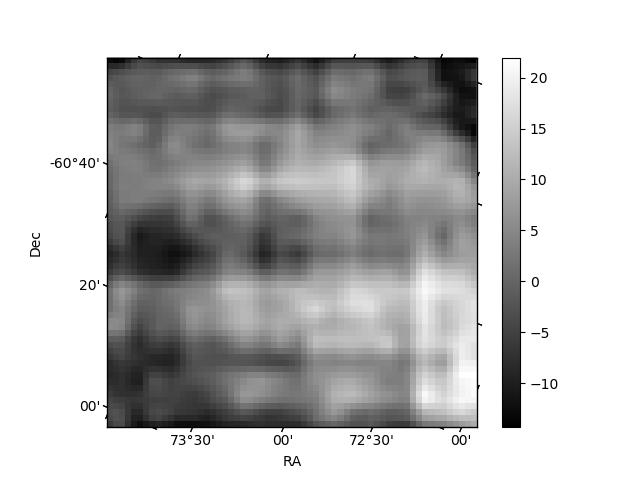
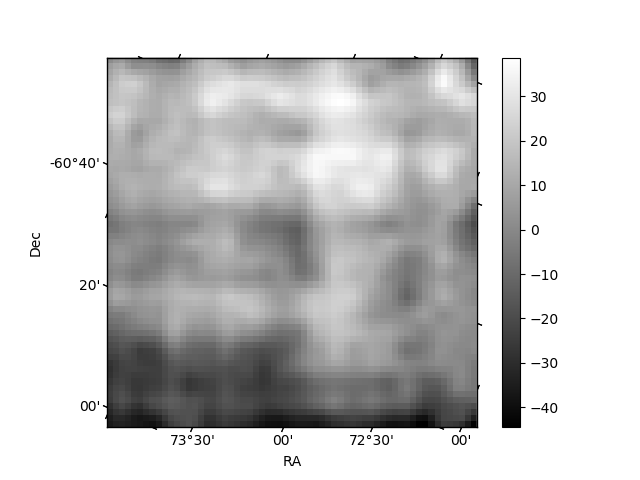
Histogram calculated using DETX and DETY for each event in the final _common_clean file
| Quadrant A | 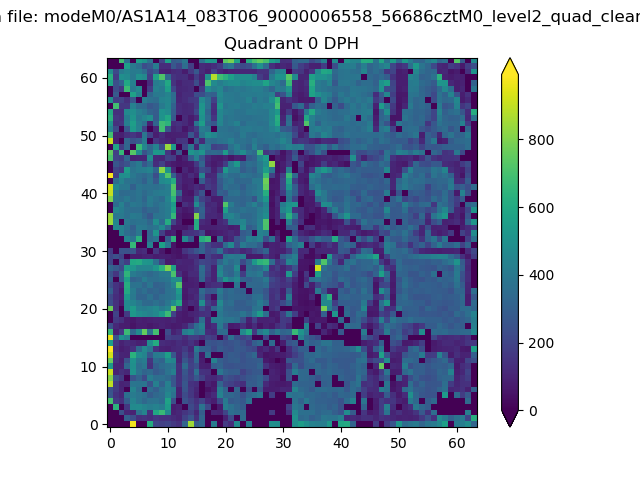 |
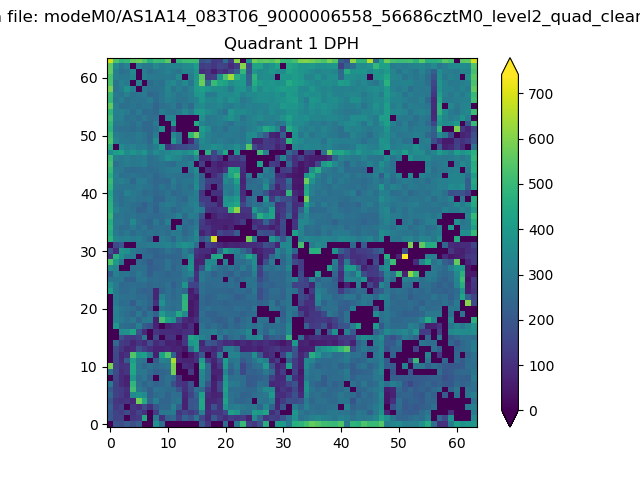 |
Quadrant B |
|---|---|---|---|
| Quadrant D | 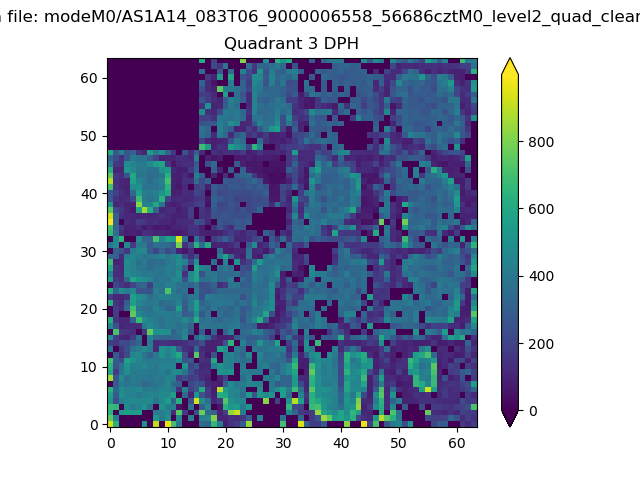 |
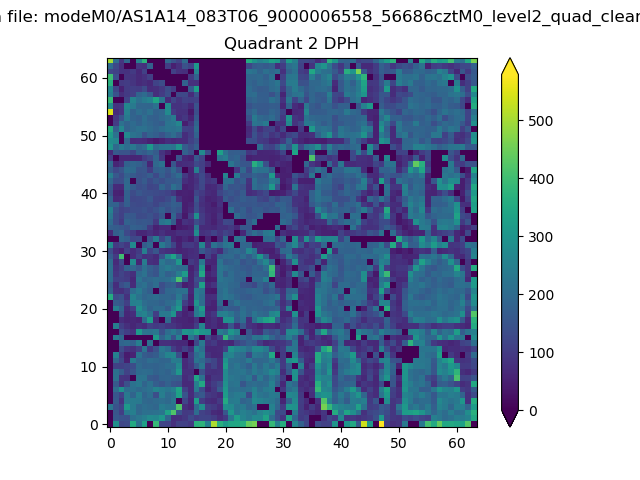 |
Quadrant C |
| Plot type | Count rate plots | Images |
|---|---|---|
| Comparison with Poisson distribution Blue bars denote a histogram of data divided into 1 sec bins. Red curve is a Poisson curve with rate = median count rate of data. |
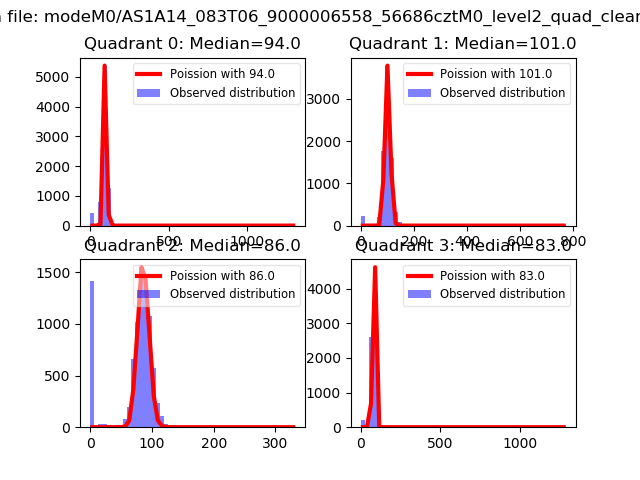 |
 |
| Quadrant-wise count rates Data is divided into 100 sec bins |
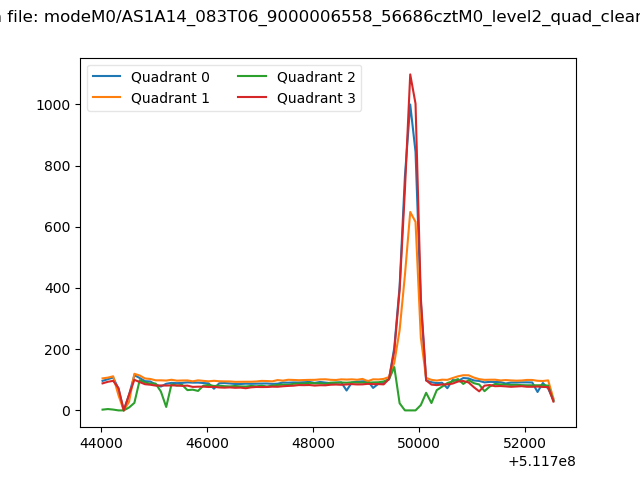 |
|
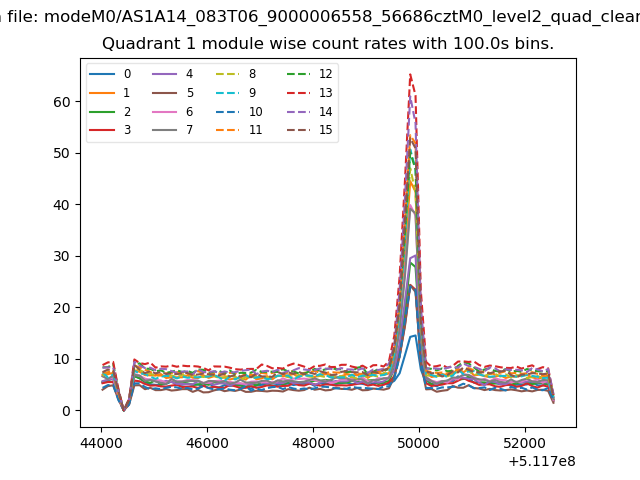
| Module-wise count rates for Quadrant A Data is divided into 100 sec bins |
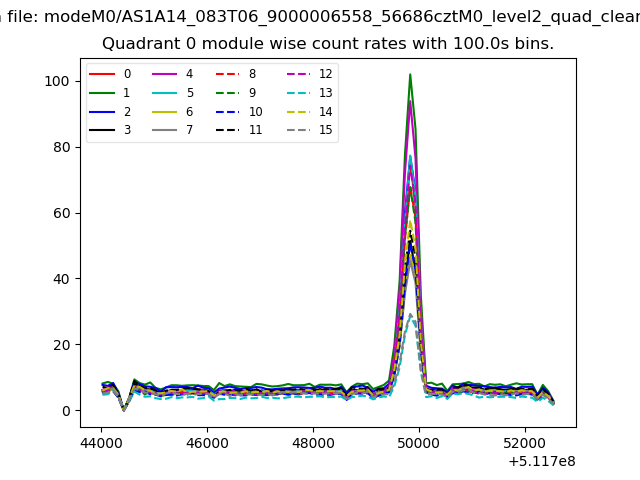 |
 |
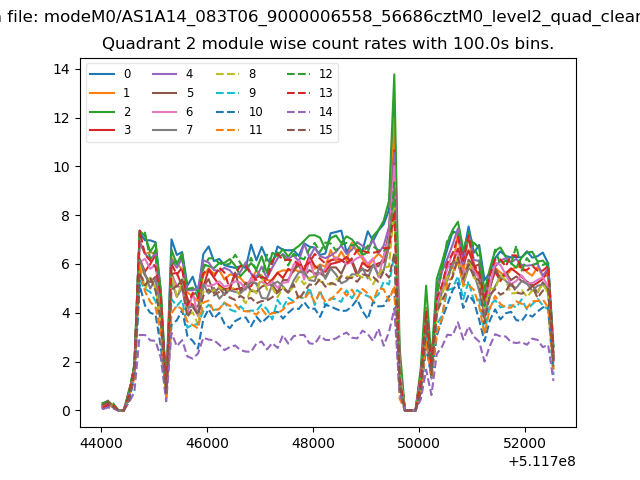
| Module-wise count rates for Quadrant B Data is divided into 100 sec bins |
 |
 |
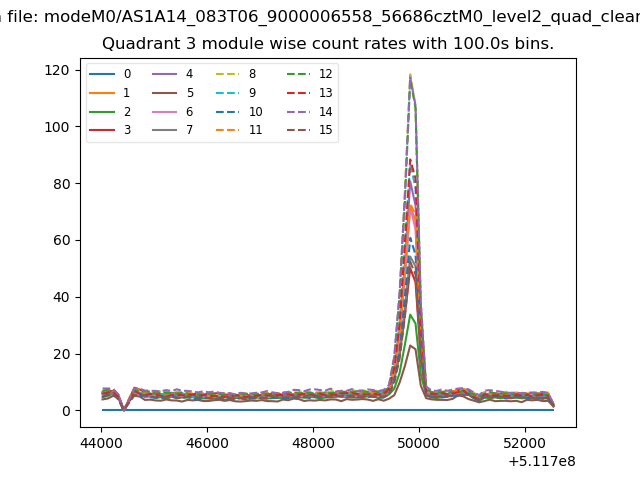
| Module-wise count rates for Quadrant C Data is divided into 100 sec bins |
 |
 |
| Module-wise count rates for Quadrant D Data is divided into 100 sec bins |
 |
 |
| Parameter | Plot |
|---|---|
| CZT HV Monitor | 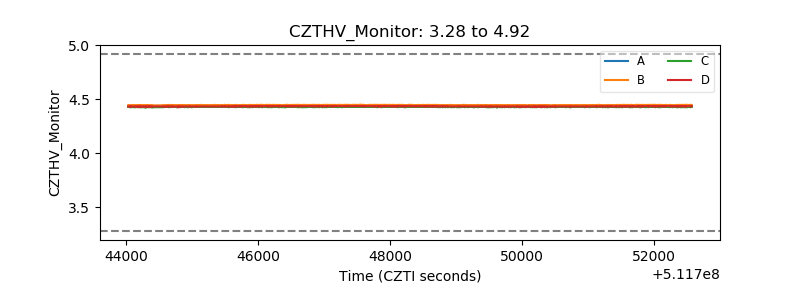 |
| D_VDD | 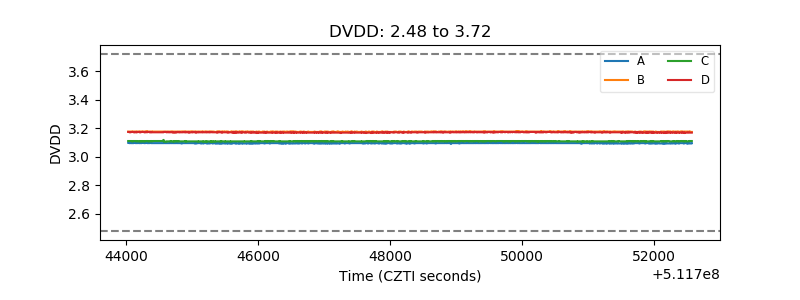 |
| Temperature 1 | 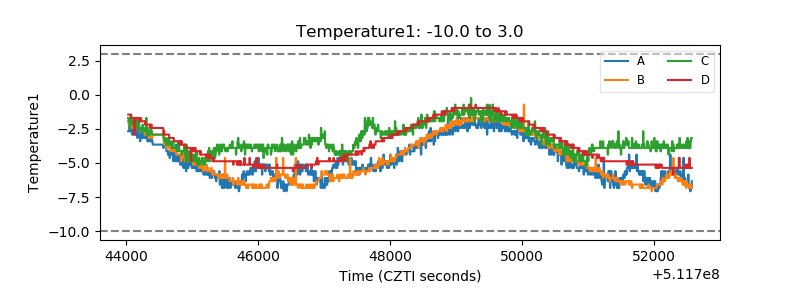 |
| Veto HV Monitor | 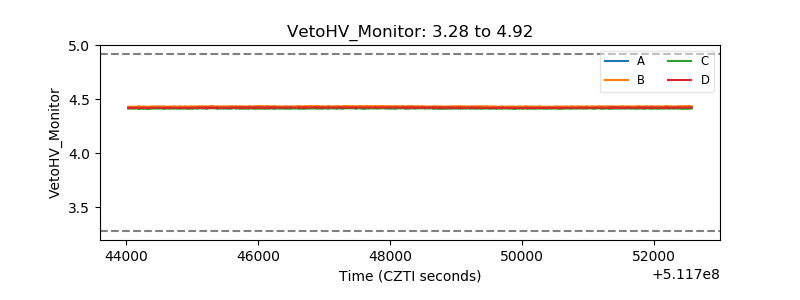 |
| Veto LLD | 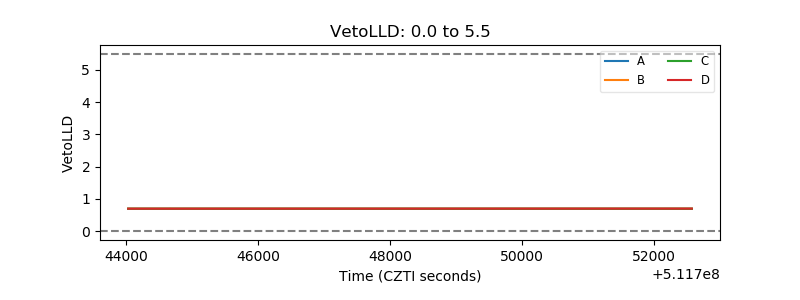 |
| Alpha Counter | 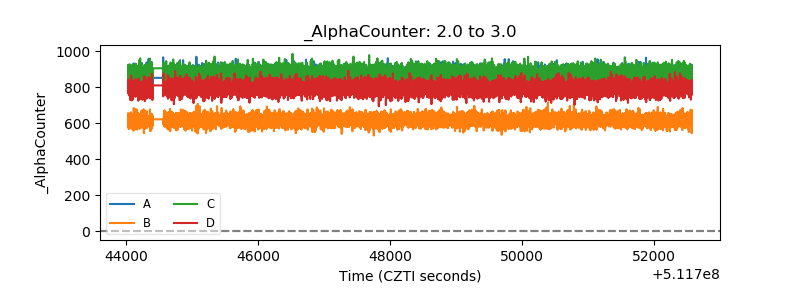 |
| _CPM_Rate | 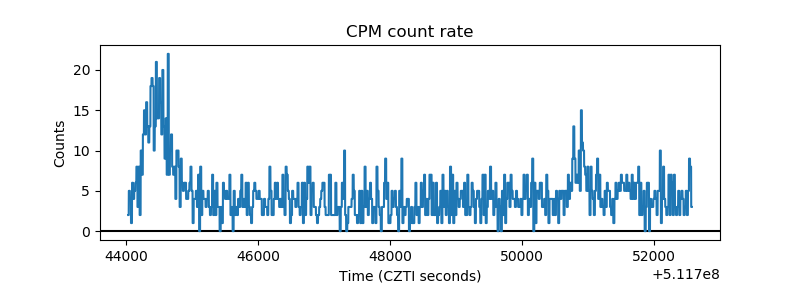 |
| CZT Counter | 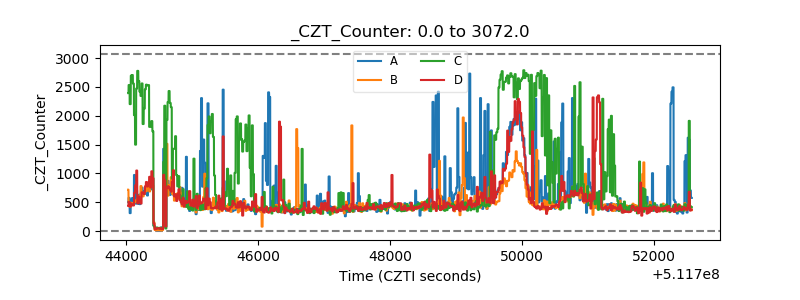 |
| +2.5 Volts monitor |  |
| +5 Volts monitor |  |
| _ROLL_ROT | 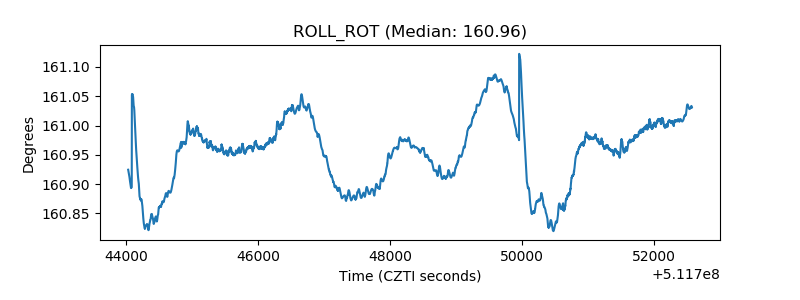 |
| _Roll_DEC | 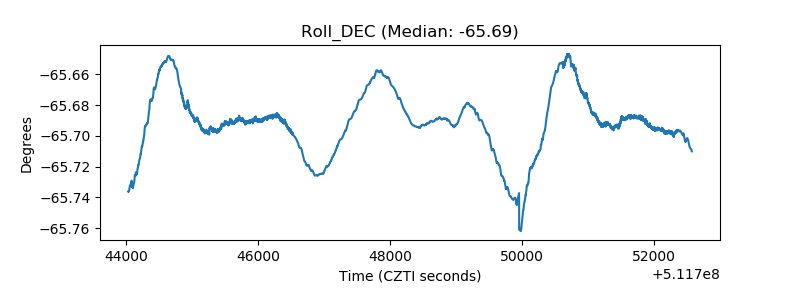 |
| _Roll_RA | 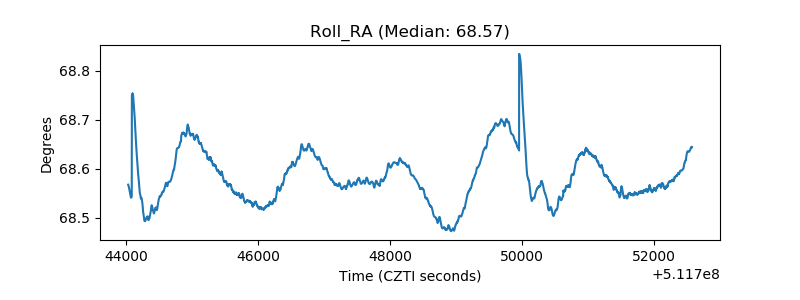 |
| Veto Counter | 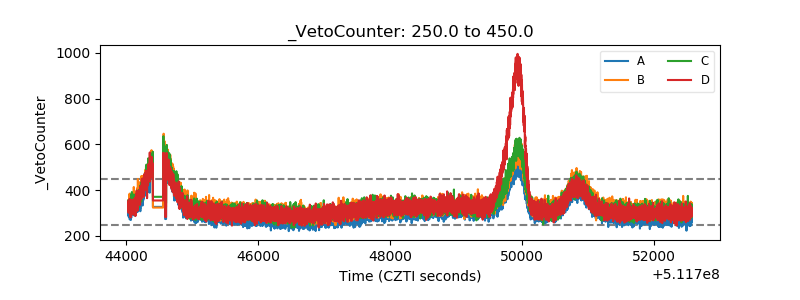 |