| Param | Original file | Final file |
|---|---|---|
| Filename | modeM0/AS1A14_083T06_9000006558_56687cztM0_level2.fits | modeM0/AS1A14_083T06_9000006558_56687cztM0_level2_quad_clean.evt |
| Size (bytes) | 531,806,400 | 111,225,600 |
| Size | 507.2 MB | 106.1 MB |
| Events in quadrant A | 4,960,876 | 732,717 |
| Events in quadrant B | 3,710,855 | 799,307 |
| Events in quadrant C | 5,098,146 | 650,936 |
| Events in quadrant D | 5,306,545 | 639,138 |
| Mode SS | |||
|---|---|---|---|
| Quadrant | BADHDUFLAG | Total packets | Discarded packets |
| A | 0 | 158 | 0 |
| B | 0 | 158 | 0 |
| C | 0 | 158 | 0 |
| D | 0 | 158 | 0 |
| Mode M0 | |||
|---|---|---|---|
| Quadrant | BADHDUFLAG | Total packets | Discarded packets |
| A | 0 | 20535 | 0 |
| B | 0 | 16756 | 0 |
| C | 0 | 21027 | 0 |
| D | 0 | 21621 | 0 |
| Quadrant | Total seconds | Saturated seconds | Saturation percentage |
|---|---|---|---|
| A | 7842 | 264 | 3.366488% |
| B | 7842 | 67 | 0.854374% |
| C | 7843 | 638 | 8.134642% |
| D | 7843 | 419 | 5.342343% |
Noise dominated data is calculated using 1-second bins in cleaned event files. If a bin has >2000 counts, and if more than 50% of those come from <1% of pixels, then it is considered to be noise-dominated and hence unusable.
| Quadrant | # 1 sec bins | Bins with >0 counts | Bins with >2000 counts | High rate bins dominated by noise | Noise dominated (total time) | Noise dominated (detector-on time) | Marked lightcurve |
|---|---|---|---|---|---|---|---|
| A | 7842 | 7842 | 226 | 226 | 2.88% | 2.88% | 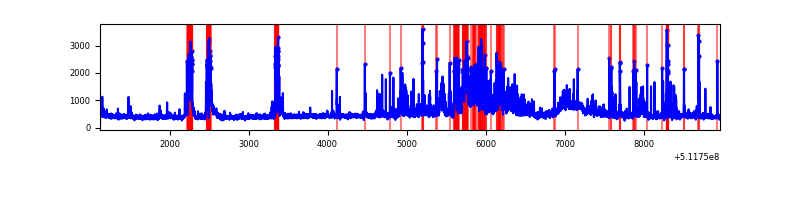 |
| B | 7842 | 7842 | 10 | 10 | 0.13% | 0.13% | 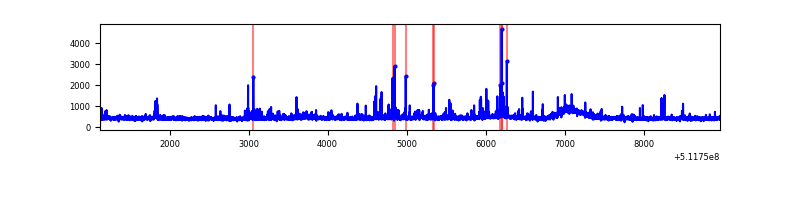 |
| C | 7843 | 7843 | 390 | 390 | 4.97% | 4.97% |  |
| D | 7843 | 7843 | 390 | 390 | 4.97% | 4.97% | 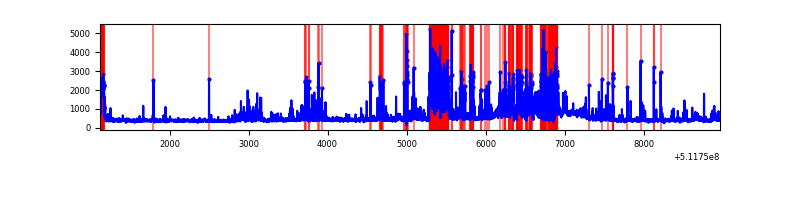 |
Top three noisy pixels from each quadrant. If the there are fewer than three noisy pixels in the level2.evt file, extra rows are filled as -1
| Pixel properties | Quadrant properties | ||||||
|---|---|---|---|---|---|---|---|
| Quadrant | DetID | PixID | Counts | Sigma | Mean | Median | Sigma |
| A | 7 | 64 | 924496 | 4536.91 | 826 | 804 | 203.6 |
| A | 8 | 26 | 517091 | 2535.86 | 826 | 804 | 203.6 |
| A | 3 | 62 | 172431 | 842.98 | 826 | 804 | 203.6 |
| B | 4 | 21 | 192185 | 1085.13 | 830 | 800 | 176.4 |
| B | 8 | 128 | 60675 | 339.48 | 830 | 800 | 176.4 |
| B | 0 | 245 | 52423 | 292.7 | 830 | 800 | 176.4 |
| C | 15 | 215 | 1042211 | 4919.43 | 782 | 777 | 211.7 |
| C | 13 | 3 | 595456 | 2809.09 | 782 | 777 | 211.7 |
| C | 15 | 230 | 113627 | 533.07 | 782 | 777 | 211.7 |
| D | 2 | 249 | 1203645 | 5435.05 | 789 | 754 | 221.3 |
| D | 8 | 240 | 390352 | 1760.33 | 789 | 754 | 221.3 |
| D | 0 | 160 | 140742 | 632.51 | 789 | 754 | 221.3 |
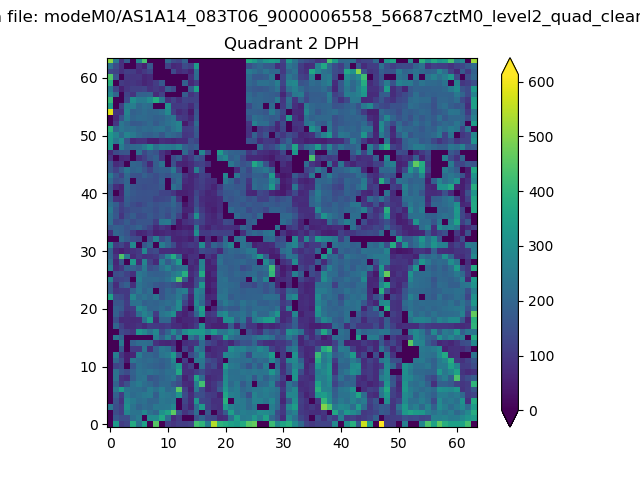
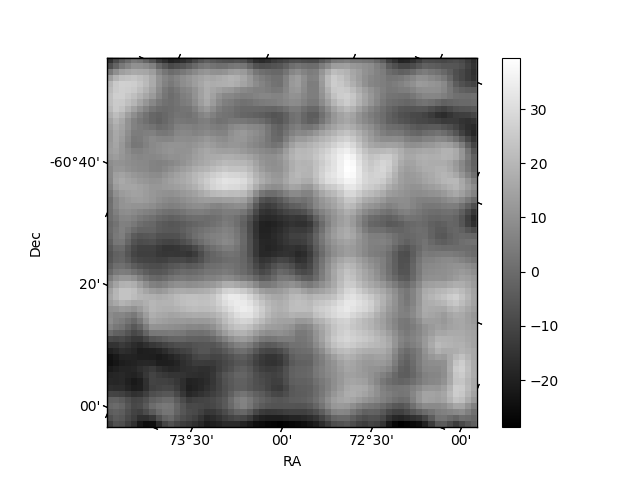
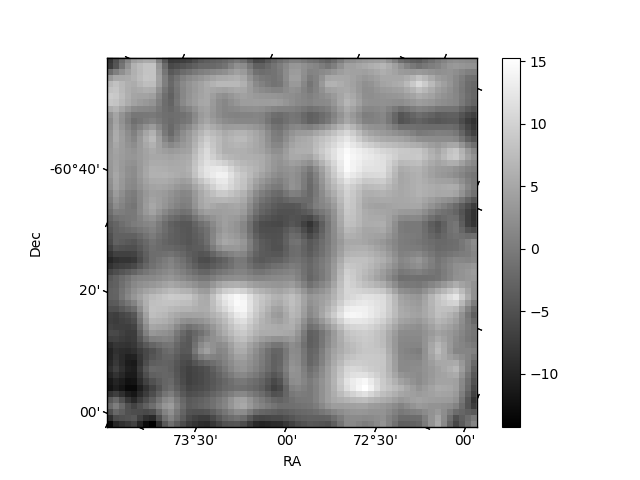
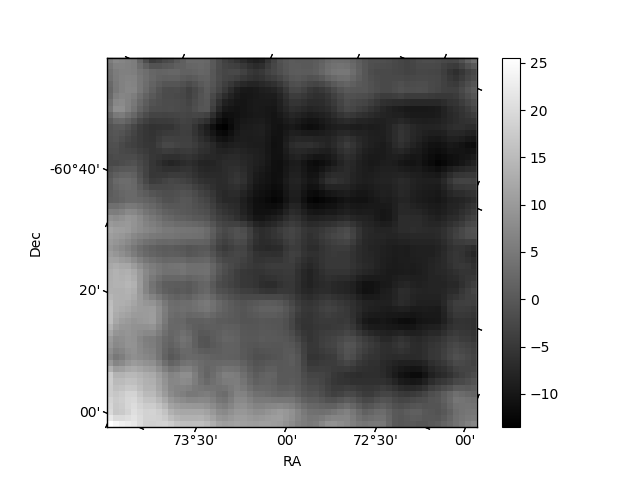
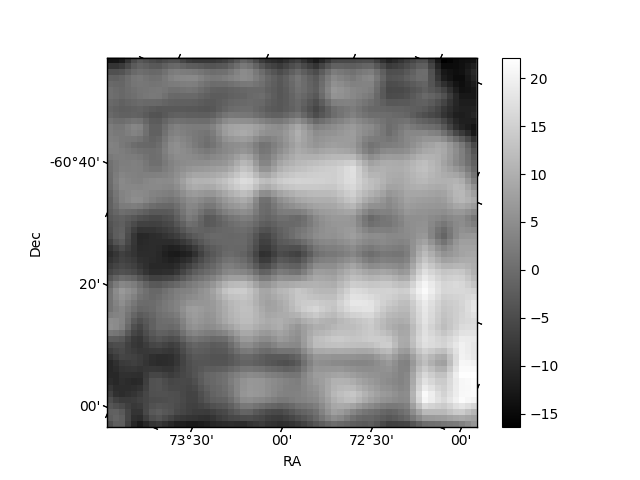
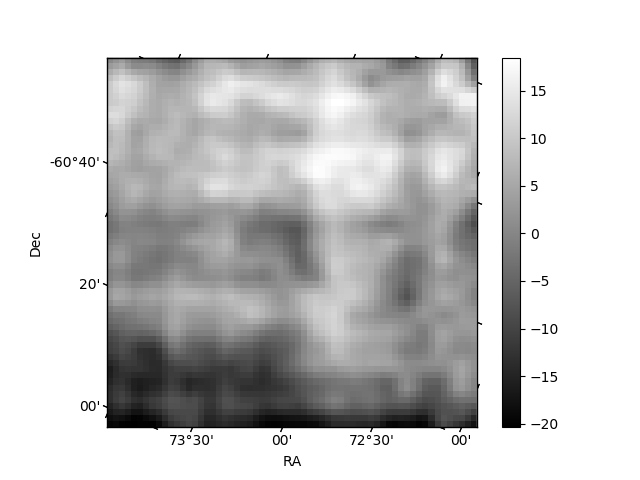
Histogram calculated using DETX and DETY for each event in the final _common_clean file
| Quadrant A | 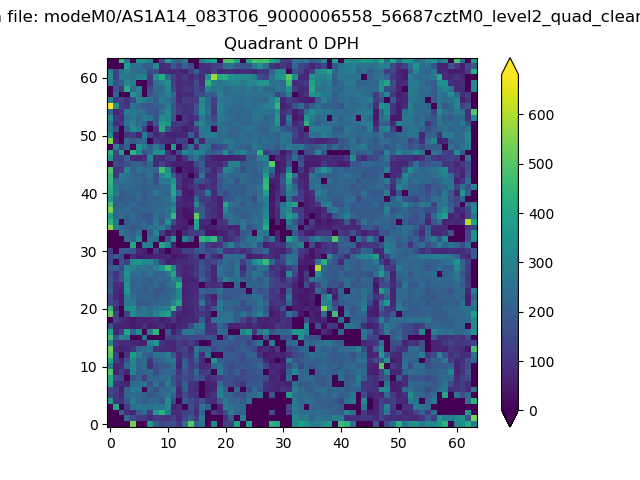 |
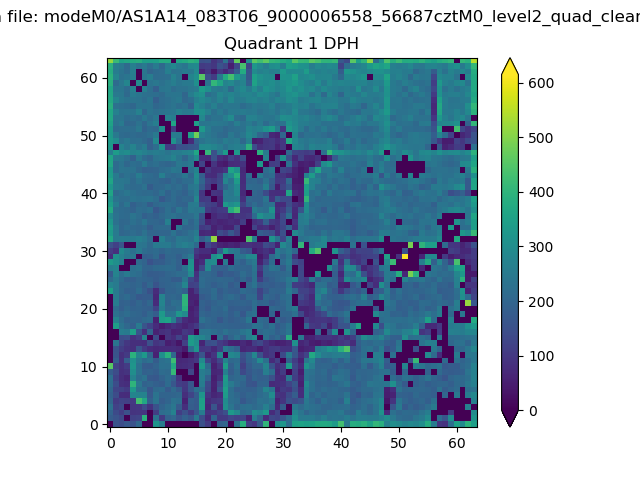 |
Quadrant B |
|---|---|---|---|
| Quadrant D | 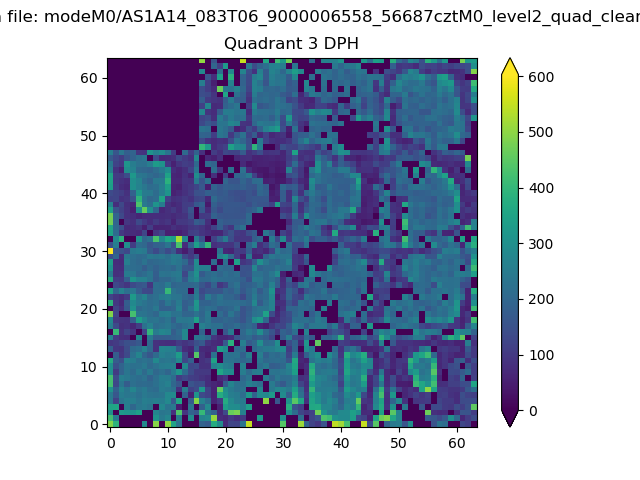 |
 |
Quadrant C |
| Plot type | Count rate plots | Images |
|---|---|---|
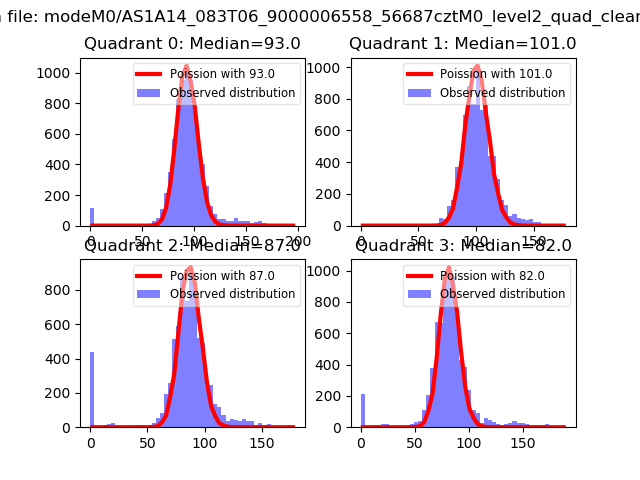
| Comparison with Poisson distribution Blue bars denote a histogram of data divided into 1 sec bins. Red curve is a Poisson curve with rate = median count rate of data. |
 |
 |
| Quadrant-wise count rates Data is divided into 100 sec bins |
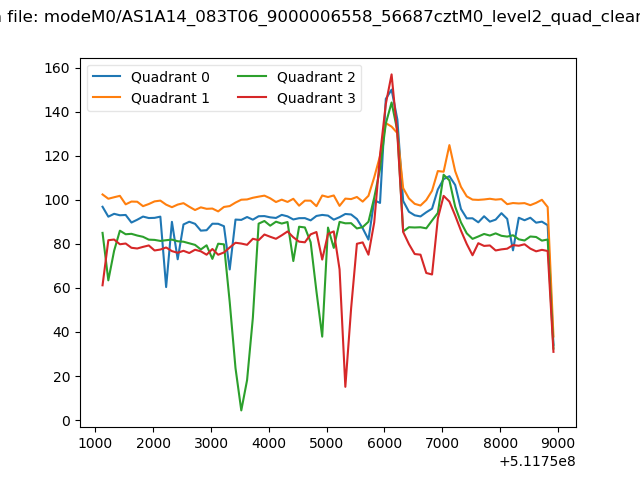 |
|
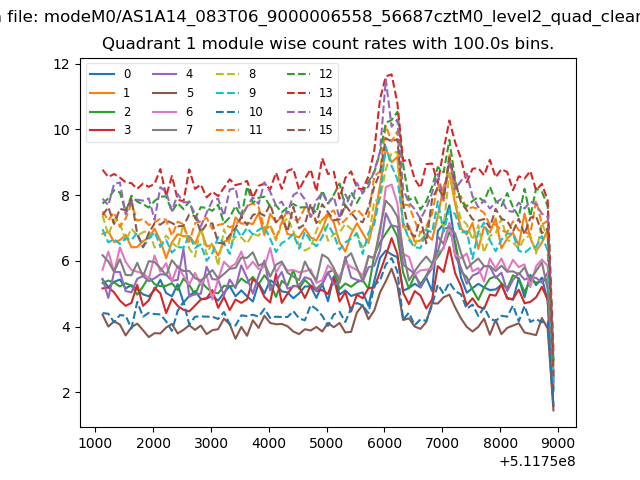
| Module-wise count rates for Quadrant A Data is divided into 100 sec bins |
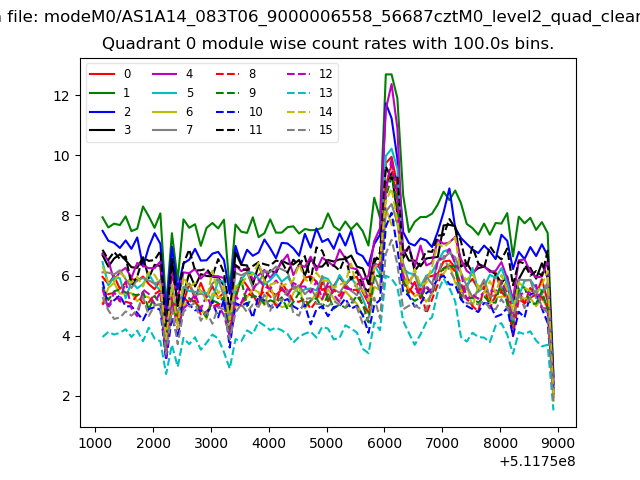 |
 |
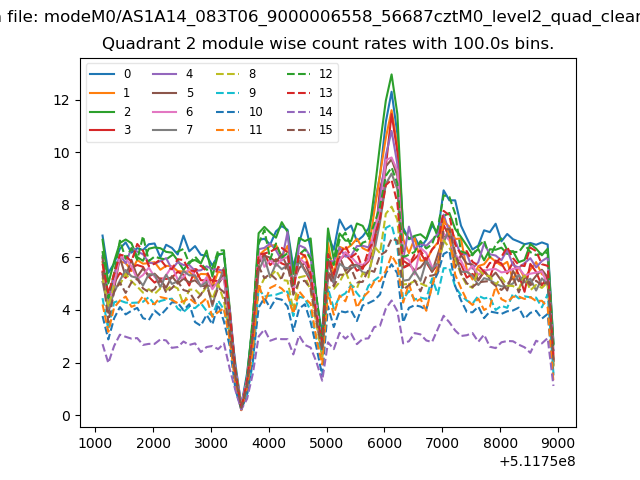
| Module-wise count rates for Quadrant B Data is divided into 100 sec bins |
 |
 |
| Module-wise count rates for Quadrant C Data is divided into 100 sec bins |
 |
 |
| Module-wise count rates for Quadrant D Data is divided into 100 sec bins |
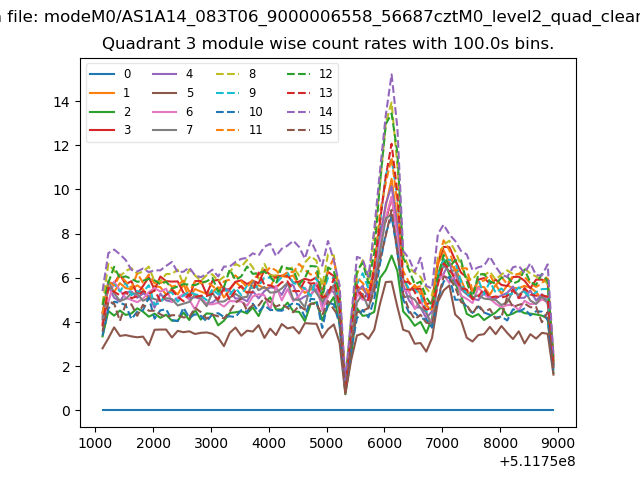 |
 |
| Parameter | Plot |
|---|---|
| CZT HV Monitor | 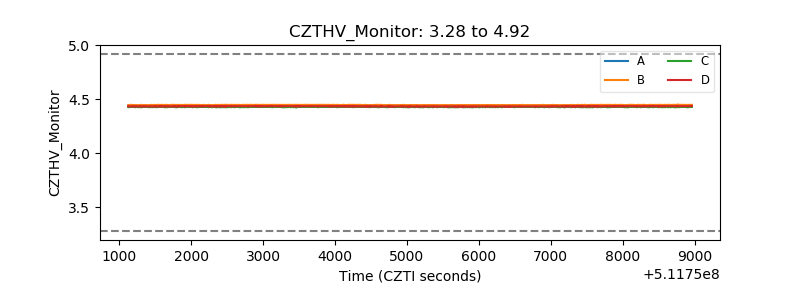 |
| D_VDD | 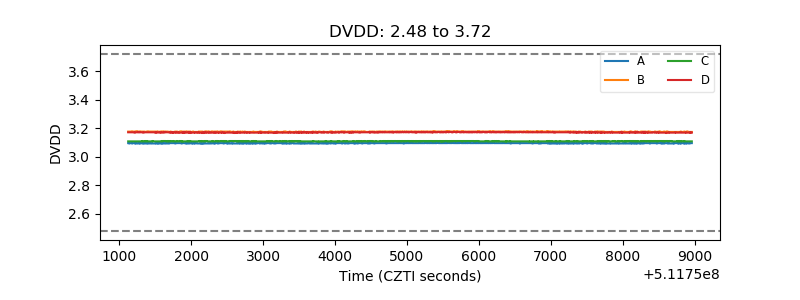 |
| Temperature 1 | 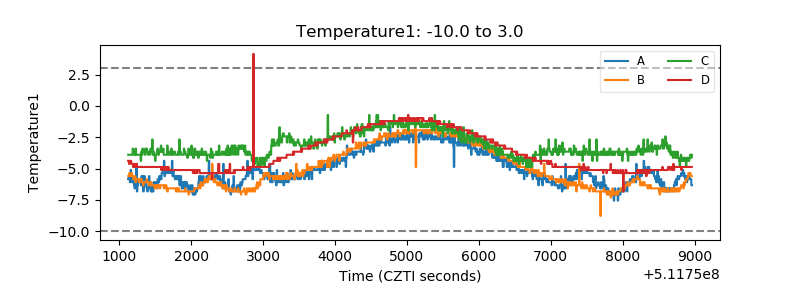 |
| Veto HV Monitor | 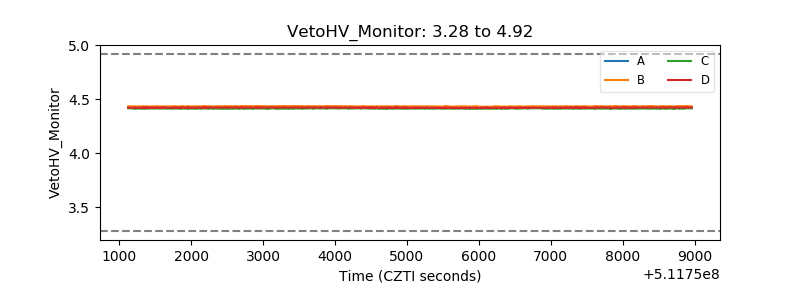 |
| Veto LLD | 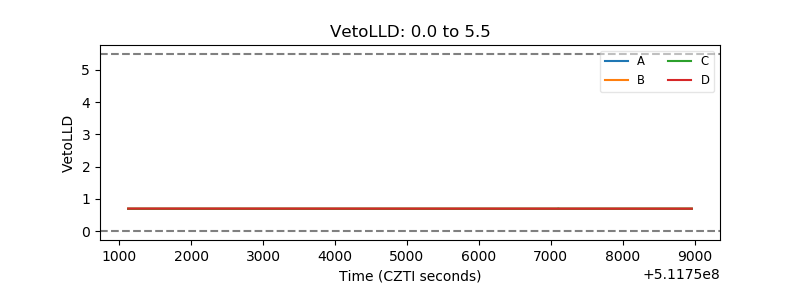 |
| Alpha Counter | 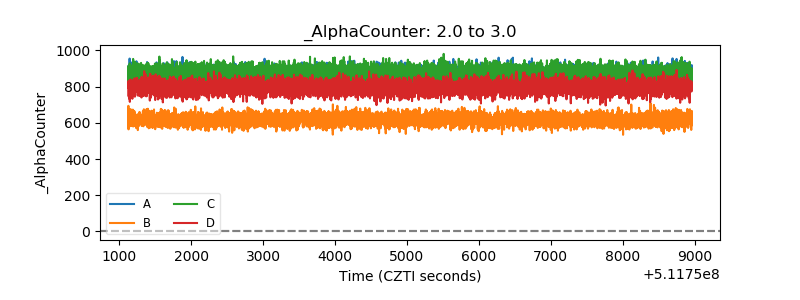 |
| _CPM_Rate | 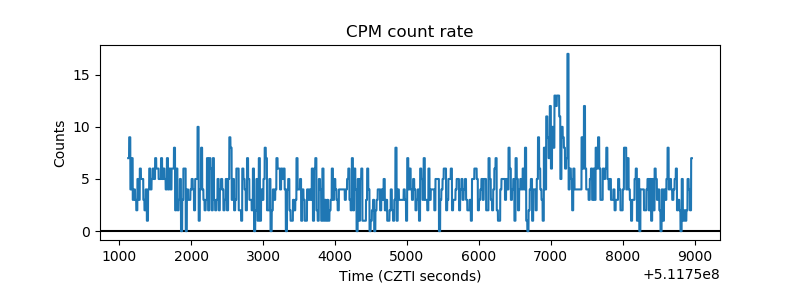 |
| CZT Counter | 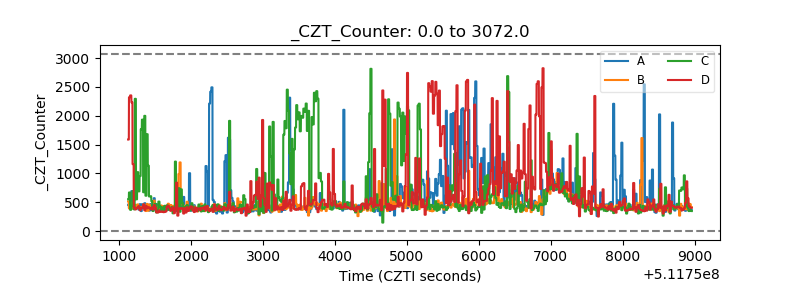 |
| +2.5 Volts monitor |  |
| +5 Volts monitor |  |
| _ROLL_ROT | 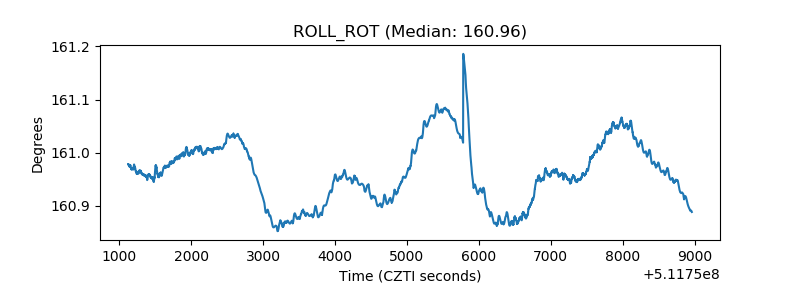 |
| _Roll_DEC | 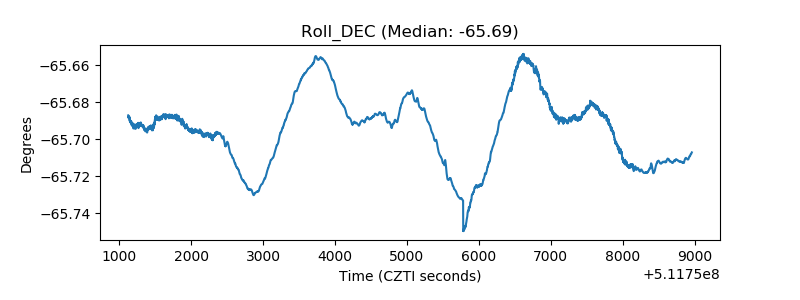 |
| _Roll_RA | 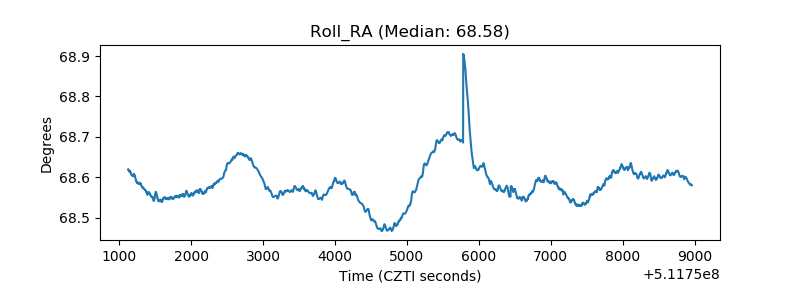 |
| Veto Counter | 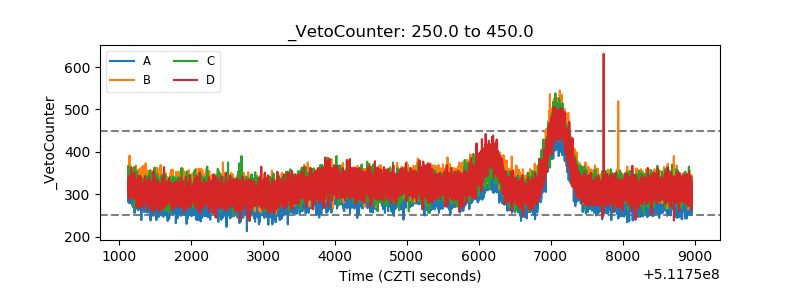 |