| Param | Original file | Final file |
|---|---|---|
| Filename | modeM0/AS1A14_083T06_9000006558_56694cztM0_level2.fits | modeM0/AS1A14_083T06_9000006558_56694cztM0_level2_quad_clean.evt |
| Size (bytes) | 462,222,720 | 93,237,120 |
| Size | 440.8 MB | 88.9 MB |
| Events in quadrant A | 3,551,380 | 631,135 |
| Events in quadrant B | 2,964,723 | 665,299 |
| Events in quadrant C | 6,426,039 | 509,722 |
| Events in quadrant D | 3,678,913 | 578,463 |
| Mode SS | |||
|---|---|---|---|
| Quadrant | BADHDUFLAG | Total packets | Discarded packets |
| A | 0 | 128 | 0 |
| B | 0 | 128 | 0 |
| C | 0 | 128 | 0 |
| D | 0 | 128 | 0 |
| Mode M9 | |||
|---|---|---|---|
| Quadrant | BADHDUFLAG | Total packets | Discarded packets |
| A | 0 | 10 | 0 |
| B | 0 | 10 | 0 |
| C | 0 | 10 | 0 |
| D | 0 | 10 | 0 |
| Mode M0 | |||
|---|---|---|---|
| Quadrant | BADHDUFLAG | Total packets | Discarded packets |
| A | 0 | 15087 | 1 |
| B | 0 | 13426 | 1 |
| C | 0 | 23587 | 1 |
| D | 0 | 15512 | 1 |
| Quadrant | Total seconds | Saturated seconds | Saturation percentage |
|---|---|---|---|
| A | 6281 | 164 | 2.611049% |
| B | 6281 | 127 | 2.021971% |
| C | 6282 | 1329 | 21.155683% |
| D | 6282 | 178 | 2.833493% |
Noise dominated data is calculated using 1-second bins in cleaned event files. If a bin has >2000 counts, and if more than 50% of those come from <1% of pixels, then it is considered to be noise-dominated and hence unusable.
| Quadrant | # 1 sec bins | Bins with >0 counts | Bins with >2000 counts | High rate bins dominated by noise | Noise dominated (total time) | Noise dominated (detector-on time) | Marked lightcurve |
|---|---|---|---|---|---|---|---|
| A | 7311 | 6282 | 57 | 57 | 0.78% | 0.91% | 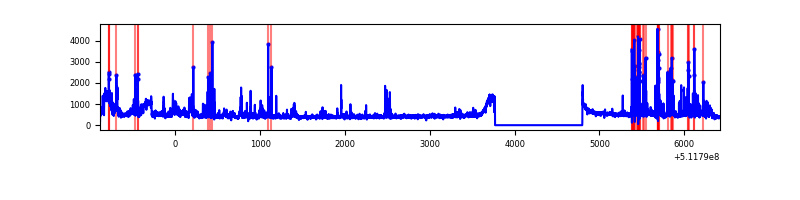 |
| B | 7311 | 6282 | 25 | 25 | 0.34% | 0.40% | 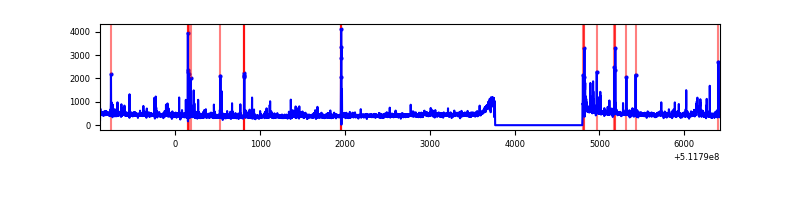 |
| C | 7311 | 6282 | 1202 | 1202 | 16.44% | 19.13% | 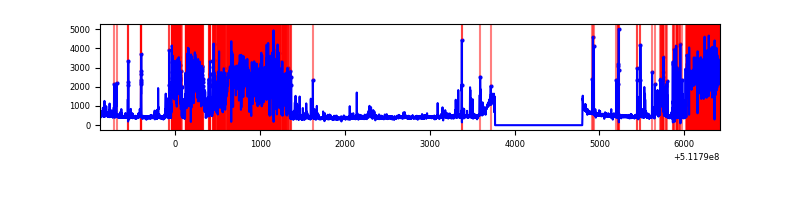 |
| D | 7312 | 6283 | 99 | 99 | 1.35% | 1.58% | 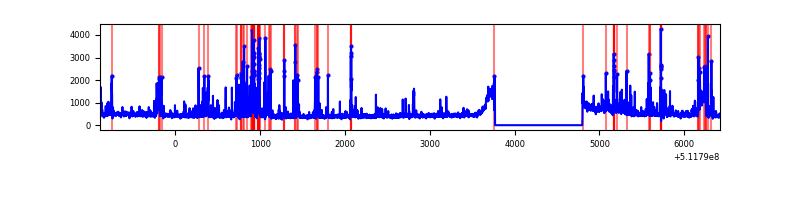 |
Top three noisy pixels from each quadrant. If the there are fewer than three noisy pixels in the level2.evt file, extra rows are filled as -1
| Pixel properties | Quadrant properties | ||||||
|---|---|---|---|---|---|---|---|
| Quadrant | DetID | PixID | Counts | Sigma | Mean | Median | Sigma |
| A | 3 | 62 | 295824 | 1683.65 | 692 | 674 | 175.3 |
| A | 3 | 14 | 252567 | 1436.89 | 692 | 674 | 175.3 |
| A | 10 | 251 | 117994 | 669.24 | 692 | 674 | 175.3 |
| B | 10 | 16 | 48992 | 334.23 | 676 | 654 | 144.6 |
| B | 0 | 245 | 42243 | 287.57 | 676 | 654 | 144.6 |
| B | 10 | 247 | 36797 | 249.91 | 676 | 654 | 144.6 |
| C | 15 | 230 | 3188522 | 18194.4 | 613 | 606 | 175.2 |
| C | 13 | 3 | 357093 | 2034.58 | 613 | 606 | 175.2 |
| C | 6 | 223 | 128565 | 730.3 | 613 | 606 | 175.2 |
| D | 2 | 249 | 350384 | 1800.47 | 674 | 644 | 194.2 |
| D | 10 | 199 | 157368 | 806.82 | 674 | 644 | 194.2 |
| D | 3 | 12 | 148679 | 762.09 | 674 | 644 | 194.2 |
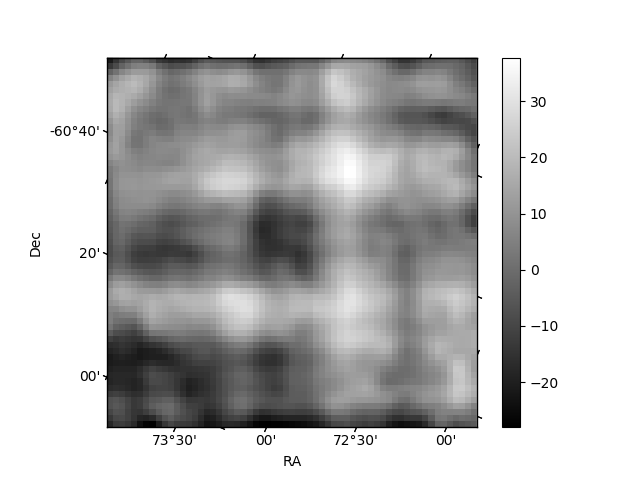
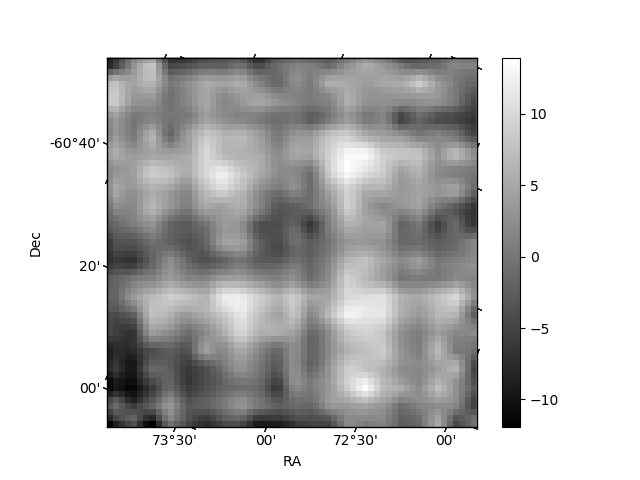
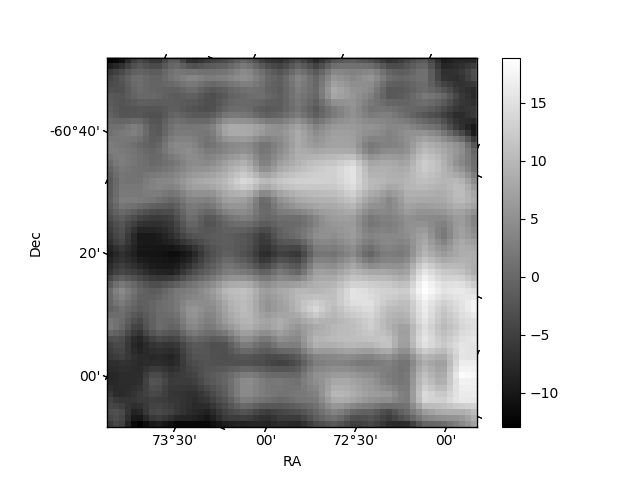
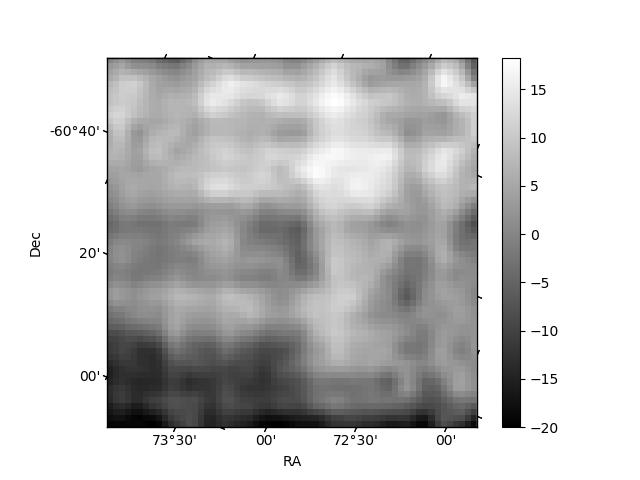
Histogram calculated using DETX and DETY for each event in the final _common_clean file
| Quadrant A | 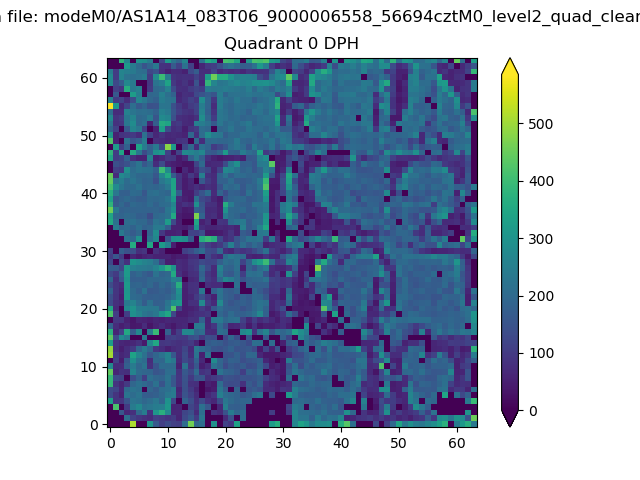 |
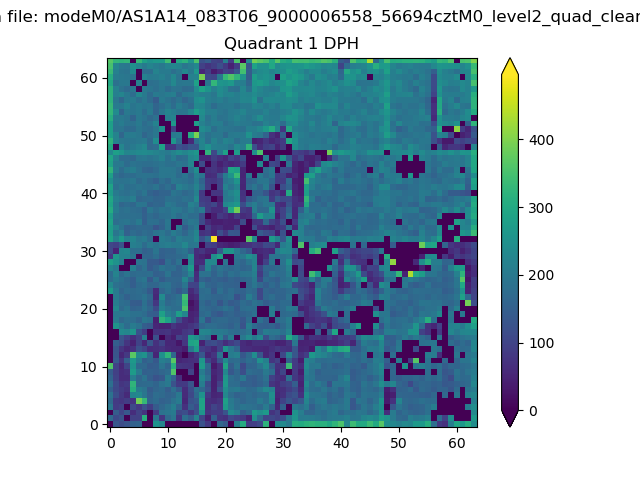 |
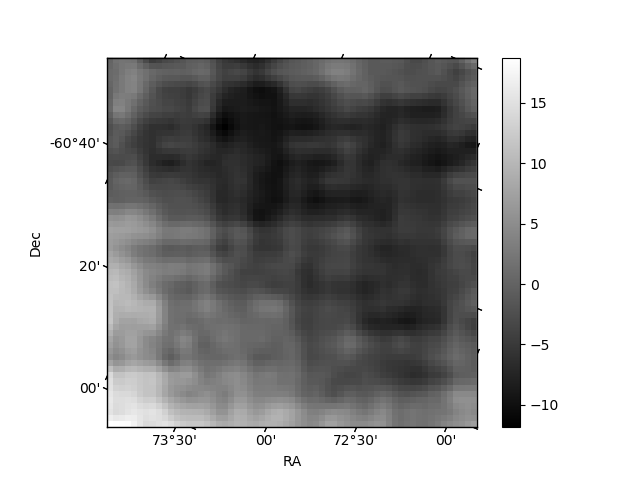
Quadrant B |
|---|---|---|---|
| Quadrant D | 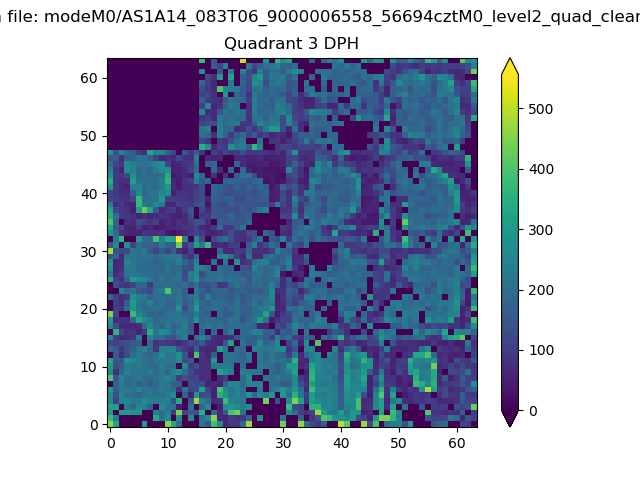 |
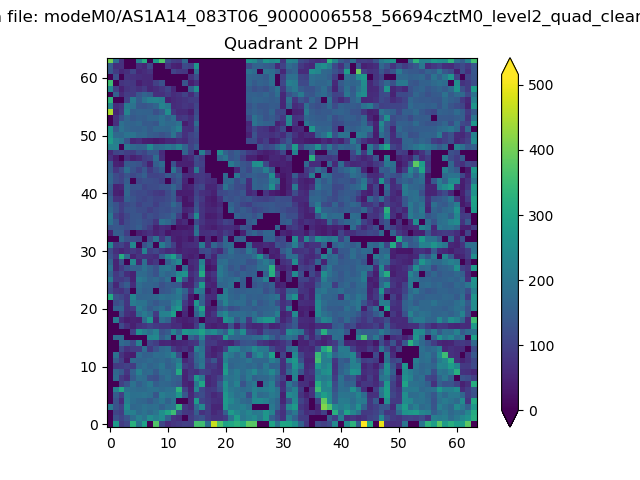 |
Quadrant C |
| Plot type | Count rate plots | Images |
|---|---|---|
| Comparison with Poisson distribution Blue bars denote a histogram of data divided into 1 sec bins. Red curve is a Poisson curve with rate = median count rate of data. |
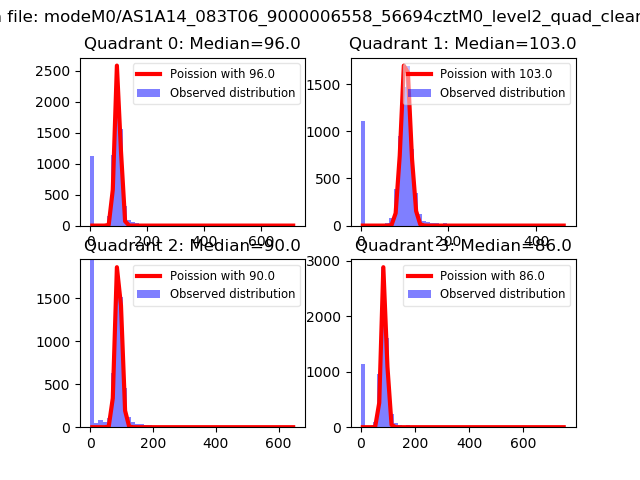 |
 |
| Quadrant-wise count rates Data is divided into 100 sec bins |
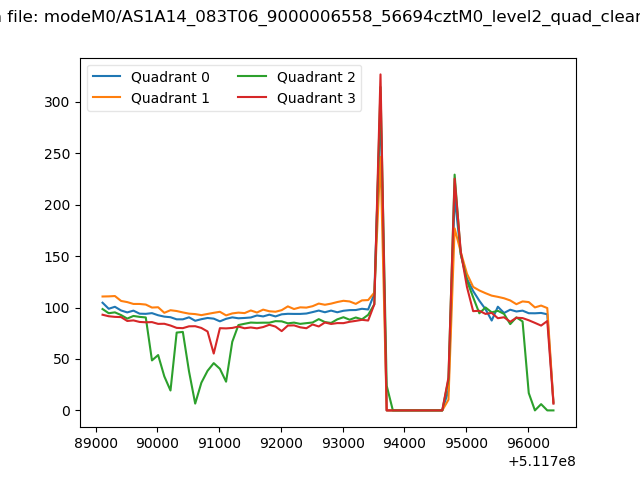 |
|
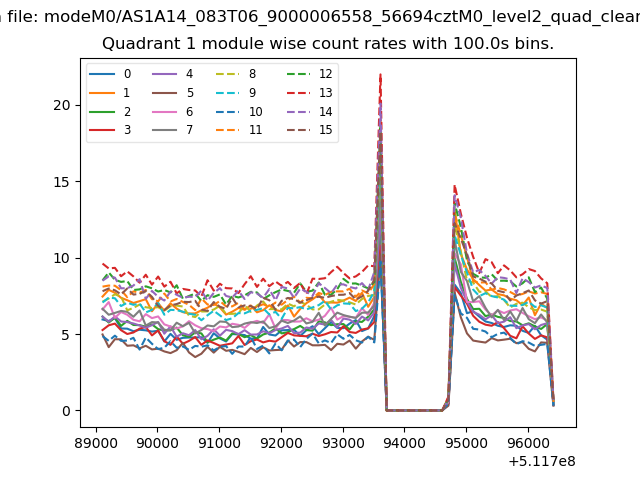
| Module-wise count rates for Quadrant A Data is divided into 100 sec bins |
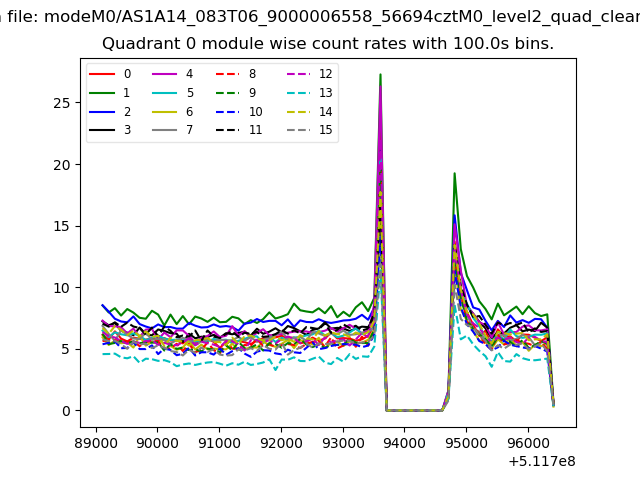 |
 |
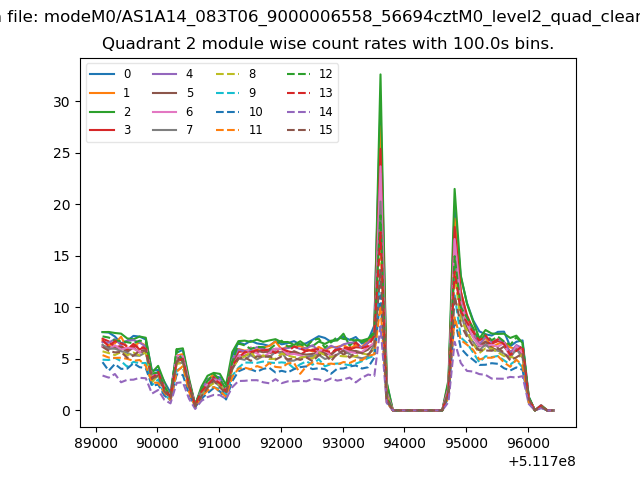
| Module-wise count rates for Quadrant B Data is divided into 100 sec bins |
 |
 |
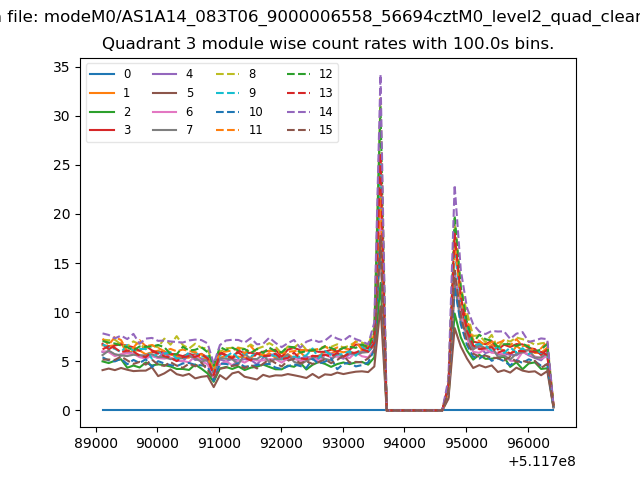
| Module-wise count rates for Quadrant C Data is divided into 100 sec bins |
 |
 |
| Module-wise count rates for Quadrant D Data is divided into 100 sec bins |
 |
 |
| Parameter | Plot |
|---|---|
| CZT HV Monitor | 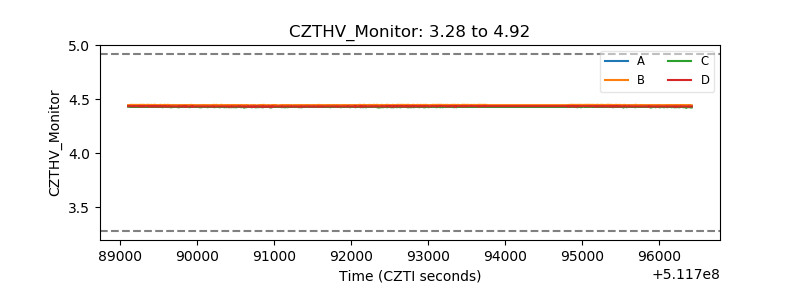 |
| D_VDD | 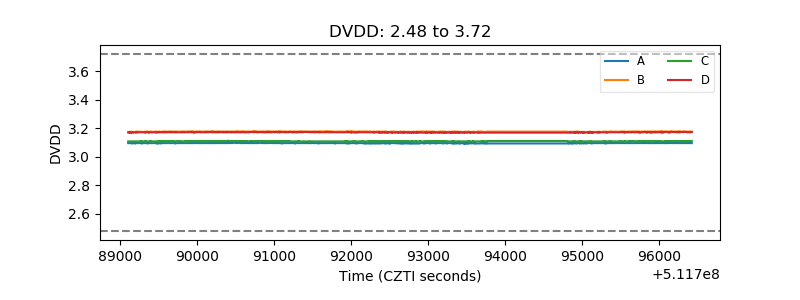 |
| Temperature 1 | 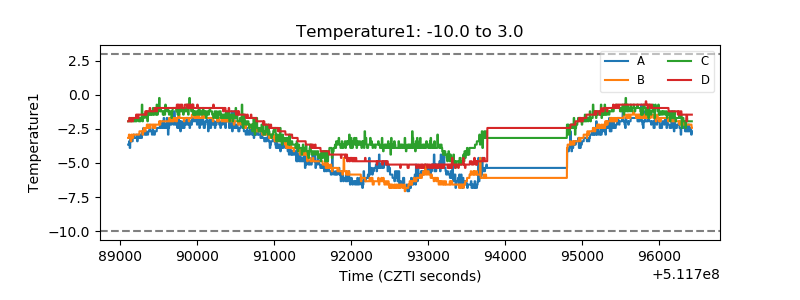 |
| Veto HV Monitor | 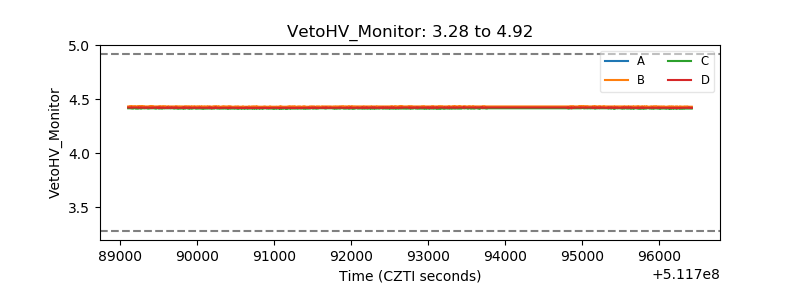 |
| Veto LLD | 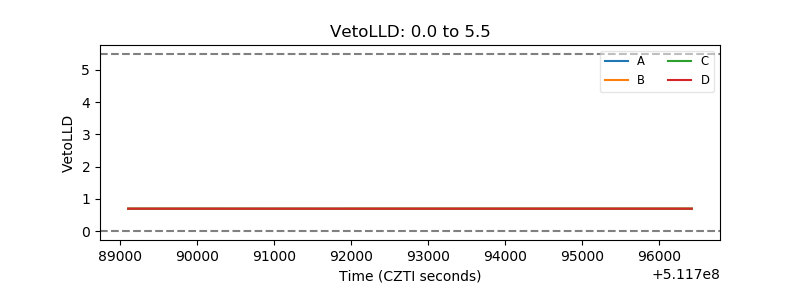 |
| Alpha Counter | 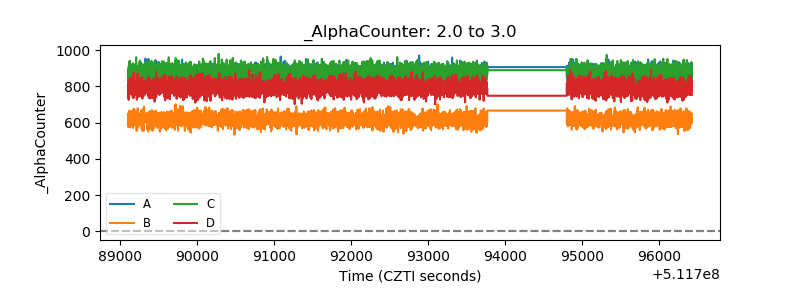 |
| _CPM_Rate | 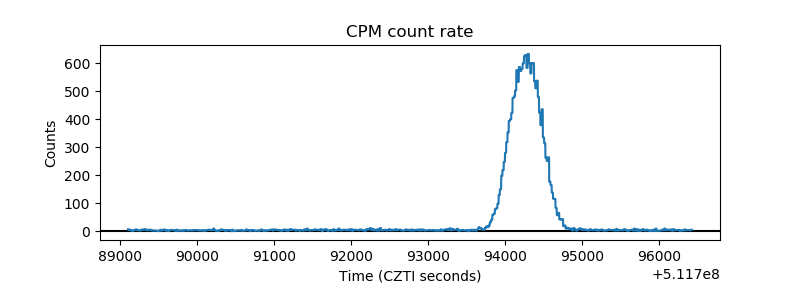 |
| CZT Counter | 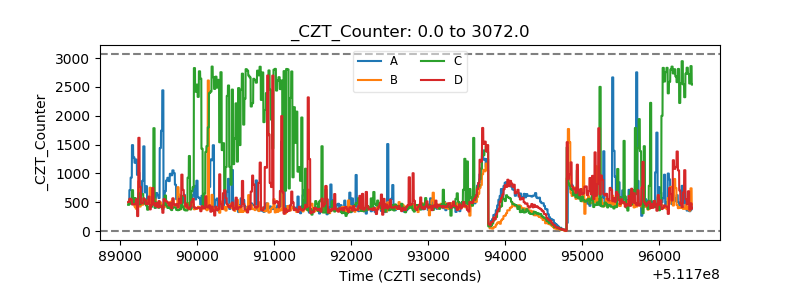 |
| +2.5 Volts monitor |  |
| +5 Volts monitor |  |
| _ROLL_ROT | 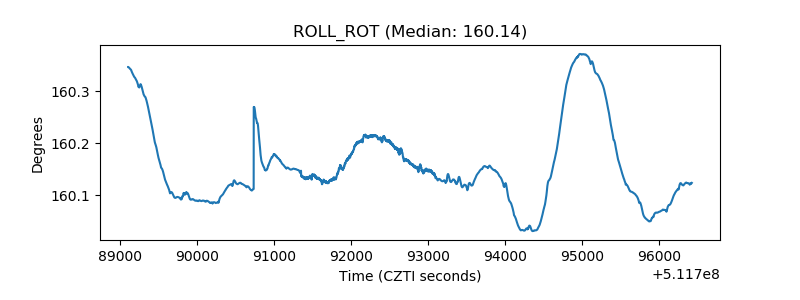 |
| _Roll_DEC | 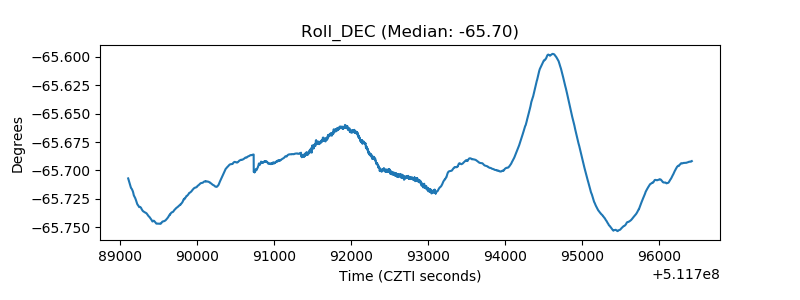 |
| _Roll_RA | 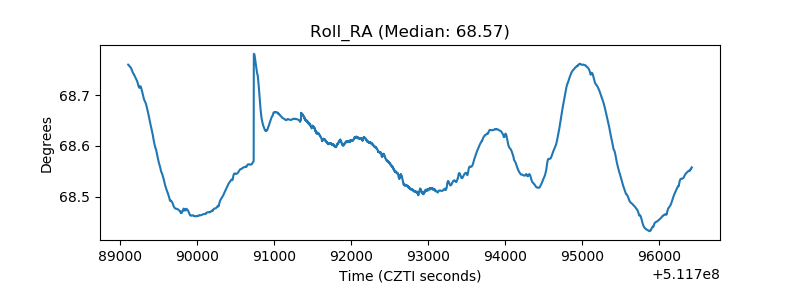 |
| Veto Counter | 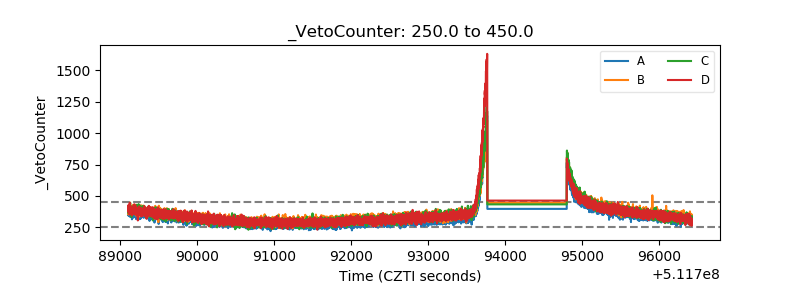 |