| Param | Original file | Final file |
|---|---|---|
| Filename | modeM0/AS1A14_083T06_9000006558_56695cztM0_level2.fits | modeM0/AS1A14_083T06_9000006558_56695cztM0_level2_quad_clean.evt |
| Size (bytes) | 479,600,640 | 85,685,760 |
| Size | 457.4 MB | 81.7 MB |
| Events in quadrant A | 3,318,157 | 586,239 |
| Events in quadrant B | 3,000,364 | 630,073 |
| Events in quadrant C | 7,525,707 | 425,640 |
| Events in quadrant D | 3,436,390 | 528,318 |
| Mode SS | |||
|---|---|---|---|
| Quadrant | BADHDUFLAG | Total packets | Discarded packets |
| A | 0 | 124 | 0 |
| B | 0 | 124 | 0 |
| C | 0 | 124 | 0 |
| D | 0 | 124 | 0 |
| Mode M9 | |||
|---|---|---|---|
| Quadrant | BADHDUFLAG | Total packets | Discarded packets |
| A | 0 | 11 | 0 |
| B | 0 | 11 | 0 |
| C | 0 | 11 | 0 |
| D | 0 | 11 | 0 |
| Mode M0 | |||
|---|---|---|---|
| Quadrant | BADHDUFLAG | Total packets | Discarded packets |
| A | 0 | 14194 | 1 |
| B | 0 | 13315 | 1 |
| C | 0 | 26750 | 1 |
| D | 0 | 14609 | 1 |
| Quadrant | Total seconds | Saturated seconds | Saturation percentage |
|---|---|---|---|
| A | 6073 | 166 | 2.733410% |
| B | 6074 | 143 | 2.354297% |
| C | 6074 | 1662 | 27.362529% |
| D | 6074 | 138 | 2.271979% |
Noise dominated data is calculated using 1-second bins in cleaned event files. If a bin has >2000 counts, and if more than 50% of those come from <1% of pixels, then it is considered to be noise-dominated and hence unusable.
| Quadrant | # 1 sec bins | Bins with >0 counts | Bins with >2000 counts | High rate bins dominated by noise | Noise dominated (total time) | Noise dominated (detector-on time) | Marked lightcurve |
|---|---|---|---|---|---|---|---|
| A | 7178 | 6074 | 97 | 97 | 1.35% | 1.60% | 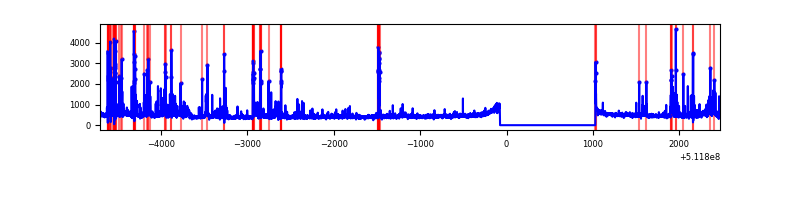 |
| B | 7179 | 6075 | 56 | 56 | 0.78% | 0.92% | 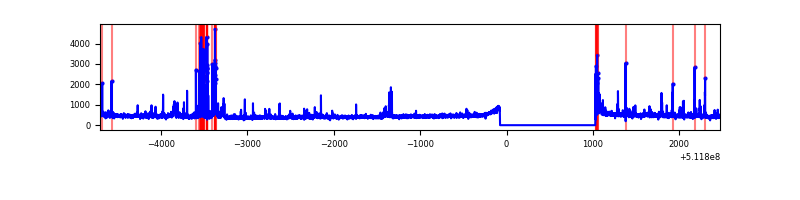 |
| C | 7179 | 6075 | 1535 | 1535 | 21.38% | 25.27% | 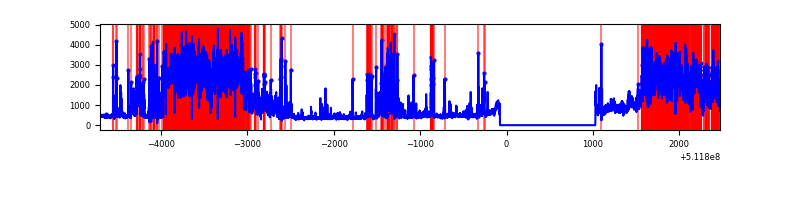 |
| D | 7179 | 6075 | 98 | 98 | 1.37% | 1.61% | 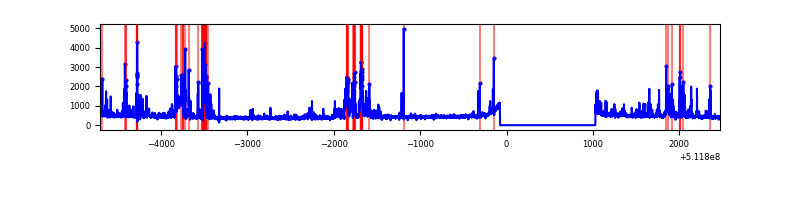 |
Top three noisy pixels from each quadrant. If the there are fewer than three noisy pixels in the level2.evt file, extra rows are filled as -1
| Pixel properties | Quadrant properties | ||||||
|---|---|---|---|---|---|---|---|
| Quadrant | DetID | PixID | Counts | Sigma | Mean | Median | Sigma |
| A | 3 | 62 | 381668 | 2373.51 | 649 | 633 | 160.5 |
| A | 4 | 249 | 108765 | 673.57 | 649 | 633 | 160.5 |
| A | 4 | 95 | 106129 | 657.15 | 649 | 633 | 160.5 |
| B | 8 | 128 | 203513 | 1465.81 | 642 | 620 | 138.4 |
| B | 10 | 247 | 57142 | 408.35 | 642 | 620 | 138.4 |
| B | 0 | 216 | 37766 | 268.36 | 642 | 620 | 138.4 |
| C | 15 | 230 | 4007140 | 26705.55 | 545 | 538 | 150.0 |
| C | 13 | 3 | 815840 | 5434.3 | 545 | 538 | 150.0 |
| C | 9 | 38 | 340861 | 2268.38 | 545 | 538 | 150.0 |
| D | 8 | 129 | 246592 | 1372.01 | 625 | 596 | 179.3 |
| D | 10 | 199 | 225506 | 1254.41 | 625 | 596 | 179.3 |
| D | 2 | 249 | 120189 | 667.02 | 625 | 596 | 179.3 |
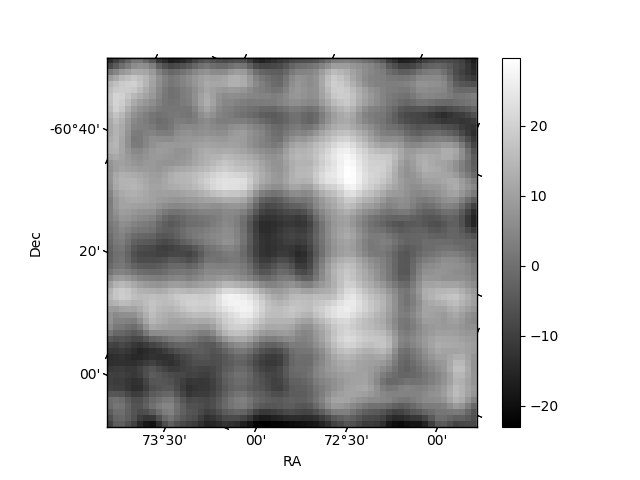
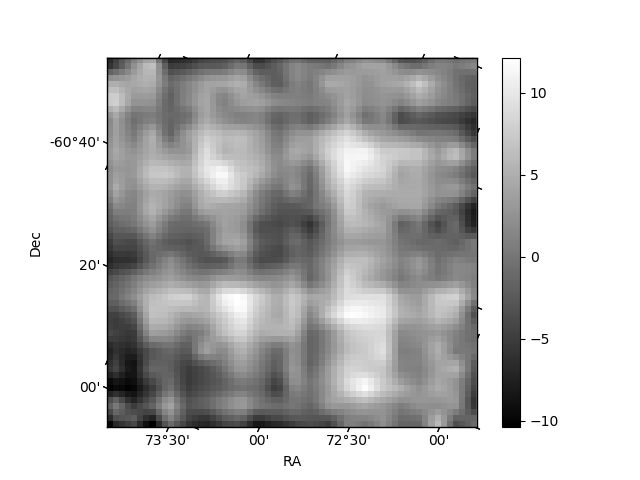
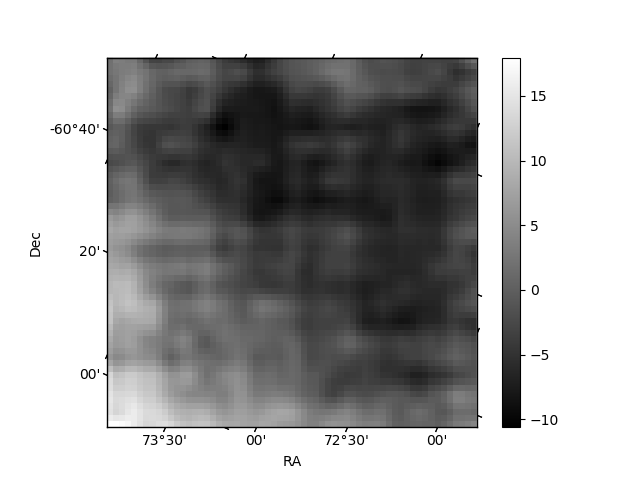
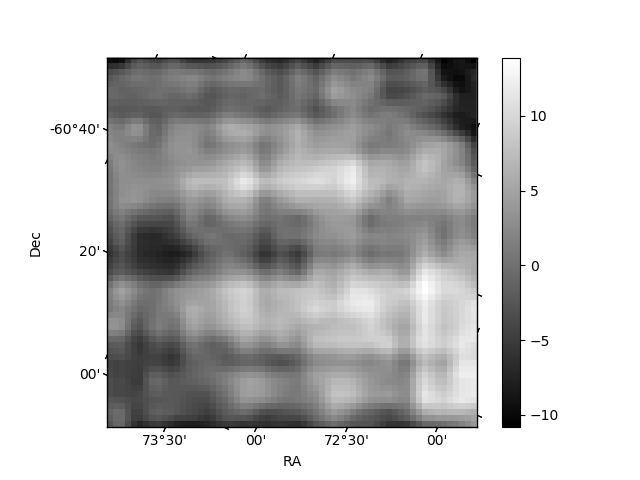
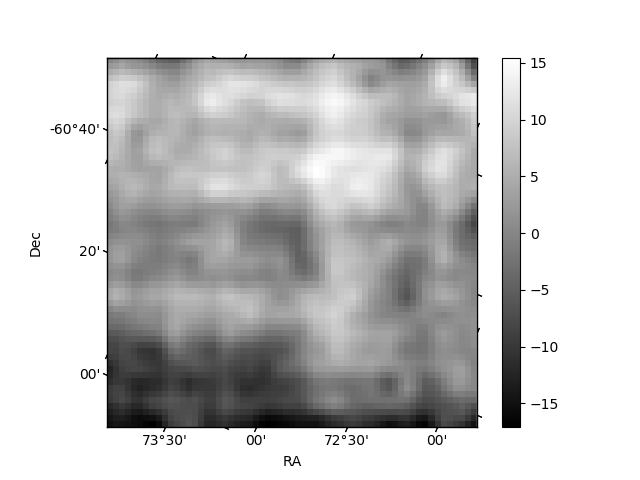
Histogram calculated using DETX and DETY for each event in the final _common_clean file
| Quadrant A | 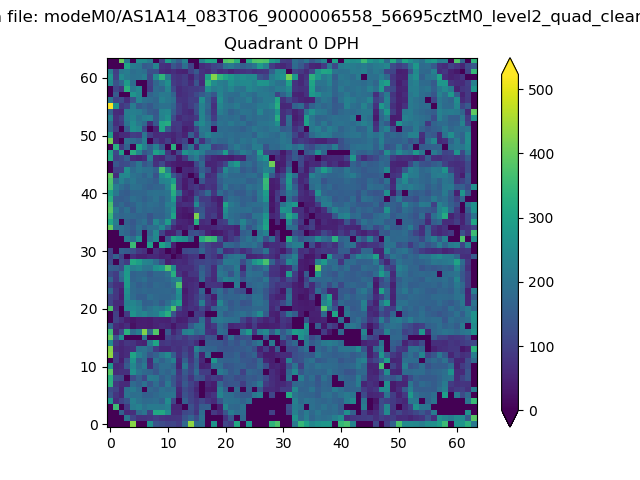 |
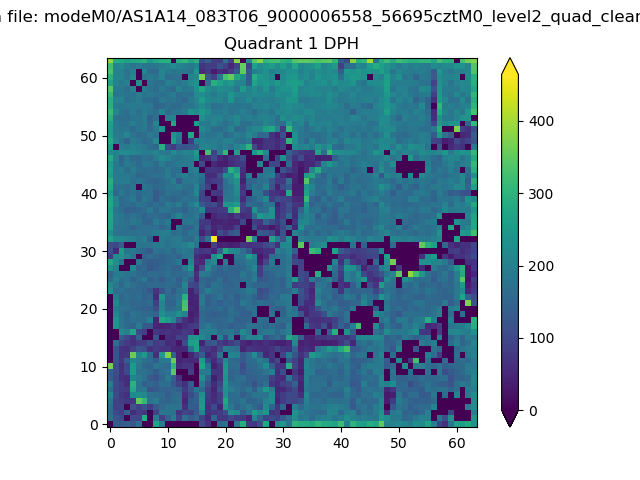 |
Quadrant B |
|---|---|---|---|
| Quadrant D | 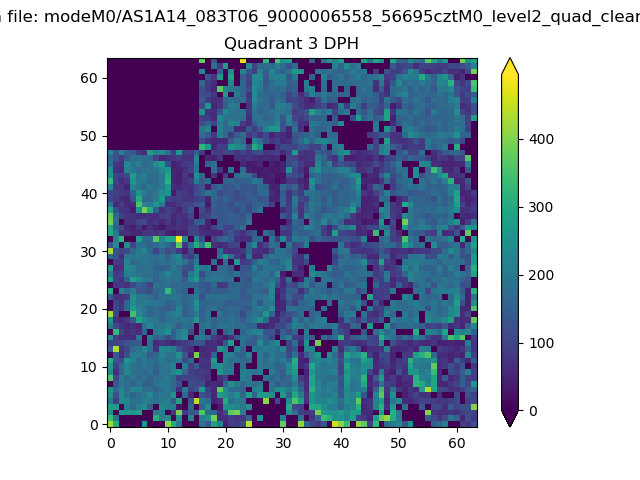 |
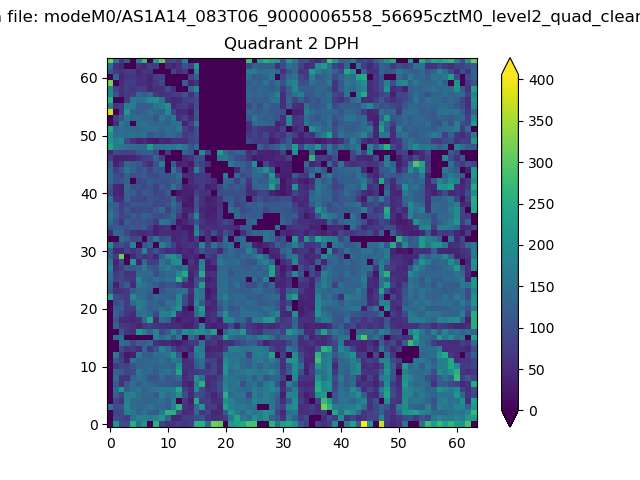 |
Quadrant C |
| Plot type | Count rate plots | Images |
|---|---|---|
| Comparison with Poisson distribution Blue bars denote a histogram of data divided into 1 sec bins. Red curve is a Poisson curve with rate = median count rate of data. |
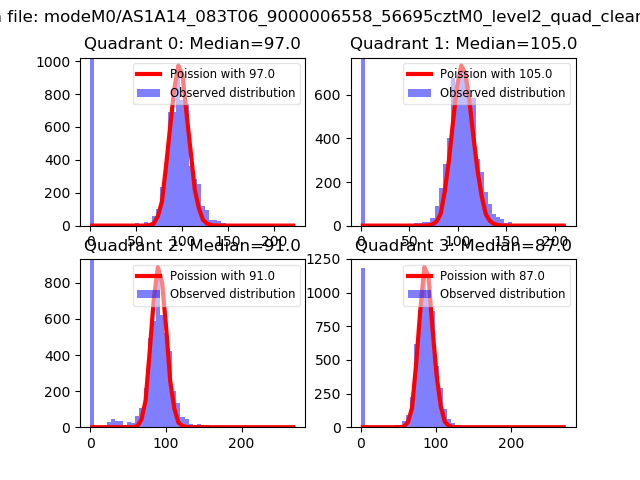 |
 |
| Quadrant-wise count rates Data is divided into 100 sec bins |
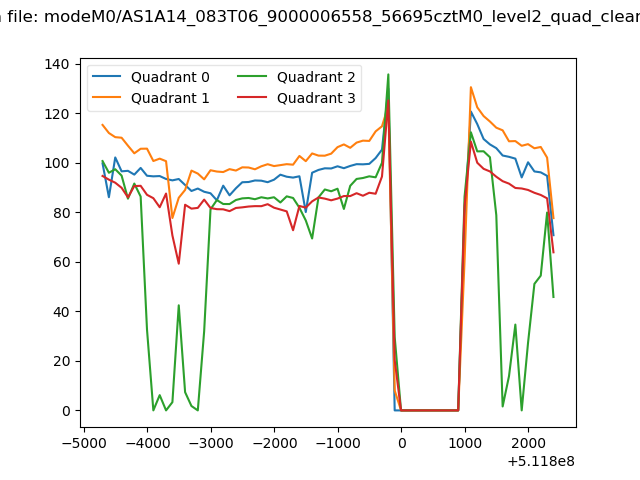 |
|
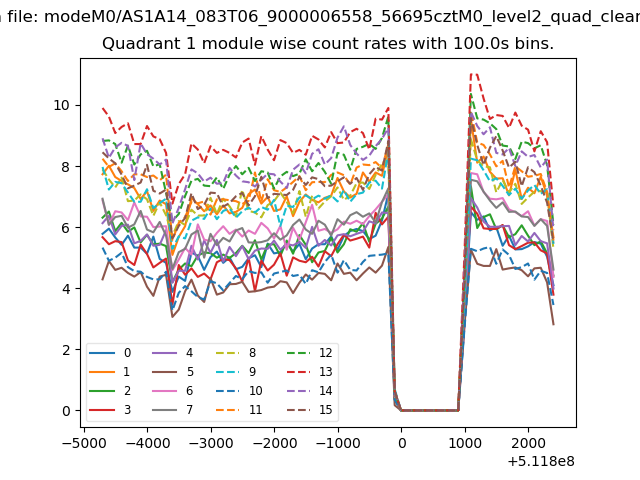
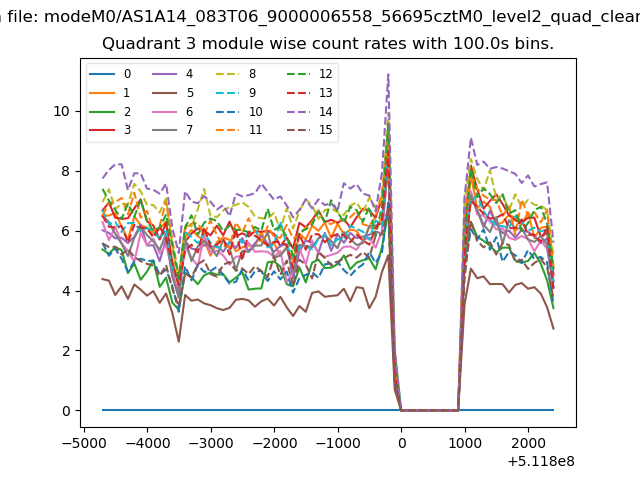
| Module-wise count rates for Quadrant A Data is divided into 100 sec bins |
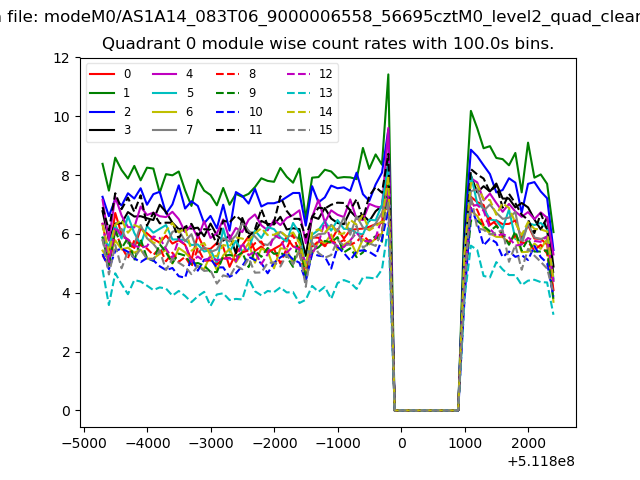 |
 |
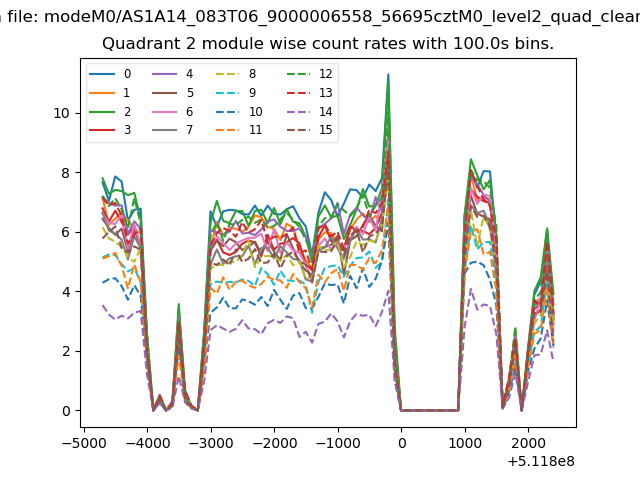
| Module-wise count rates for Quadrant B Data is divided into 100 sec bins |
 |
 |
| Module-wise count rates for Quadrant C Data is divided into 100 sec bins |
 |
 |
| Module-wise count rates for Quadrant D Data is divided into 100 sec bins |
 |
 |
| Parameter | Plot |
|---|---|
| CZT HV Monitor | 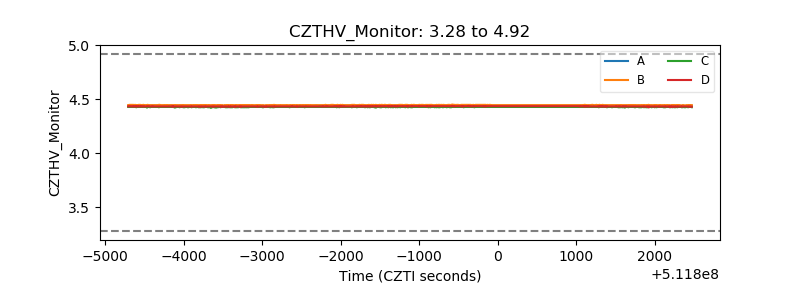 |
| D_VDD | 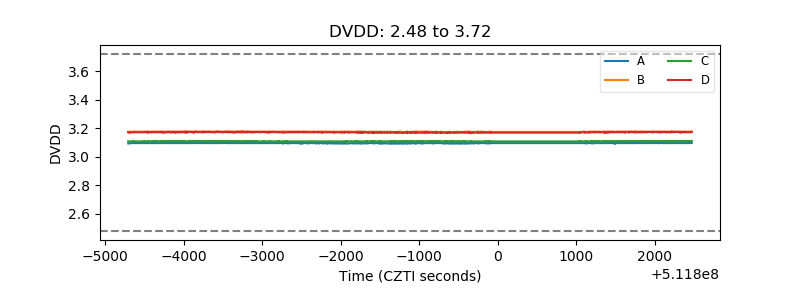 |
| Temperature 1 | 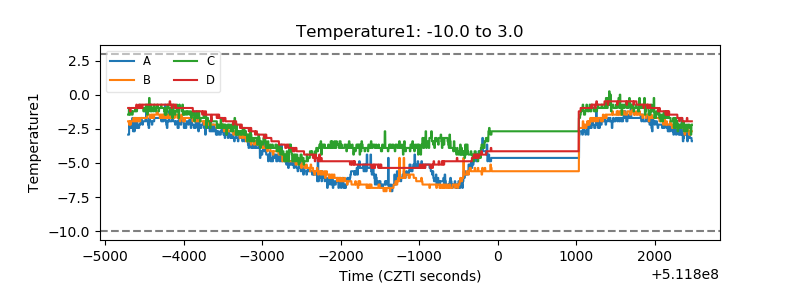 |
| Veto HV Monitor | 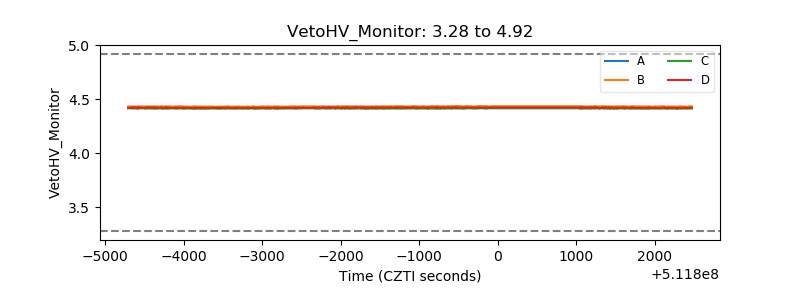 |
| Veto LLD | 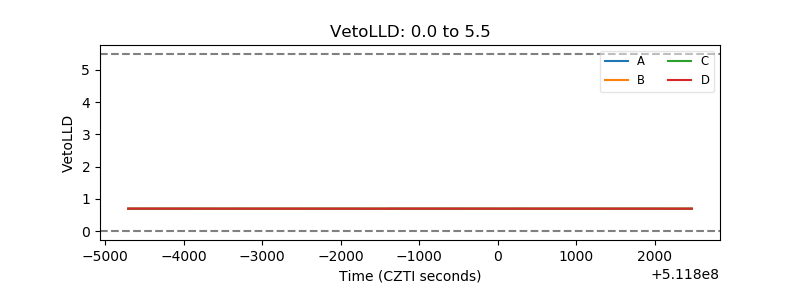 |
| Alpha Counter | 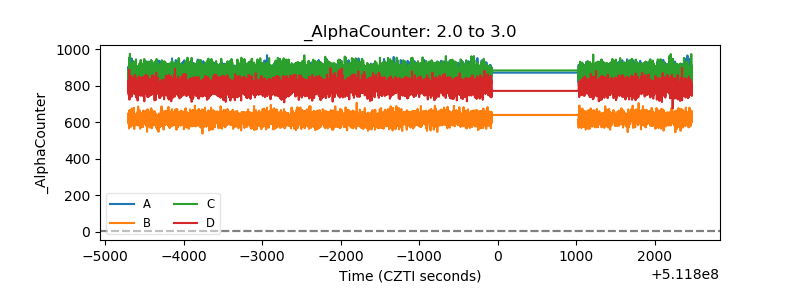 |
| _CPM_Rate | 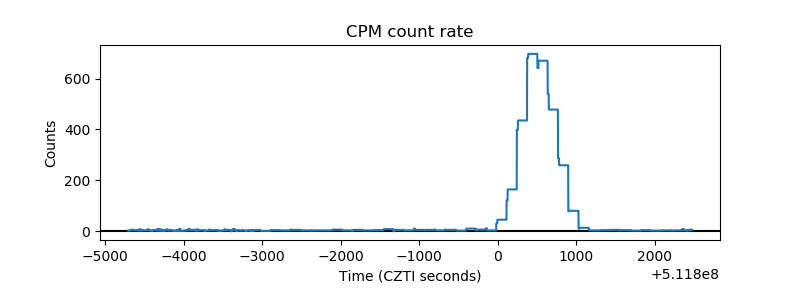 |
| CZT Counter | 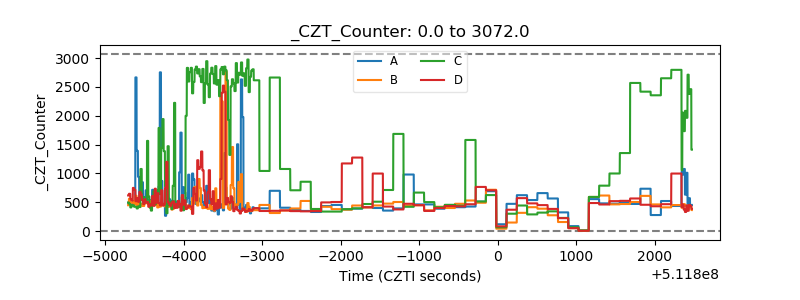 |
| +2.5 Volts monitor |  |
| +5 Volts monitor |  |
| _ROLL_ROT | 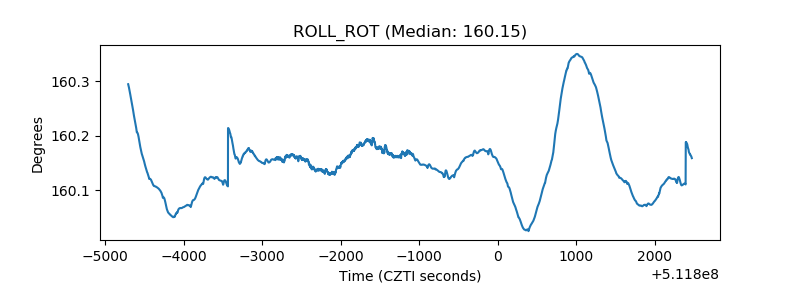 |
| _Roll_DEC | 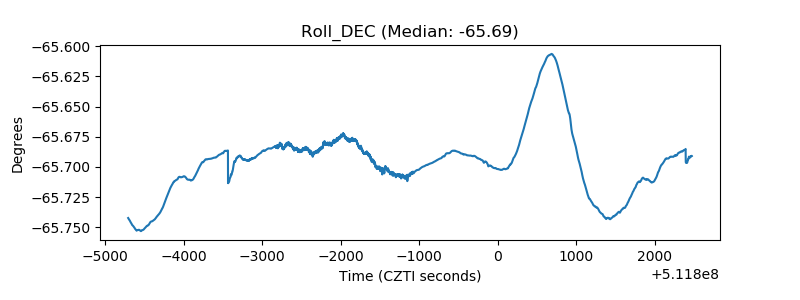 |
| _Roll_RA | 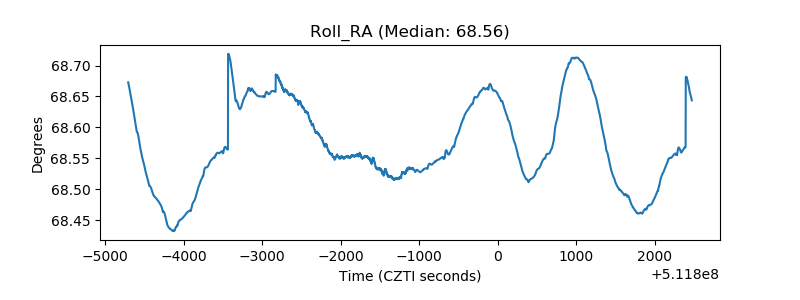 |
| Veto Counter | 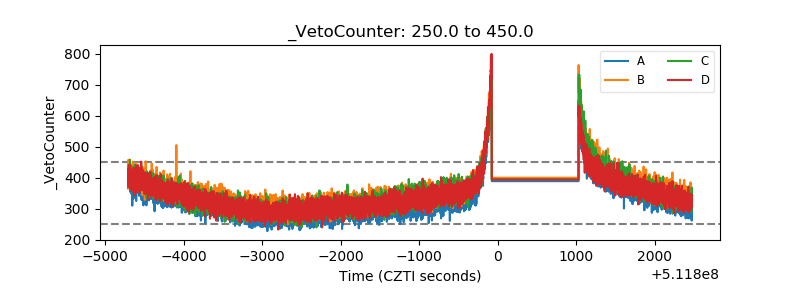 |