| Param | Original file | Final file |
|---|---|---|
| Filename | modeM0/AS1A14_083T06_9000006558_56696cztM0_level2.fits | modeM0/AS1A14_083T06_9000006558_56696cztM0_level2_quad_clean.evt |
| Size (bytes) | 470,016,000 | 86,132,160 |
| Size | 448.2 MB | 82.1 MB |
| Events in quadrant A | 3,585,827 | 581,615 |
| Events in quadrant B | 3,259,704 | 634,945 |
| Events in quadrant C | 6,558,365 | 444,766 |
| Events in quadrant D | 3,518,877 | 519,866 |
| Mode SS | |||
|---|---|---|---|
| Quadrant | BADHDUFLAG | Total packets | Discarded packets |
| A | 0 | 124 | 0 |
| B | 0 | 124 | 0 |
| C | 0 | 124 | 0 |
| D | 0 | 124 | 0 |
| Mode M9 | |||
|---|---|---|---|
| Quadrant | BADHDUFLAG | Total packets | Discarded packets |
| A | 0 | 12 | 0 |
| B | 0 | 12 | 0 |
| C | 0 | 12 | 0 |
| D | 0 | 12 | 0 |
| Mode M0 | |||
|---|---|---|---|
| Quadrant | BADHDUFLAG | Total packets | Discarded packets |
| A | 0 | 15081 | 1 |
| B | 0 | 14161 | 1 |
| C | 0 | 24078 | 1 |
| D | 0 | 14999 | 3 |
| Quadrant | Total seconds | Saturated seconds | Saturation percentage |
|---|---|---|---|
| A | 6114 | 215 | 3.516519% |
| B | 6114 | 139 | 2.273471% |
| C | 6115 | 1330 | 21.749796% |
| D | 6114 | 172 | 2.813216% |
Noise dominated data is calculated using 1-second bins in cleaned event files. If a bin has >2000 counts, and if more than 50% of those come from <1% of pixels, then it is considered to be noise-dominated and hence unusable.
| Quadrant | # 1 sec bins | Bins with >0 counts | Bins with >2000 counts | High rate bins dominated by noise | Noise dominated (total time) | Noise dominated (detector-on time) | Marked lightcurve |
|---|---|---|---|---|---|---|---|
| A | 7269 | 6115 | 144 | 144 | 1.98% | 2.35% | 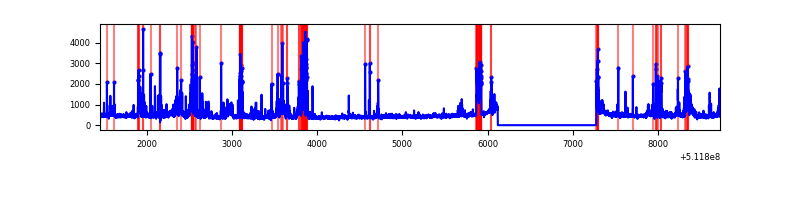 |
| B | 7269 | 6115 | 43 | 43 | 0.59% | 0.70% | 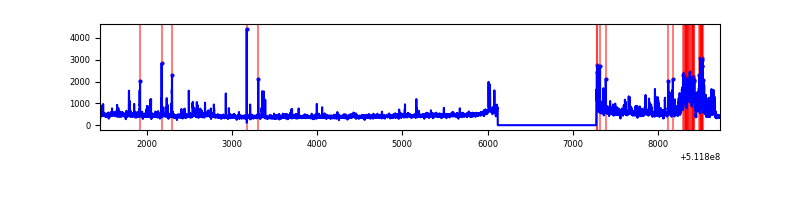 |
| C | 7270 | 6116 | 1189 | 1189 | 16.35% | 19.44% | 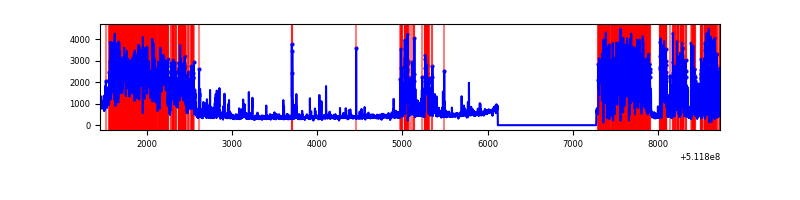 |
| D | 7269 | 6115 | 140 | 140 | 1.93% | 2.29% | 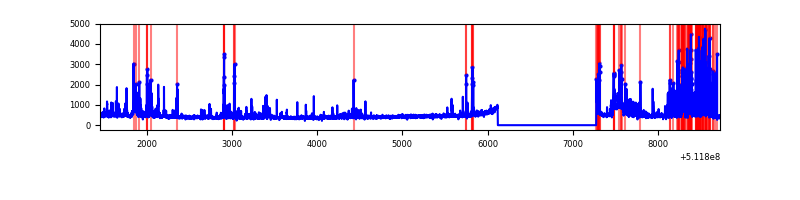 |
Top three noisy pixels from each quadrant. If the there are fewer than three noisy pixels in the level2.evt file, extra rows are filled as -1
| Pixel properties | Quadrant properties | ||||||
|---|---|---|---|---|---|---|---|
| Quadrant | DetID | PixID | Counts | Sigma | Mean | Median | Sigma |
| A | 4 | 249 | 429927 | 2698.01 | 646 | 630 | 159.1 |
| A | 3 | 62 | 331428 | 2078.98 | 646 | 630 | 159.1 |
| A | 7 | 64 | 73234 | 456.3 | 646 | 630 | 159.1 |
| B | 4 | 236 | 482540 | 3483.39 | 643 | 620 | 138.3 |
| B | 10 | 247 | 37823 | 268.91 | 643 | 620 | 138.3 |
| B | 10 | 16 | 28089 | 198.55 | 643 | 620 | 138.3 |
| C | 15 | 230 | 3154556 | 20674.35 | 555 | 549 | 152.6 |
| C | 6 | 223 | 559310 | 3662.65 | 555 | 549 | 152.6 |
| C | 13 | 3 | 306747 | 2007.11 | 555 | 549 | 152.6 |
| D | 6 | 239 | 461963 | 2633.48 | 614 | 587 | 175.2 |
| D | 2 | 249 | 176120 | 1001.92 | 614 | 587 | 175.2 |
| D | 8 | 240 | 118990 | 675.83 | 614 | 587 | 175.2 |
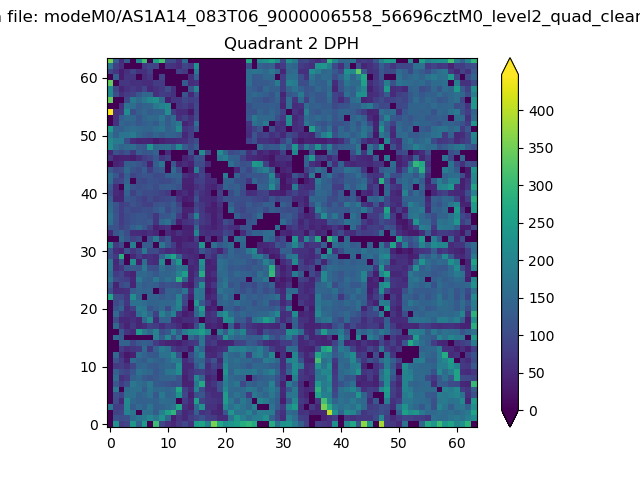
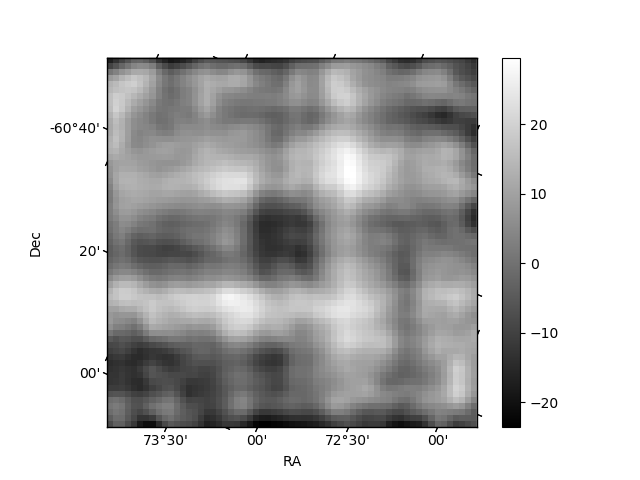
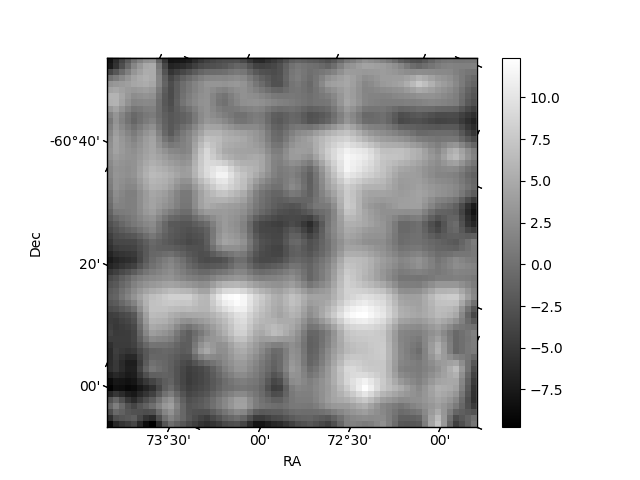
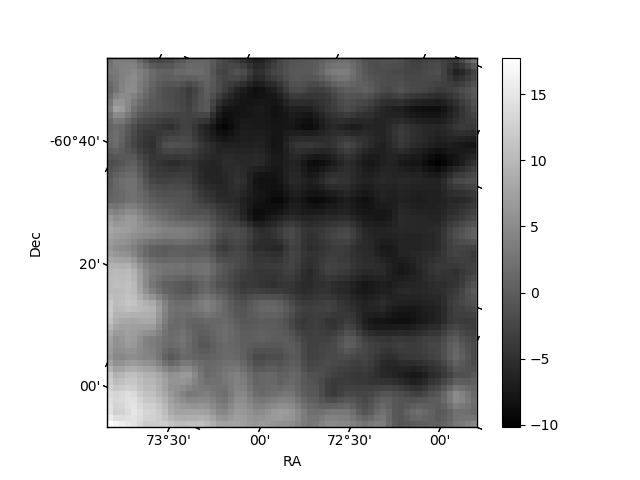
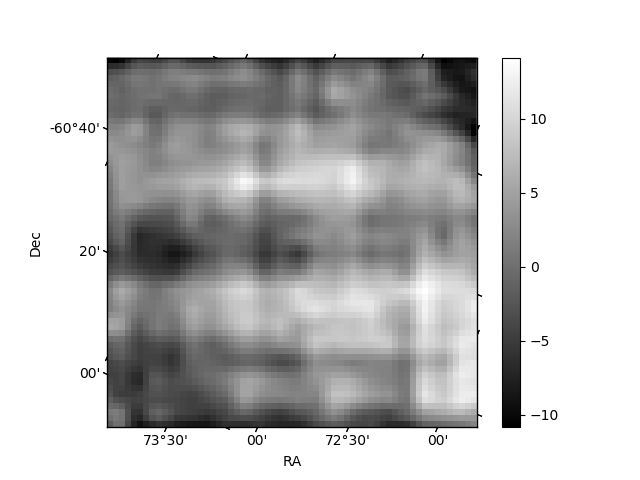
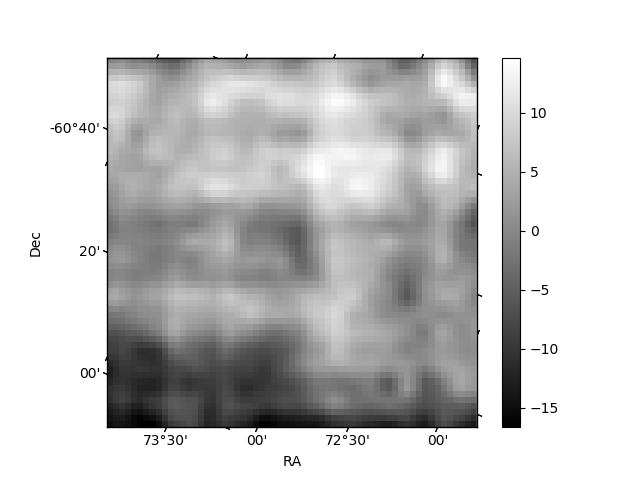
Histogram calculated using DETX and DETY for each event in the final _common_clean file
| Quadrant A | 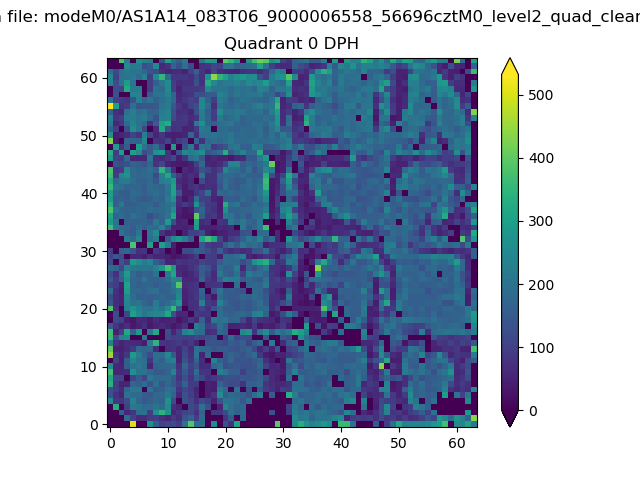 |
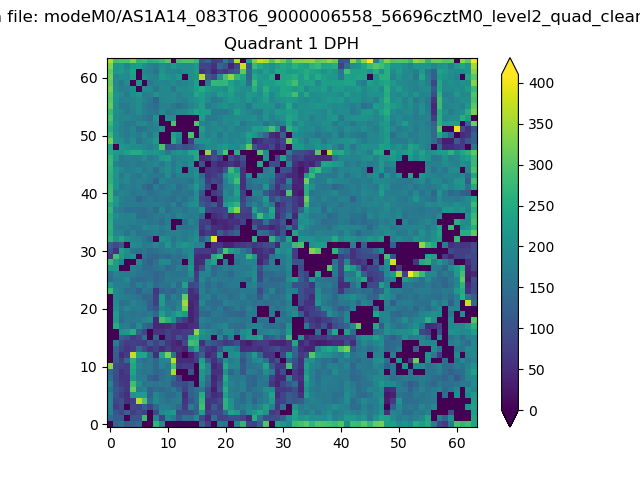 |
Quadrant B |
|---|---|---|---|
| Quadrant D | 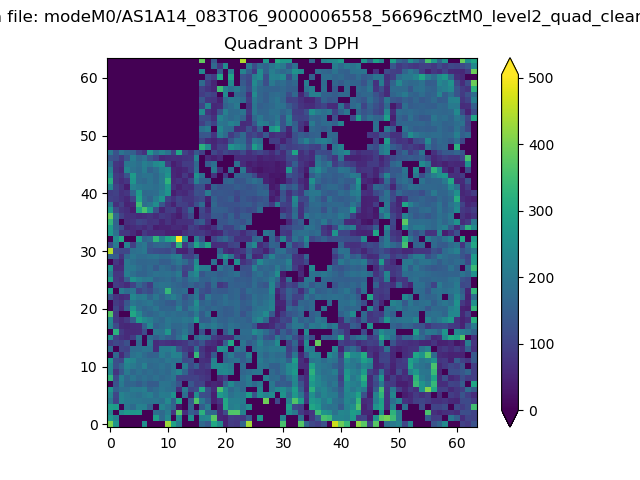 |
 |
Quadrant C |
| Plot type | Count rate plots | Images |
|---|---|---|
| Comparison with Poisson distribution Blue bars denote a histogram of data divided into 1 sec bins. Red curve is a Poisson curve with rate = median count rate of data. |
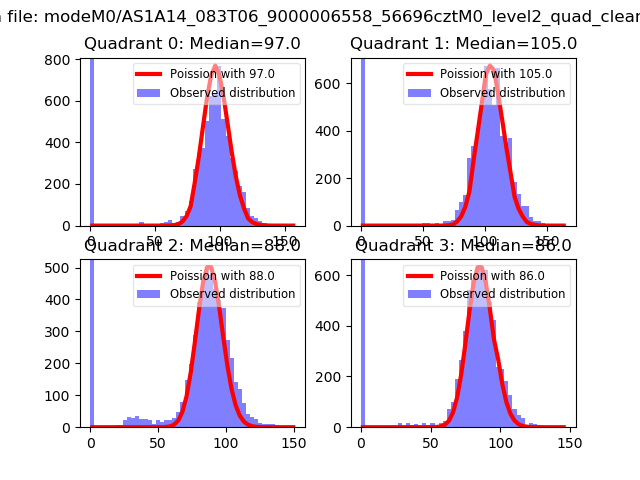 |
 |
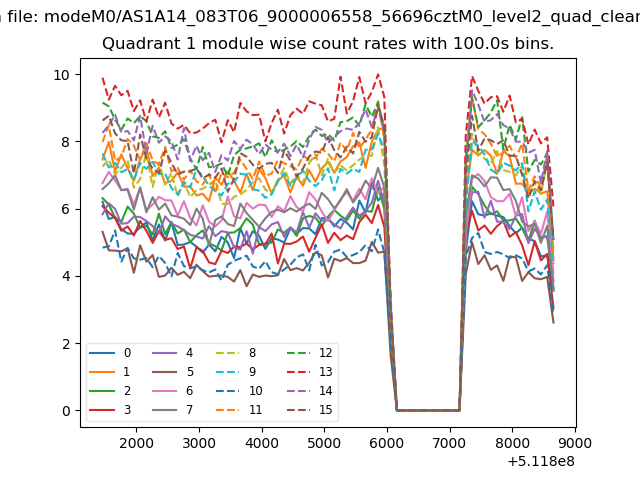
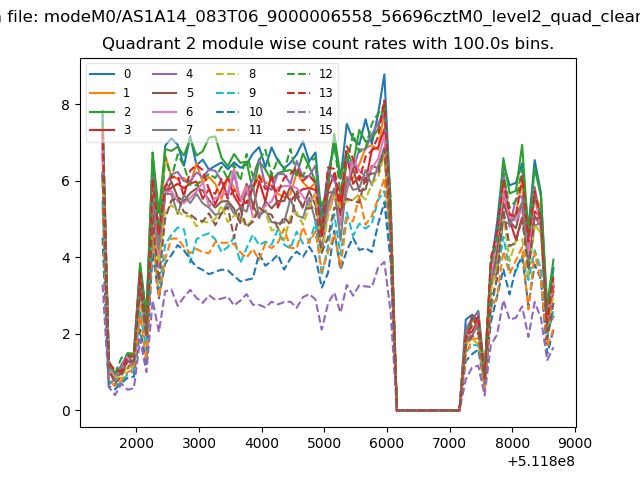
| Quadrant-wise count rates Data is divided into 100 sec bins |
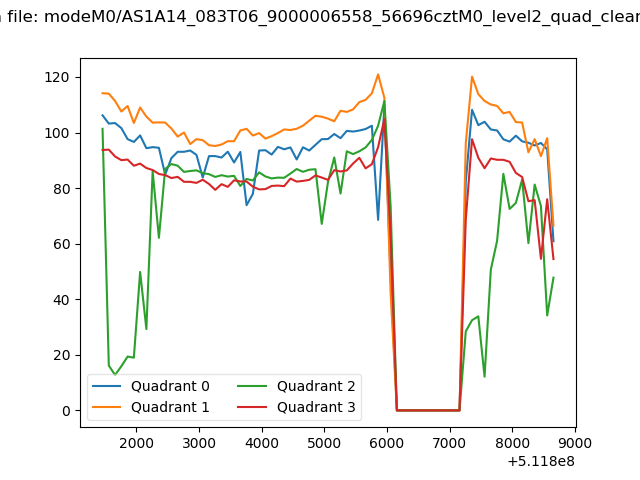 |
|
| Module-wise count rates for Quadrant A Data is divided into 100 sec bins |
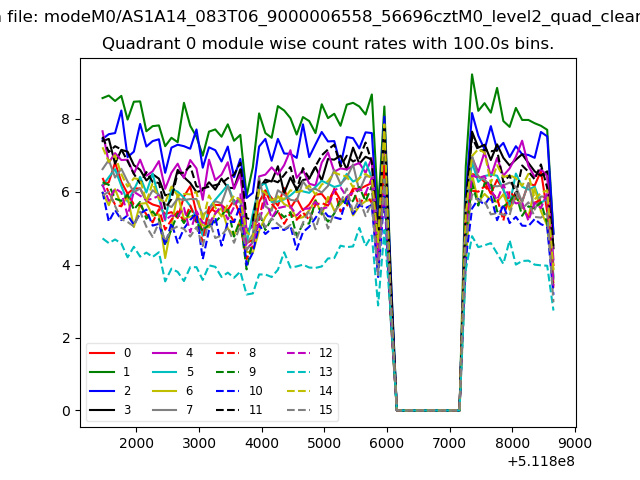 |
 |
| Module-wise count rates for Quadrant B Data is divided into 100 sec bins |
 |
 |
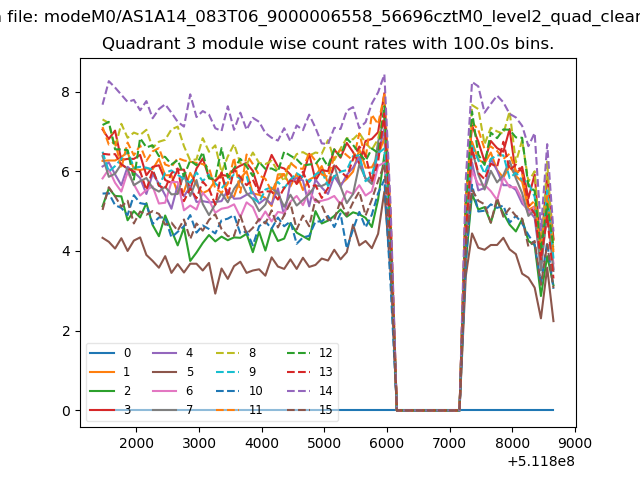
| Module-wise count rates for Quadrant C Data is divided into 100 sec bins |
 |
 |
| Module-wise count rates for Quadrant D Data is divided into 100 sec bins |
 |
 |
| Parameter | Plot |
|---|---|
| CZT HV Monitor | 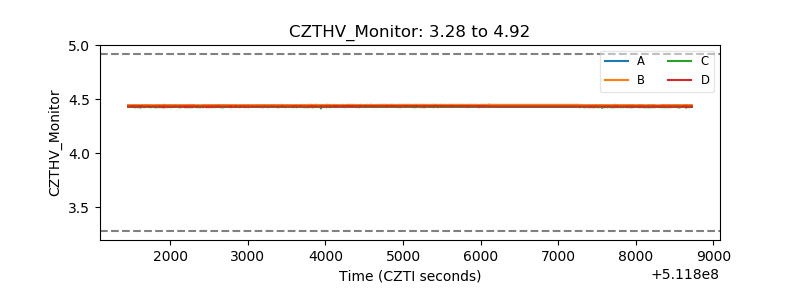 |
| D_VDD | 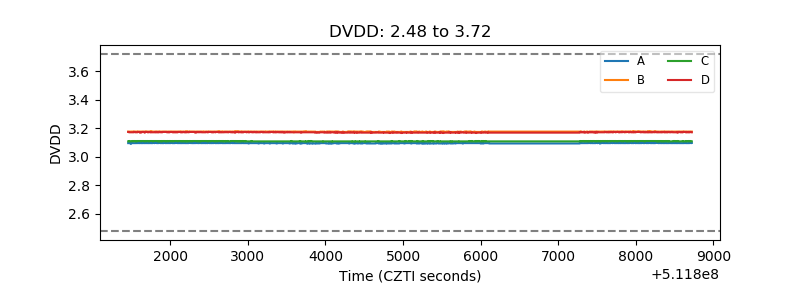 |
| Temperature 1 | 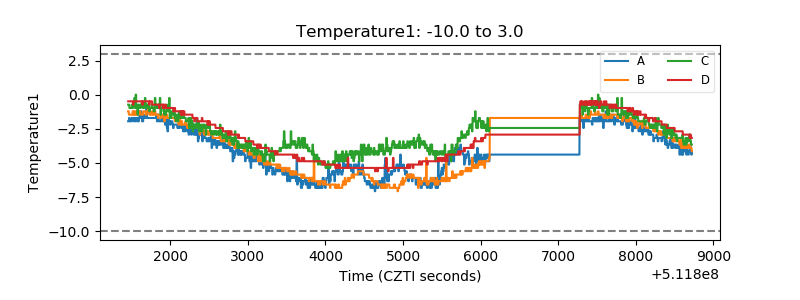 |
| Veto HV Monitor | 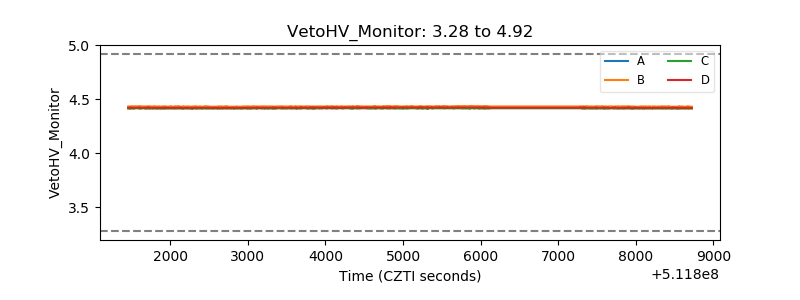 |
| Veto LLD | 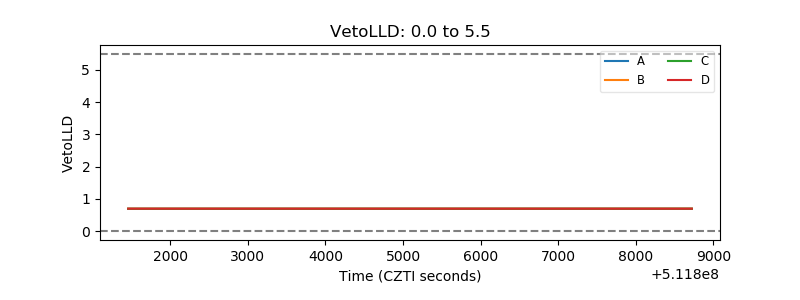 |
| Alpha Counter | 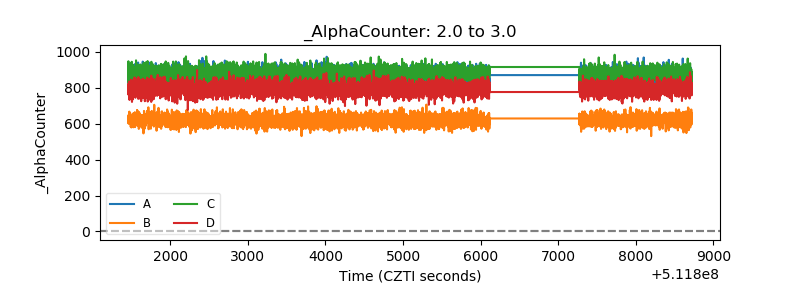 |
| _CPM_Rate | 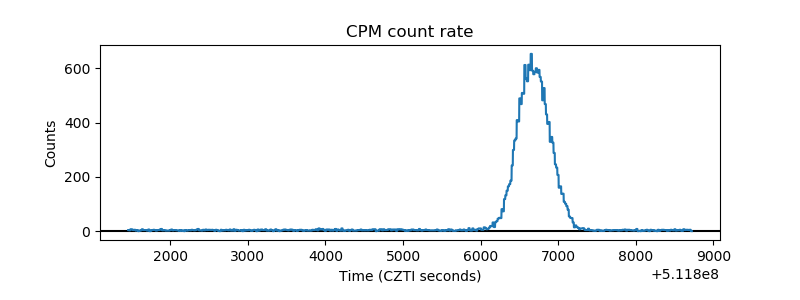 |
| CZT Counter | 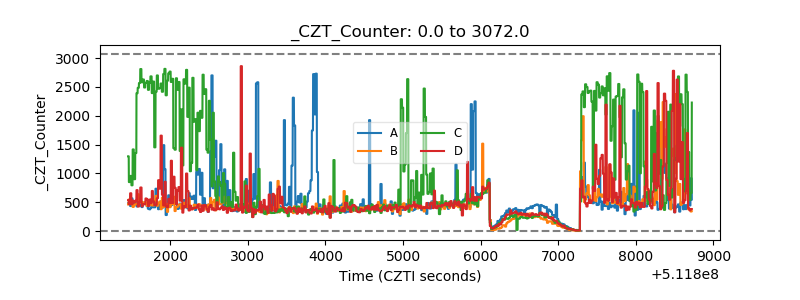 |
| +2.5 Volts monitor |  |
| +5 Volts monitor |  |
| _ROLL_ROT | 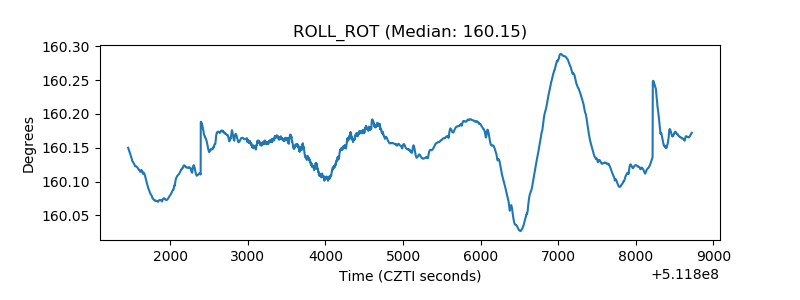 |
| _Roll_DEC | 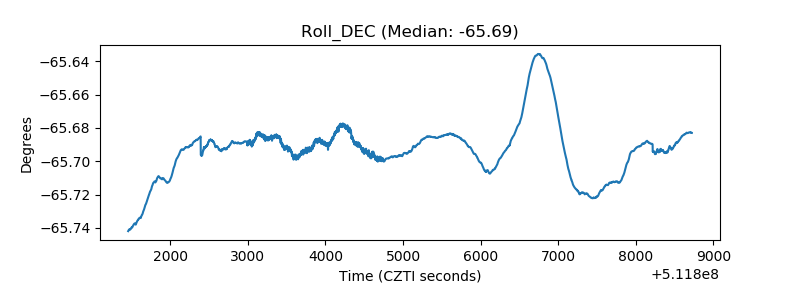 |
| _Roll_RA | 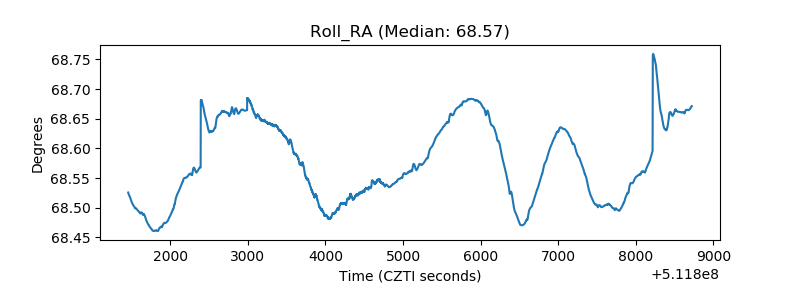 |
| Veto Counter | 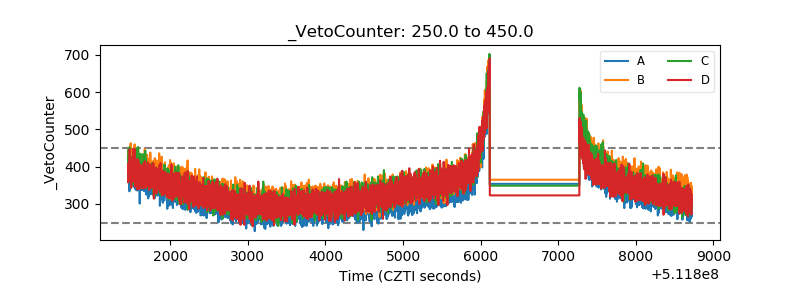 |