| Param | Original file | Final file |
|---|---|---|
| Filename | modeM0/AS1A14_083T06_9000006558_56697cztM0_level2.fits | modeM0/AS1A14_083T06_9000006558_56697cztM0_level2_quad_clean.evt |
| Size (bytes) | 452,738,880 | 83,401,920 |
| Size | 431.8 MB | 79.5 MB |
| Events in quadrant A | 3,533,808 | 558,755 |
| Events in quadrant B | 3,648,424 | 593,740 |
| Events in quadrant C | 5,238,730 | 462,822 |
| Events in quadrant D | 3,871,768 | 491,260 |
| Mode SS | |||
|---|---|---|---|
| Quadrant | BADHDUFLAG | Total packets | Discarded packets |
| A | 0 | 122 | 0 |
| B | 0 | 122 | 0 |
| C | 0 | 122 | 0 |
| D | 0 | 122 | 0 |
| Mode M9 | |||
|---|---|---|---|
| Quadrant | BADHDUFLAG | Total packets | Discarded packets |
| A | 0 | 11 | 0 |
| B | 0 | 11 | 0 |
| C | 0 | 11 | 0 |
| D | 0 | 11 | 0 |
| Mode M0 | |||
|---|---|---|---|
| Quadrant | BADHDUFLAG | Total packets | Discarded packets |
| A | 0 | 14973 | 1 |
| B | 0 | 15360 | 1 |
| C | 0 | 20093 | 1 |
| D | 0 | 15892 | 1 |
| Quadrant | Total seconds | Saturated seconds | Saturation percentage |
|---|---|---|---|
| A | 5992 | 263 | 4.389186% |
| B | 5992 | 304 | 5.073431% |
| C | 5992 | 944 | 15.754339% |
| D | 5992 | 294 | 4.906542% |
Noise dominated data is calculated using 1-second bins in cleaned event files. If a bin has >2000 counts, and if more than 50% of those come from <1% of pixels, then it is considered to be noise-dominated and hence unusable.
| Quadrant | # 1 sec bins | Bins with >0 counts | Bins with >2000 counts | High rate bins dominated by noise | Noise dominated (total time) | Noise dominated (detector-on time) | Marked lightcurve |
|---|---|---|---|---|---|---|---|
| A | 7087 | 5993 | 200 | 200 | 2.82% | 3.34% | 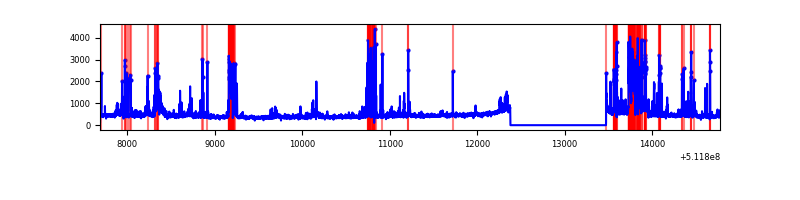 |
| B | 7087 | 5993 | 190 | 190 | 2.68% | 3.17% | 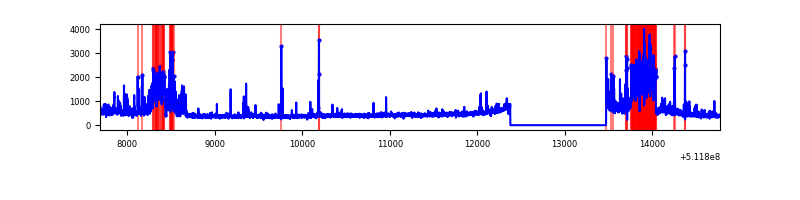 |
| C | 7087 | 5993 | 769 | 769 | 10.85% | 12.83% | 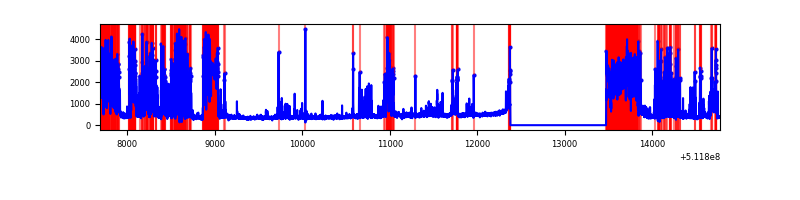 |
| D | 7087 | 5993 | 284 | 284 | 4.01% | 4.74% | 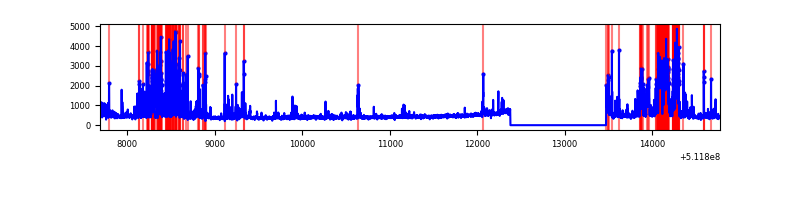 |
Top three noisy pixels from each quadrant. If the there are fewer than three noisy pixels in the level2.evt file, extra rows are filled as -1
| Pixel properties | Quadrant properties | ||||||
|---|---|---|---|---|---|---|---|
| Quadrant | DetID | PixID | Counts | Sigma | Mean | Median | Sigma |
| A | 7 | 64 | 536936 | 3450.08 | 622 | 606 | 155.5 |
| A | 4 | 249 | 193415 | 1240.29 | 622 | 606 | 155.5 |
| A | 8 | 26 | 152618 | 977.86 | 622 | 606 | 155.5 |
| B | 4 | 236 | 892022 | 6792.94 | 618 | 595 | 131.2 |
| B | 0 | 63 | 100883 | 764.22 | 618 | 595 | 131.2 |
| B | 10 | 16 | 76096 | 575.34 | 618 | 595 | 131.2 |
| C | 15 | 230 | 1459381 | 9558.74 | 554 | 547 | 152.6 |
| C | 6 | 223 | 746669 | 4888.82 | 554 | 547 | 152.6 |
| C | 13 | 3 | 471754 | 3087.5 | 554 | 547 | 152.6 |
| D | 6 | 239 | 744860 | 4480.42 | 587 | 559 | 166.1 |
| D | 10 | 199 | 326450 | 1961.74 | 587 | 559 | 166.1 |
| D | 2 | 249 | 251687 | 1511.7 | 587 | 559 | 166.1 |
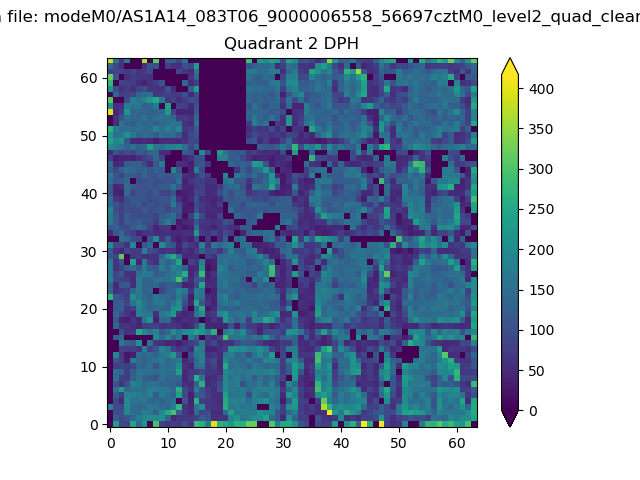
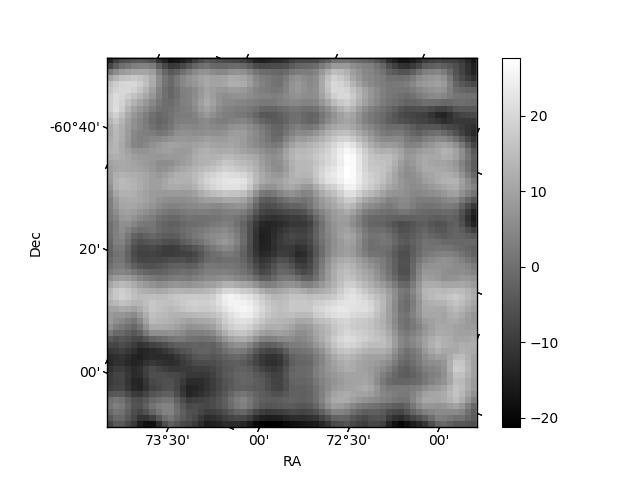
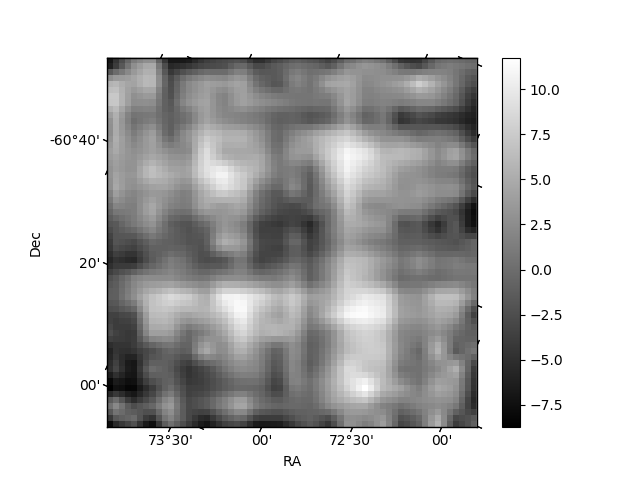
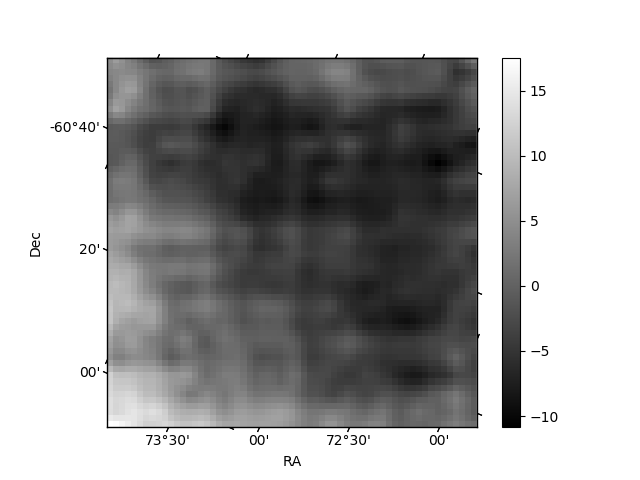
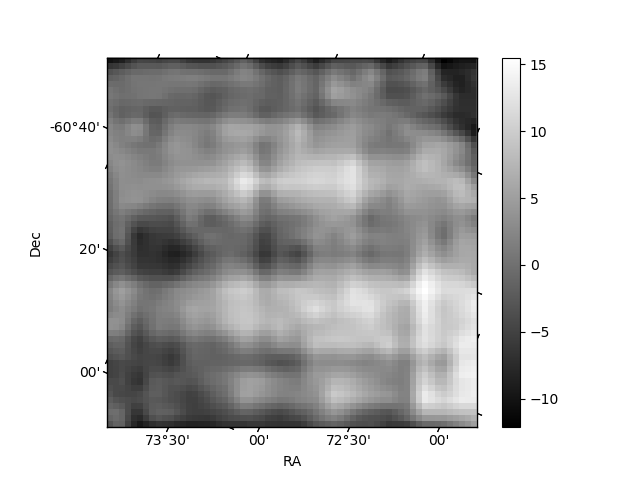
Histogram calculated using DETX and DETY for each event in the final _common_clean file
| Quadrant A | 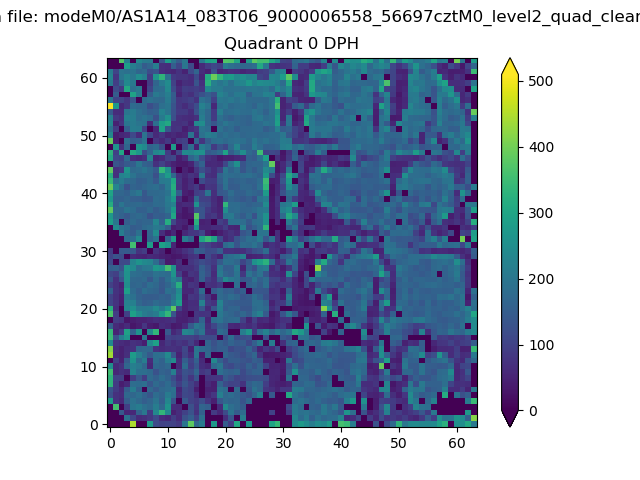 |
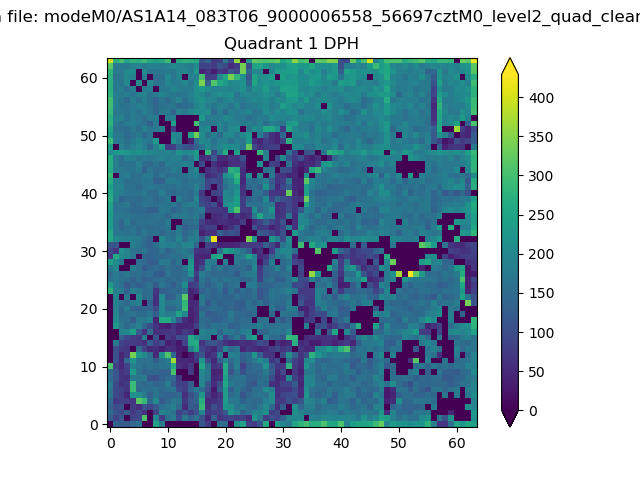 |
Quadrant B |
|---|---|---|---|
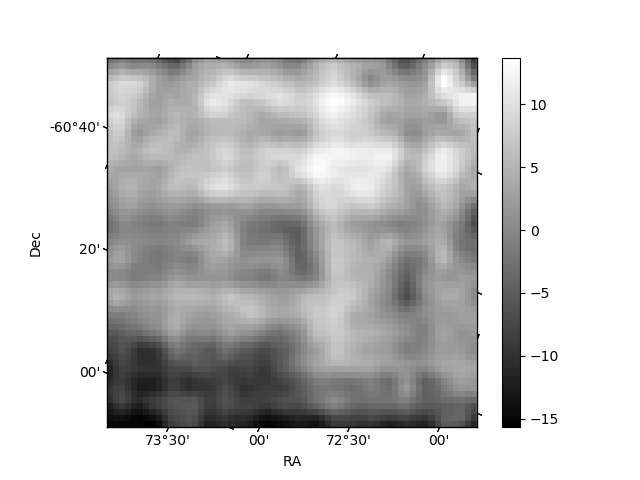
| Quadrant D | 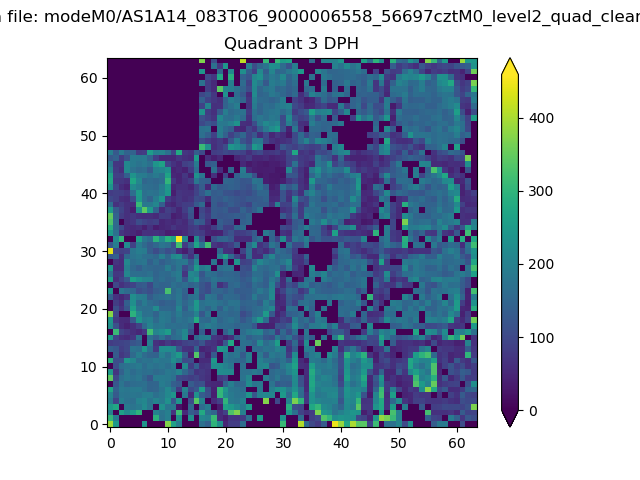 |
 |
Quadrant C |
| Plot type | Count rate plots | Images |
|---|---|---|
| Comparison with Poisson distribution Blue bars denote a histogram of data divided into 1 sec bins. Red curve is a Poisson curve with rate = median count rate of data. |
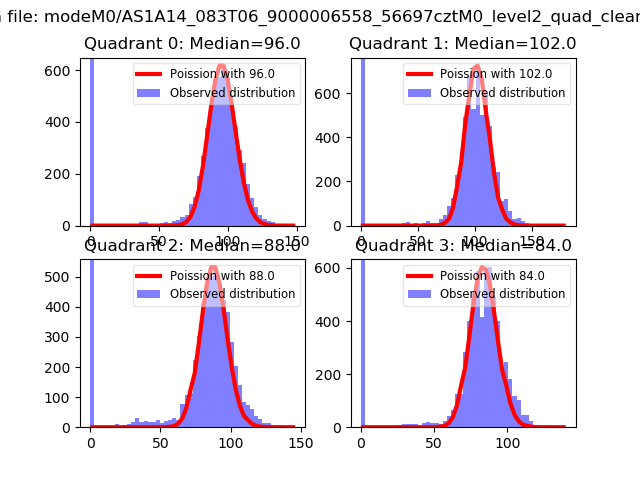 |
 |
| Quadrant-wise count rates Data is divided into 100 sec bins |
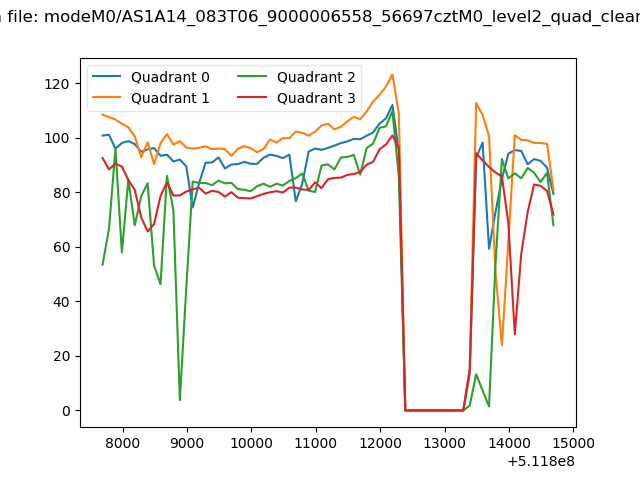 |
|
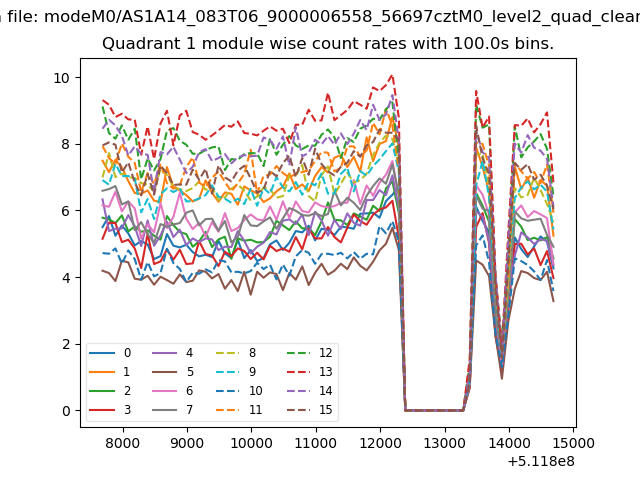
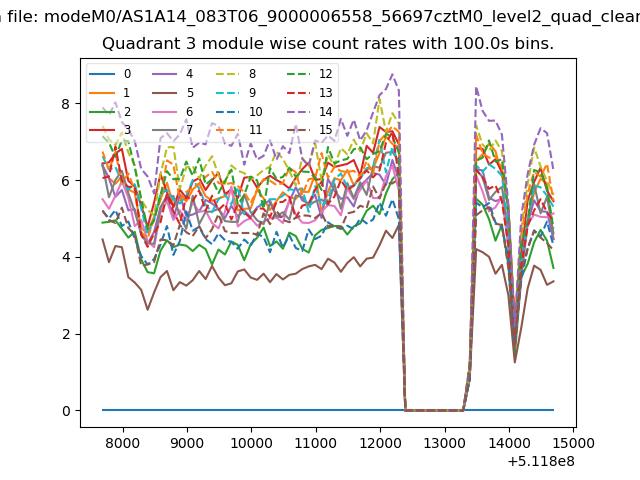
| Module-wise count rates for Quadrant A Data is divided into 100 sec bins |
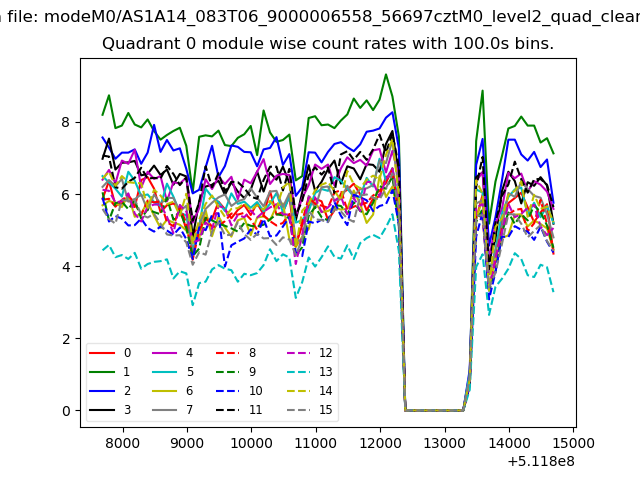 |
 |
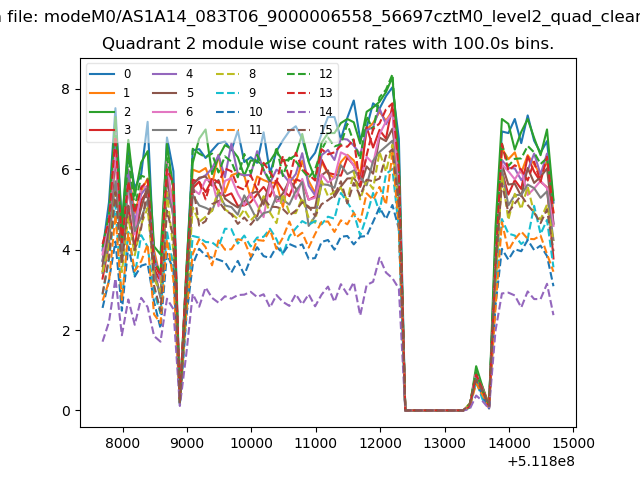
| Module-wise count rates for Quadrant B Data is divided into 100 sec bins |
 |
 |
| Module-wise count rates for Quadrant C Data is divided into 100 sec bins |
 |
 |
| Module-wise count rates for Quadrant D Data is divided into 100 sec bins |
 |
 |
| Parameter | Plot |
|---|---|
| CZT HV Monitor | 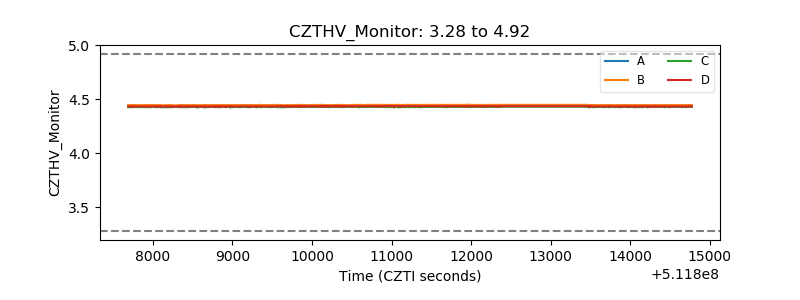 |
| D_VDD | 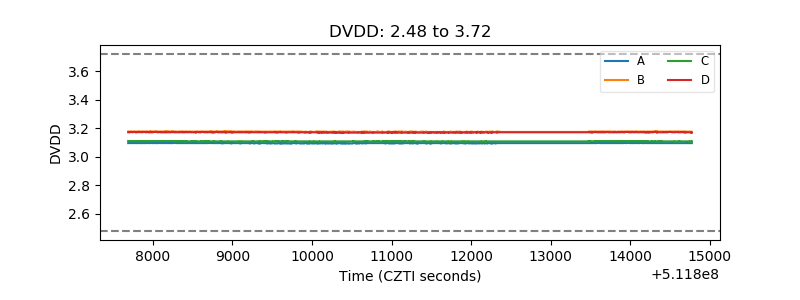 |
| Temperature 1 | 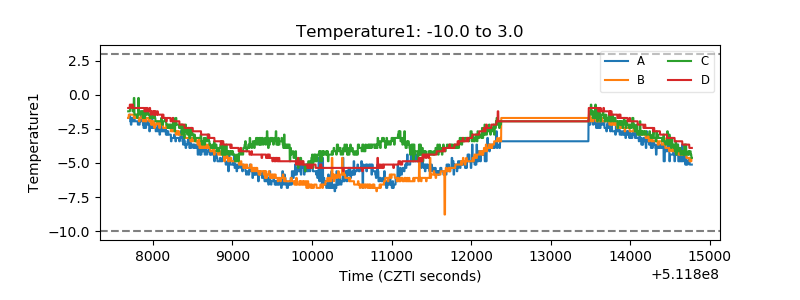 |
| Veto HV Monitor | 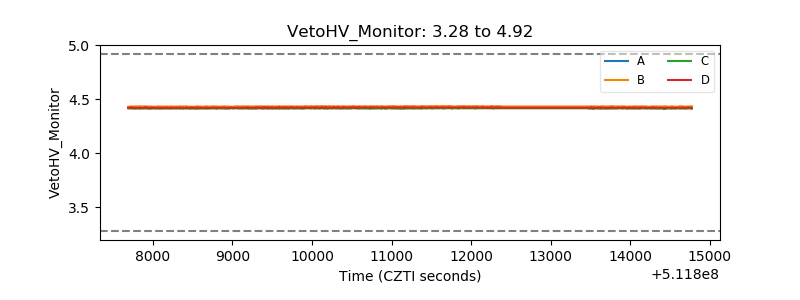 |
| Veto LLD | 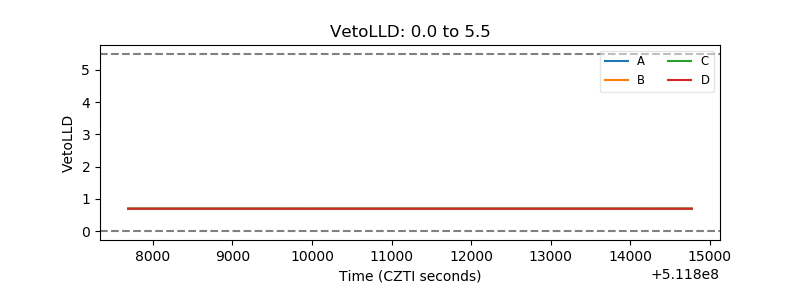 |
| Alpha Counter | 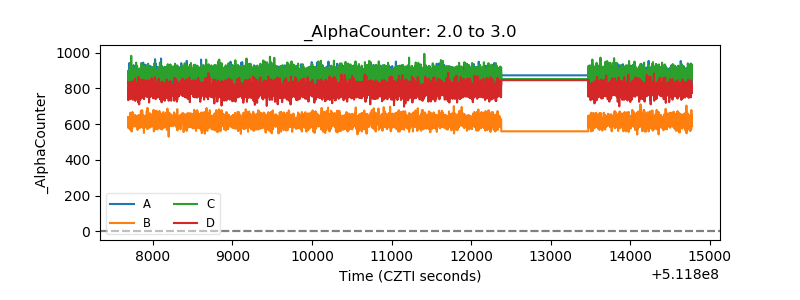 |
| _CPM_Rate | 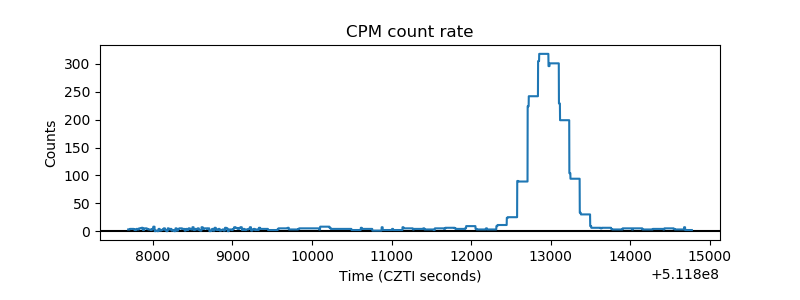 |
| CZT Counter | 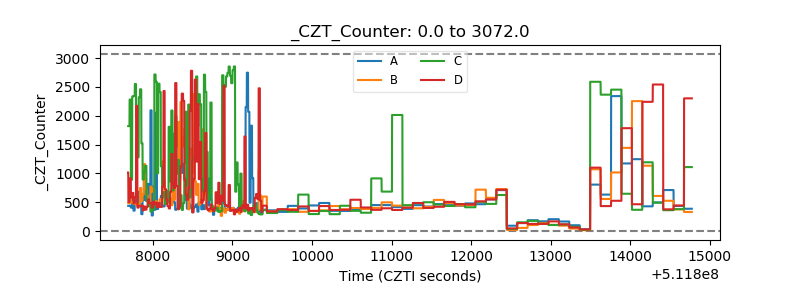 |
| +2.5 Volts monitor |  |
| +5 Volts monitor |  |
| _ROLL_ROT | 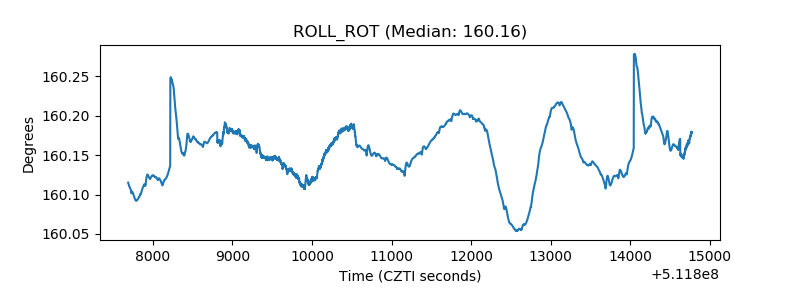 |
| _Roll_DEC | 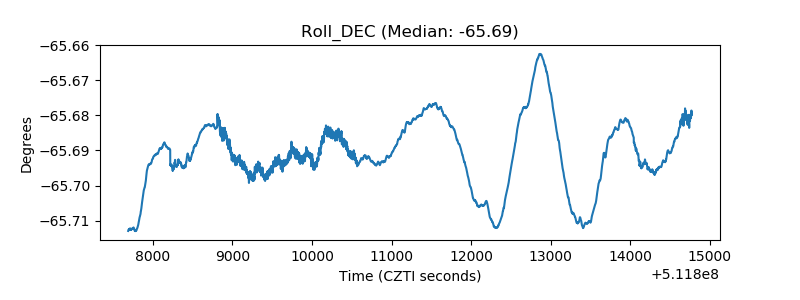 |
| _Roll_RA | 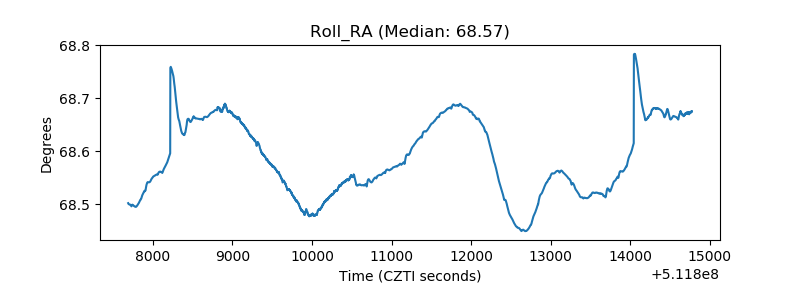 |
| Veto Counter | 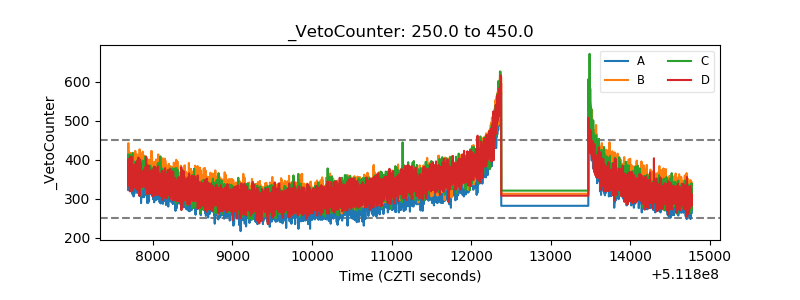 |