| Param | Original file | Final file |
|---|---|---|
| Filename | modeM0/AS1A14_083T06_9000006558_56698cztM0_level2.fits | modeM0/AS1A14_083T06_9000006558_56698cztM0_level2_quad_clean.evt |
| Size (bytes) | 596,658,240 | 89,354,880 |
| Size | 569.0 MB | 85.2 MB |
| Events in quadrant A | 4,384,440 | 613,802 |
| Events in quadrant B | 3,910,763 | 648,819 |
| Events in quadrant C | 8,361,038 | 425,065 |
| Events in quadrant D | 4,910,105 | 550,995 |
| Mode SS | |||
|---|---|---|---|
| Quadrant | BADHDUFLAG | Total packets | Discarded packets |
| A | 0 | 136 | 0 |
| B | 0 | 136 | 0 |
| C | 0 | 136 | 0 |
| D | 0 | 136 | 0 |
| Mode M9 | |||
|---|---|---|---|
| Quadrant | BADHDUFLAG | Total packets | Discarded packets |
| A | 0 | 13 | 0 |
| B | 0 | 14 | 0 |
| C | 0 | 14 | 0 |
| D | 0 | 14 | 0 |
| Mode M0 | |||
|---|---|---|---|
| Quadrant | BADHDUFLAG | Total packets | Discarded packets |
| A | 0 | 18062 | 2 |
| B | 0 | 16706 | 2 |
| C | 0 | 29684 | 2 |
| D | 0 | 19396 | 2 |
| Quadrant | Total seconds | Saturated seconds | Saturation percentage |
|---|---|---|---|
| A | 6694 | 439 | 6.558112% |
| B | 6694 | 397 | 5.930684% |
| C | 6694 | 2017 | 30.131461% |
| D | 6694 | 366 | 5.467583% |
Noise dominated data is calculated using 1-second bins in cleaned event files. If a bin has >2000 counts, and if more than 50% of those come from <1% of pixels, then it is considered to be noise-dominated and hence unusable.
| Quadrant | # 1 sec bins | Bins with >0 counts | Bins with >2000 counts | High rate bins dominated by noise | Noise dominated (total time) | Noise dominated (detector-on time) | Marked lightcurve |
|---|---|---|---|---|---|---|---|
| A | 7594 | 6695 | 356 | 356 | 4.69% | 5.32% | 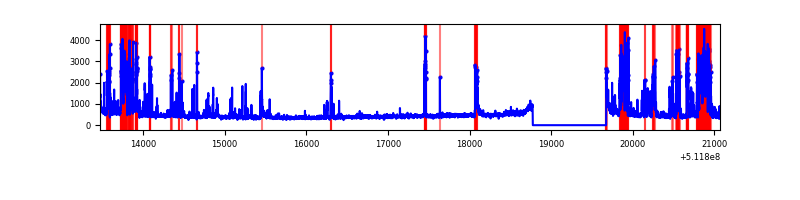 |
| B | 7594 | 6695 | 212 | 212 | 2.79% | 3.17% | 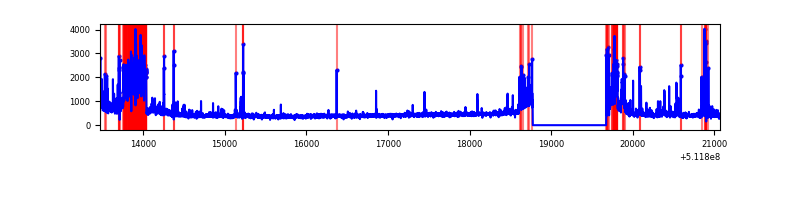 |
| C | 7593 | 6694 | 1686 | 1686 | 22.20% | 25.19% | 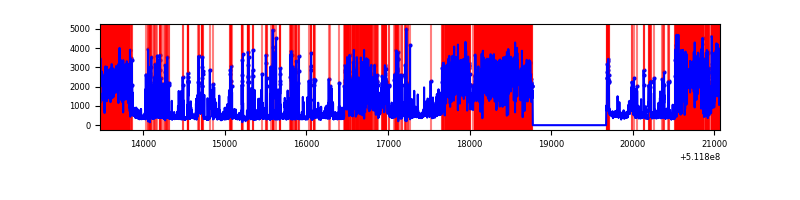 |
| D | 7594 | 6695 | 407 | 407 | 5.36% | 6.08% | 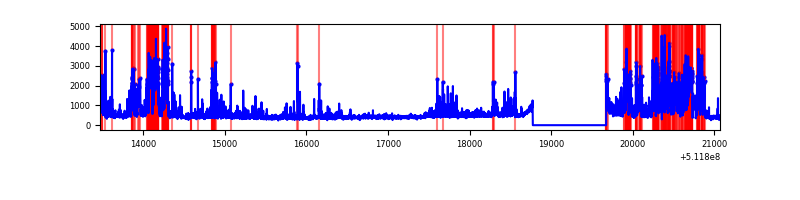 |
Top three noisy pixels from each quadrant. If the there are fewer than three noisy pixels in the level2.evt file, extra rows are filled as -1
| Pixel properties | Quadrant properties | ||||||
|---|---|---|---|---|---|---|---|
| Quadrant | DetID | PixID | Counts | Sigma | Mean | Median | Sigma |
| A | 7 | 64 | 1146436 | 6778.43 | 685 | 665 | 169.0 |
| A | 8 | 26 | 193995 | 1143.75 | 685 | 665 | 169.0 |
| A | 4 | 249 | 92239 | 541.75 | 685 | 665 | 169.0 |
| B | 4 | 236 | 636027 | 4341.73 | 685 | 661 | 146.3 |
| B | 0 | 63 | 136719 | 929.74 | 685 | 661 | 146.3 |
| B | 8 | 128 | 99828 | 677.65 | 685 | 661 | 146.3 |
| C | 15 | 230 | 4376727 | 27764.96 | 567 | 560 | 157.6 |
| C | 13 | 3 | 1107326 | 7021.97 | 567 | 560 | 157.6 |
| C | 15 | 215 | 364265 | 2307.56 | 567 | 560 | 157.6 |
| D | 10 | 199 | 775654 | 4137.9 | 657 | 626 | 187.3 |
| D | 0 | 160 | 557410 | 2972.69 | 657 | 626 | 187.3 |
| D | 6 | 239 | 356548 | 1900.28 | 657 | 626 | 187.3 |
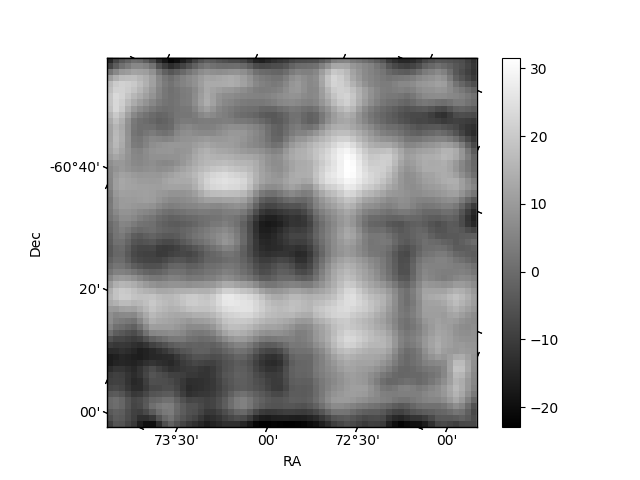
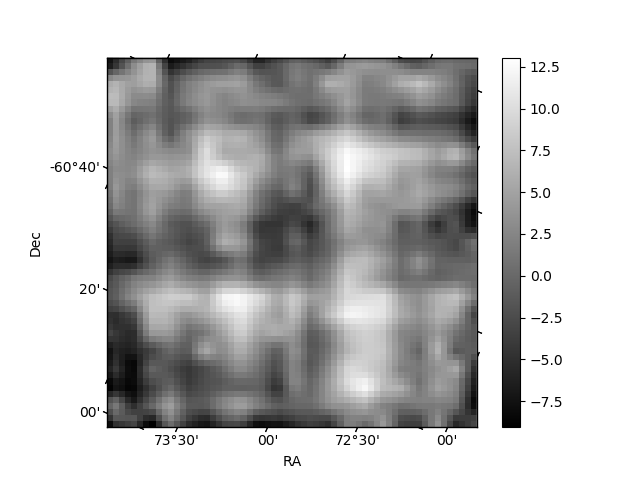
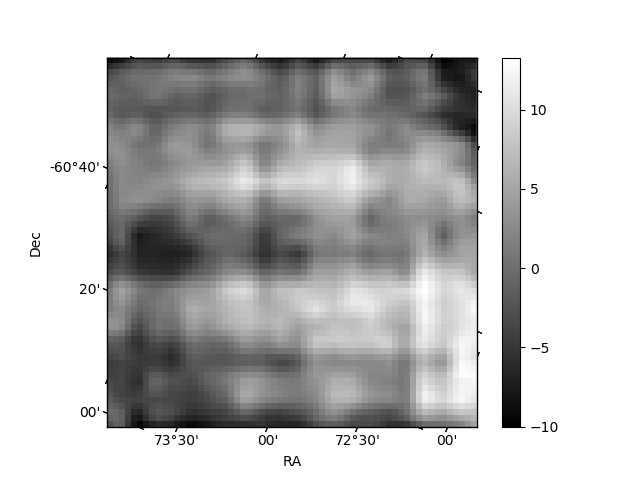
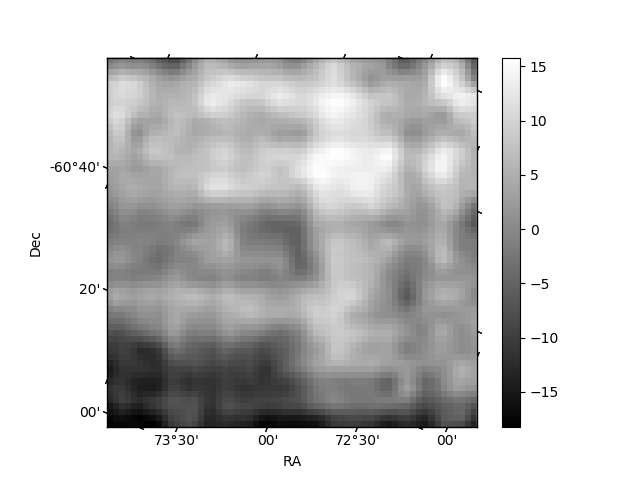
Histogram calculated using DETX and DETY for each event in the final _common_clean file
| Quadrant A | 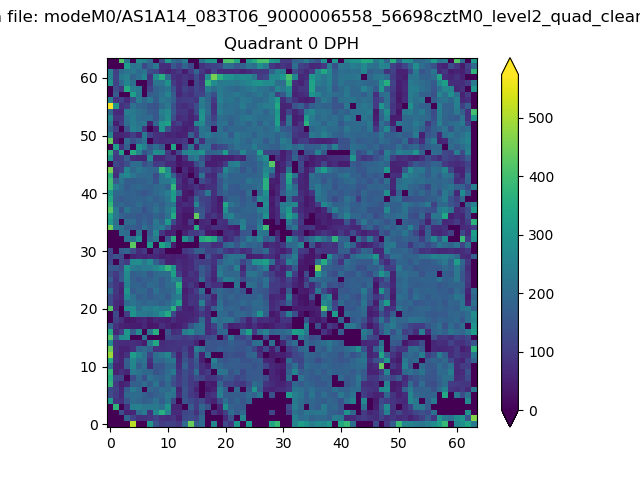 |
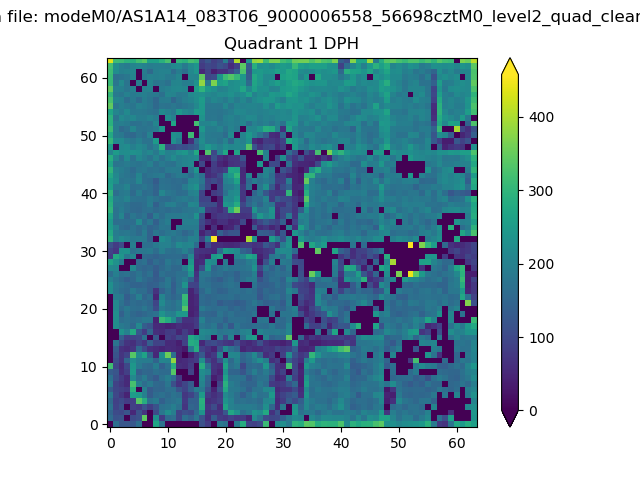 |
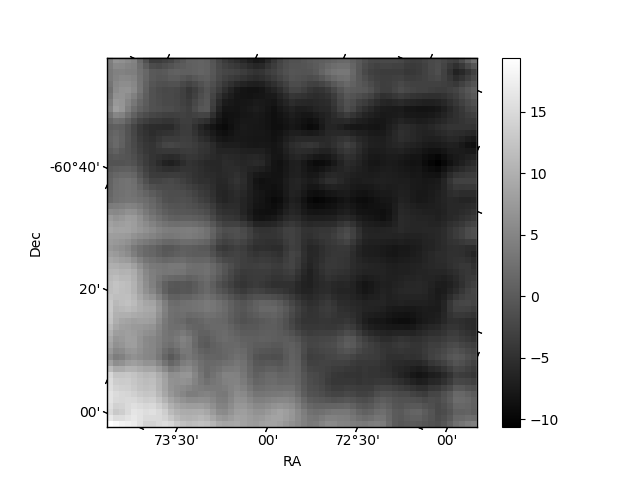
Quadrant B |
|---|---|---|---|
| Quadrant D | 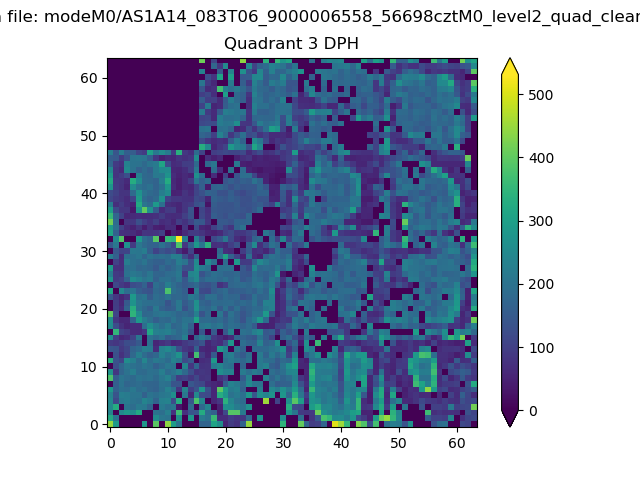 |
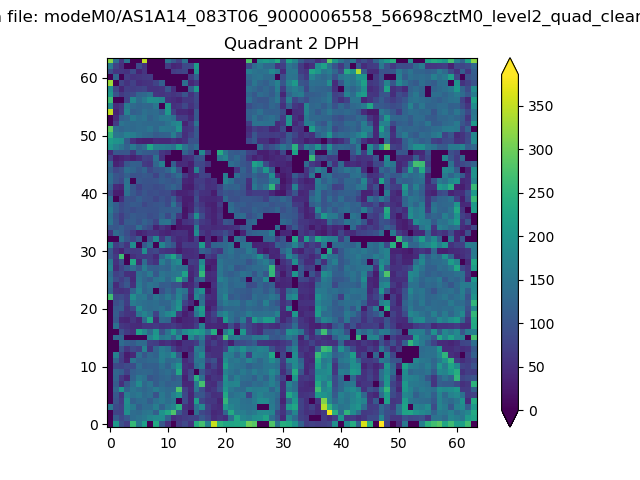 |
Quadrant C |
| Plot type | Count rate plots | Images |
|---|---|---|
| Comparison with Poisson distribution Blue bars denote a histogram of data divided into 1 sec bins. Red curve is a Poisson curve with rate = median count rate of data. |
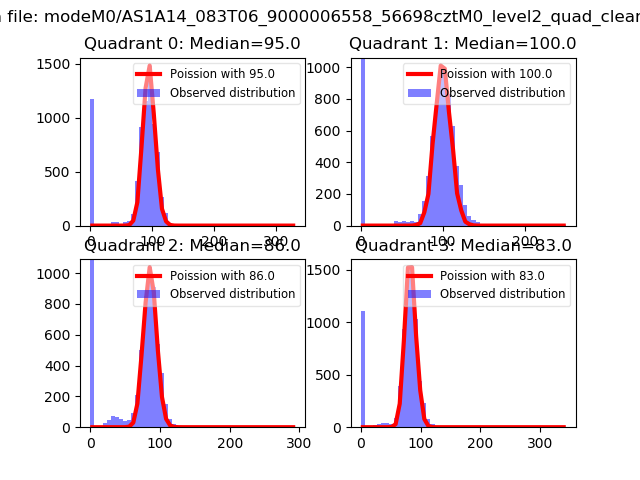 |
 |
| Quadrant-wise count rates Data is divided into 100 sec bins |
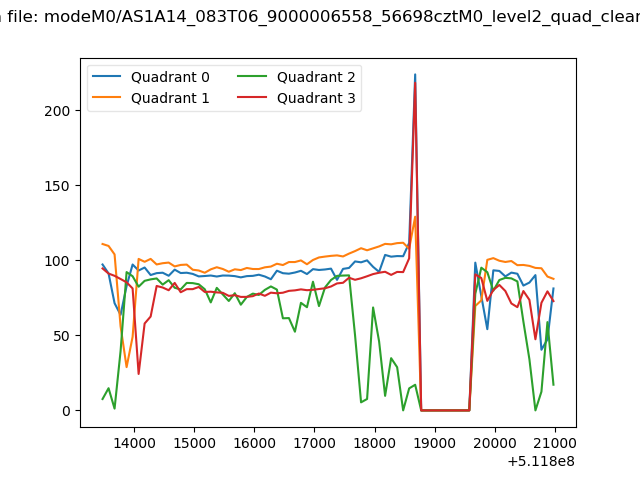 |
|
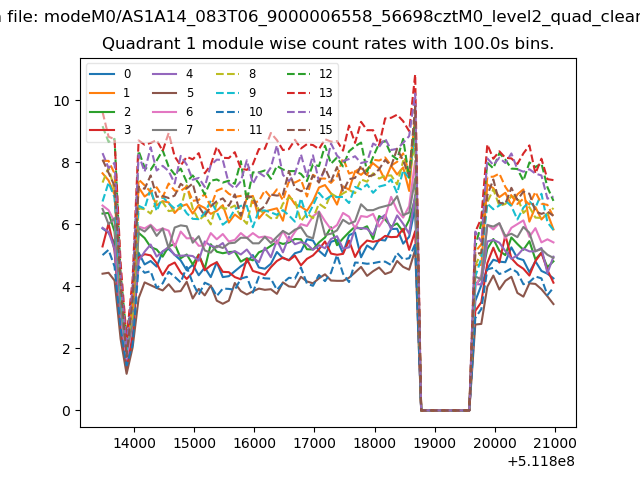
| Module-wise count rates for Quadrant A Data is divided into 100 sec bins |
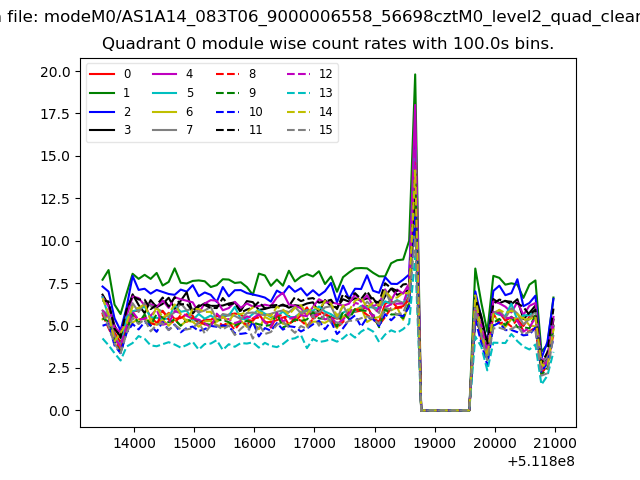 |
 |
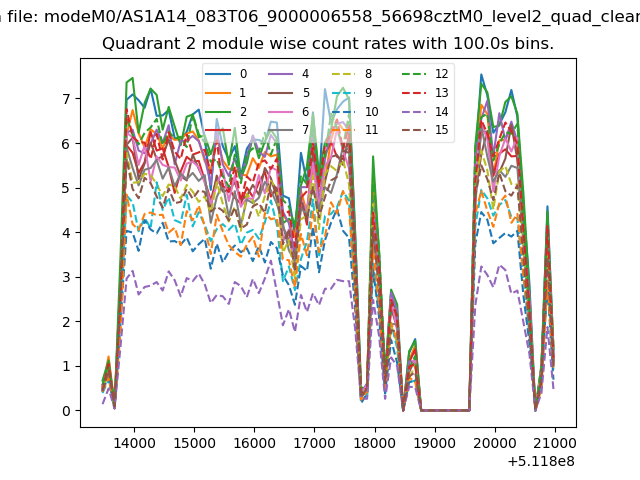
| Module-wise count rates for Quadrant B Data is divided into 100 sec bins |
 |
 |
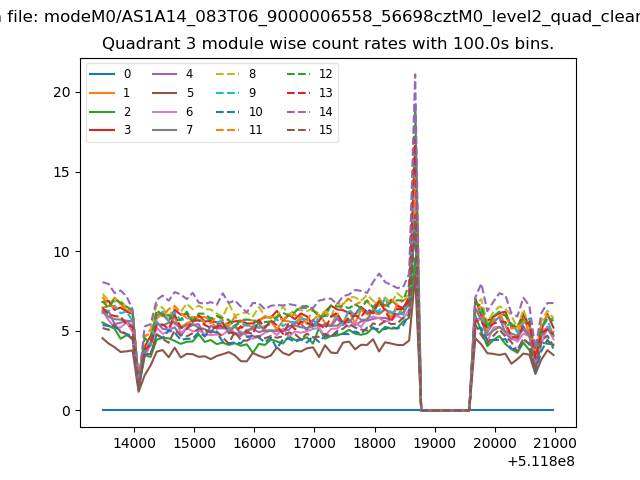
| Module-wise count rates for Quadrant C Data is divided into 100 sec bins |
 |
 |
| Module-wise count rates for Quadrant D Data is divided into 100 sec bins |
 |
 |
| Parameter | Plot |
|---|---|
| CZT HV Monitor | 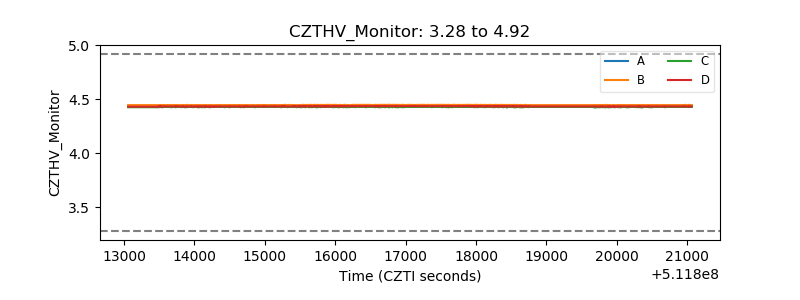 |
| D_VDD | 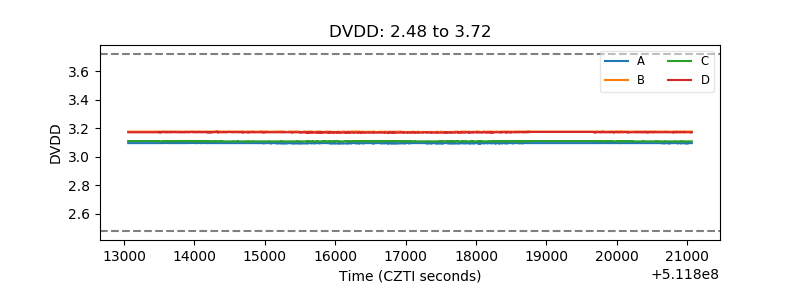 |
| Temperature 1 | 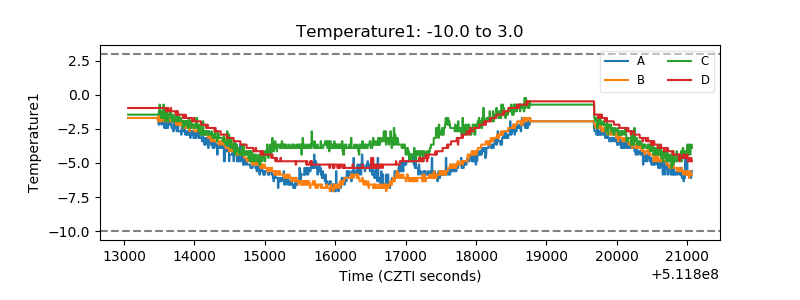 |
| Veto HV Monitor | 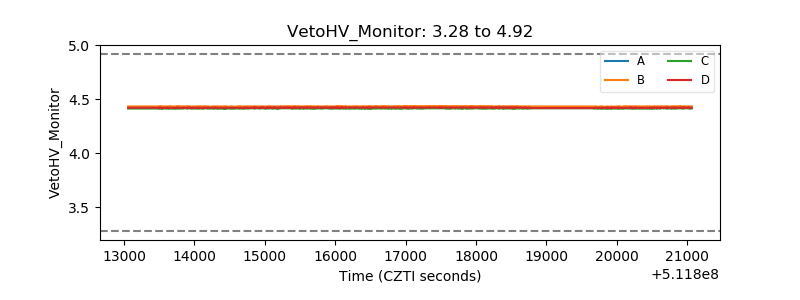 |
| Veto LLD | 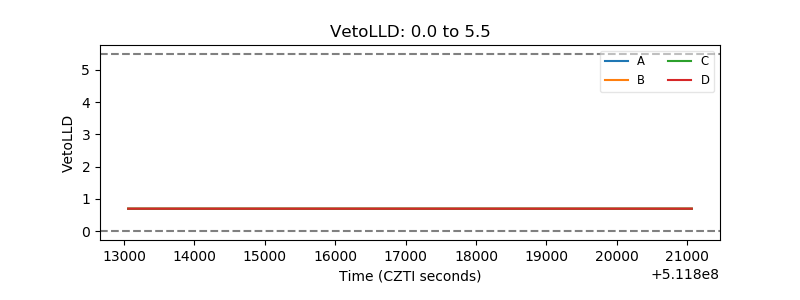 |
| Alpha Counter | 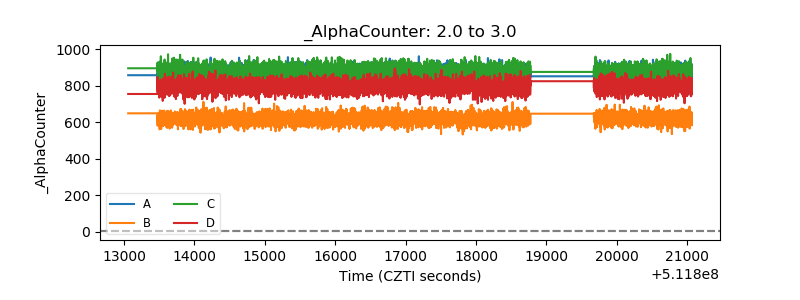 |
| _CPM_Rate | 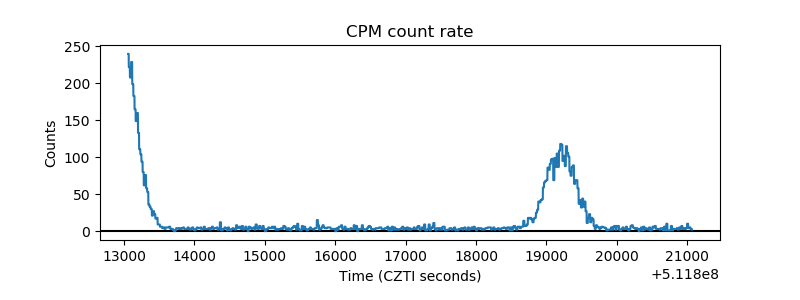 |
| CZT Counter | 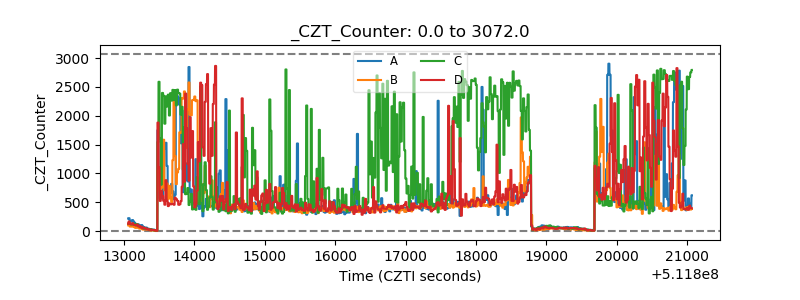 |
| +2.5 Volts monitor |  |
| +5 Volts monitor |  |
| _ROLL_ROT | 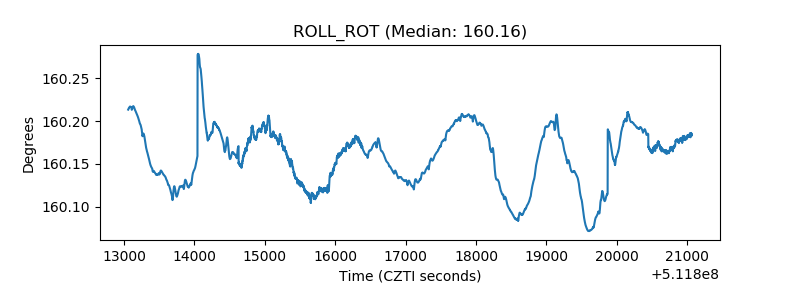 |
| _Roll_DEC | 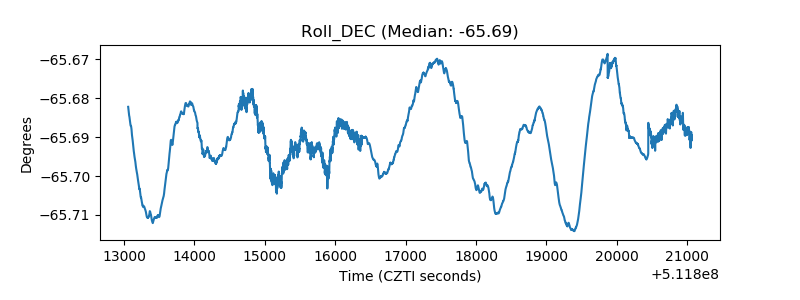 |
| _Roll_RA | 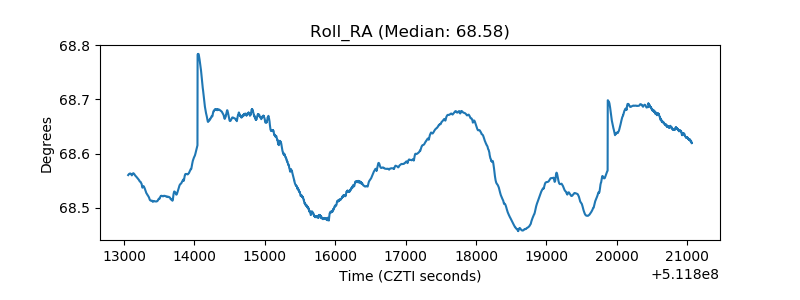 |
| Veto Counter | 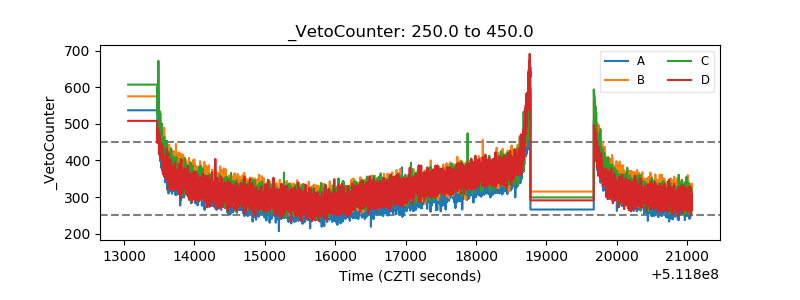 |