| Param | Original file | Final file |
|---|---|---|
| Filename | modeM0/AS1A14_083T06_9000006558_56699cztM0_level2.fits | modeM0/AS1A14_083T06_9000006558_56699cztM0_level2_quad_clean.evt |
| Size (bytes) | 746,830,080 | 91,618,560 |
| Size | 712.2 MB | 87.4 MB |
| Events in quadrant A | 6,099,441 | 633,308 |
| Events in quadrant B | 3,822,296 | 717,222 |
| Events in quadrant C | 12,547,965 | 307,385 |
| Events in quadrant D | 4,611,696 | 610,618 |
| Mode SS | |||
|---|---|---|---|
| Quadrant | BADHDUFLAG | Total packets | Discarded packets |
| A | 0 | 146 | 0 |
| B | 0 | 146 | 0 |
| C | 0 | 146 | 0 |
| D | 0 | 146 | 0 |
| Mode M9 | |||
|---|---|---|---|
| Quadrant | BADHDUFLAG | Total packets | Discarded packets |
| A | 0 | 12 | 0 |
| B | 0 | 12 | 0 |
| C | 0 | 13 | 0 |
| D | 0 | 13 | 0 |
| Mode M0 | |||
|---|---|---|---|
| Quadrant | BADHDUFLAG | Total packets | Discarded packets |
| A | 0 | 23341 | 2 |
| B | 0 | 16852 | 3 |
| C | 0 | 42407 | 2 |
| D | 0 | 19133 | 2 |
| Quadrant | Total seconds | Saturated seconds | Saturation percentage |
|---|---|---|---|
| A | 7261 | 840 | 11.568654% |
| B | 7260 | 303 | 4.173554% |
| C | 7260 | 4005 | 55.165289% |
| D | 7260 | 268 | 3.691460% |
Noise dominated data is calculated using 1-second bins in cleaned event files. If a bin has >2000 counts, and if more than 50% of those come from <1% of pixels, then it is considered to be noise-dominated and hence unusable.
| Quadrant | # 1 sec bins | Bins with >0 counts | Bins with >2000 counts | High rate bins dominated by noise | Noise dominated (total time) | Noise dominated (detector-on time) | Marked lightcurve |
|---|---|---|---|---|---|---|---|
| A | 7726 | 7261 | 714 | 714 | 9.24% | 9.83% | 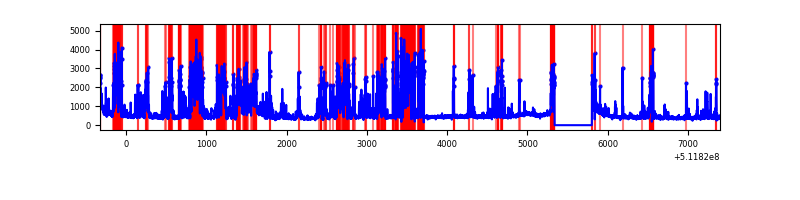 |
| B | 7725 | 7261 | 124 | 124 | 1.61% | 1.71% | 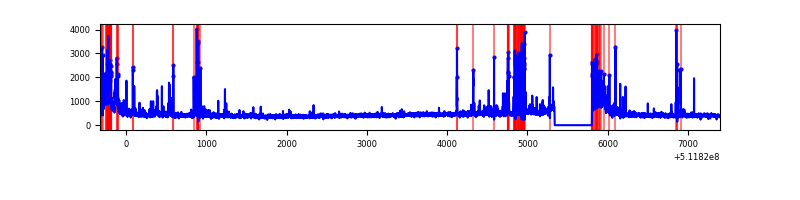 |
| C | 7725 | 7261 | 3528 | 3528 | 45.67% | 48.59% | 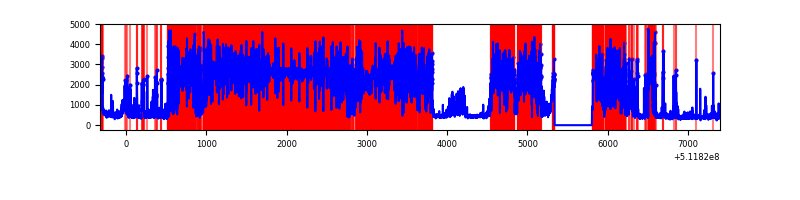 |
| D | 7725 | 7261 | 271 | 271 | 3.51% | 3.73% | 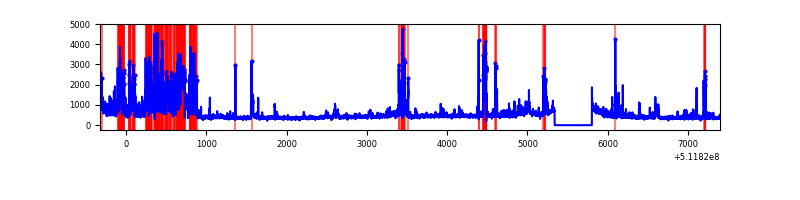 |
Top three noisy pixels from each quadrant. If the there are fewer than three noisy pixels in the level2.evt file, extra rows are filled as -1
| Pixel properties | Quadrant properties | ||||||
|---|---|---|---|---|---|---|---|
| Quadrant | DetID | PixID | Counts | Sigma | Mean | Median | Sigma |
| A | 7 | 64 | 2537017 | 14050.25 | 728 | 710 | 180.5 |
| A | 8 | 26 | 346155 | 1913.64 | 728 | 710 | 180.5 |
| A | 3 | 62 | 163726 | 903.05 | 728 | 710 | 180.5 |
| B | 8 | 128 | 260614 | 1611.67 | 751 | 724 | 161.3 |
| B | 10 | 247 | 158765 | 980.07 | 751 | 724 | 161.3 |
| B | 4 | 236 | 112000 | 690.06 | 751 | 724 | 161.3 |
| C | 15 | 230 | 9788252 | 71347.63 | 500 | 496 | 137.2 |
| C | 1 | 28 | 214312 | 1558.61 | 500 | 496 | 137.2 |
| C | 13 | 3 | 178772 | 1299.54 | 500 | 496 | 137.2 |
| D | 0 | 160 | 602595 | 2934.15 | 727 | 693 | 205.1 |
| D | 2 | 249 | 323652 | 1574.36 | 727 | 693 | 205.1 |
| D | 10 | 199 | 317862 | 1546.13 | 727 | 693 | 205.1 |
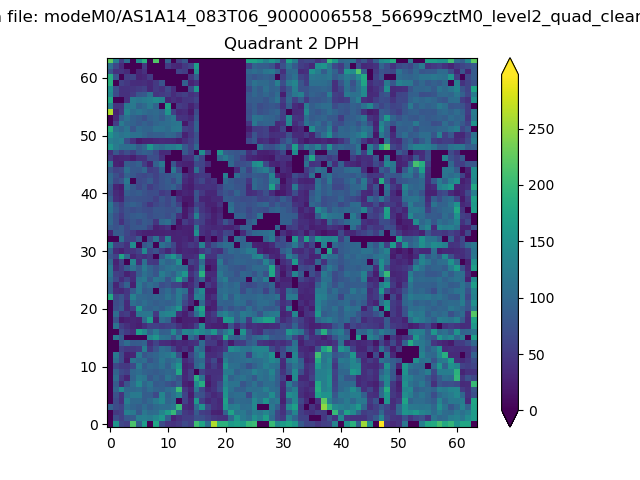
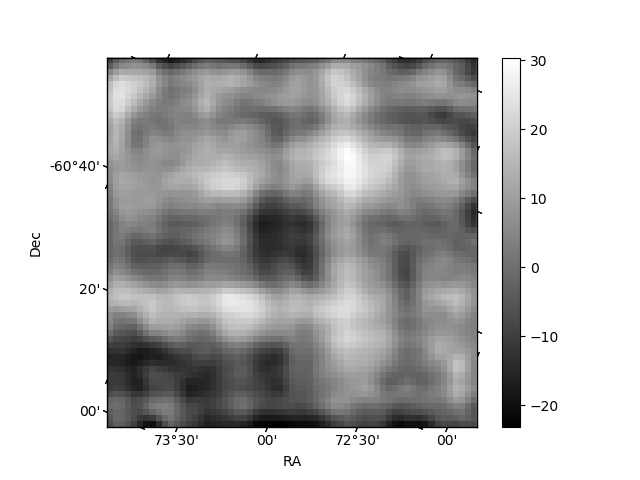
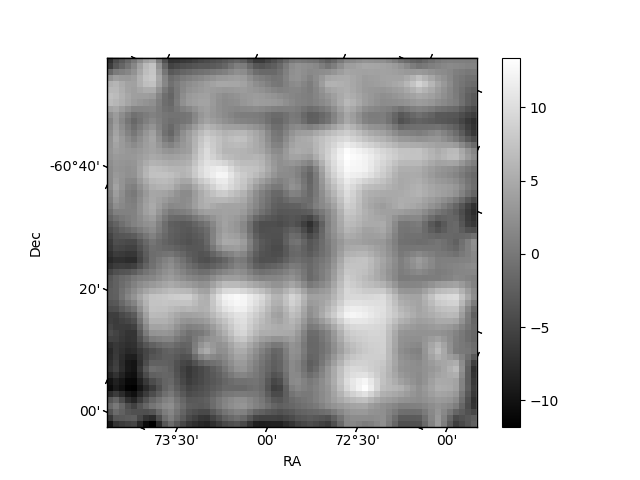
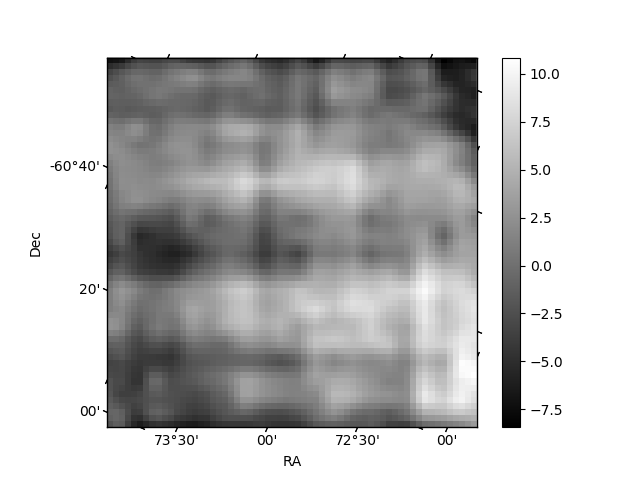
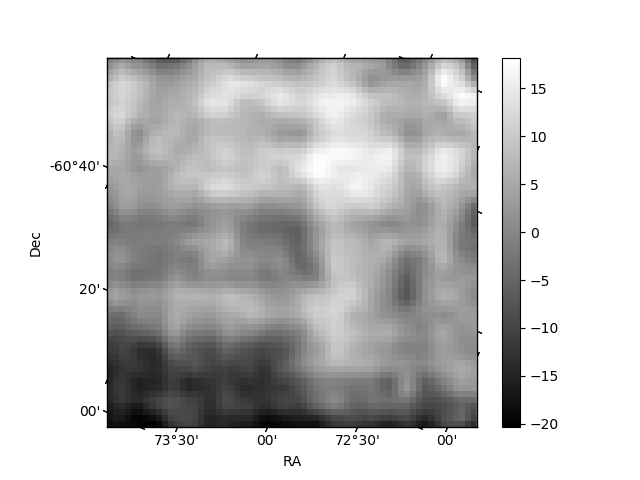
Histogram calculated using DETX and DETY for each event in the final _common_clean file
| Quadrant A | 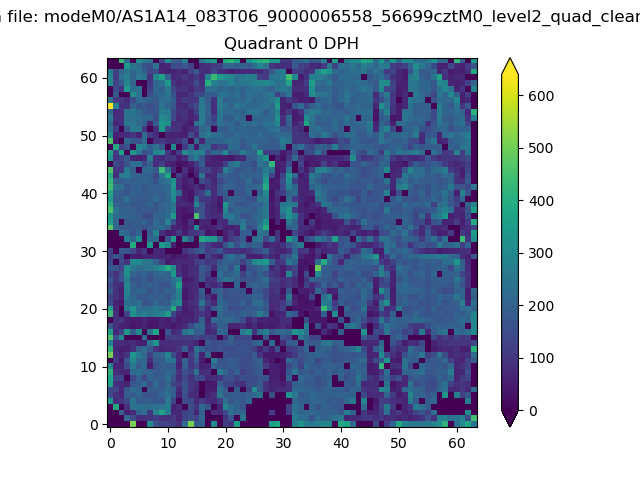 |
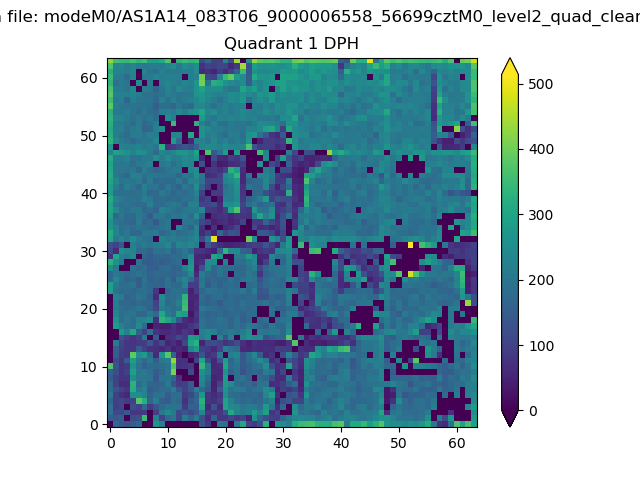 |
Quadrant B |
|---|---|---|---|
| Quadrant D | 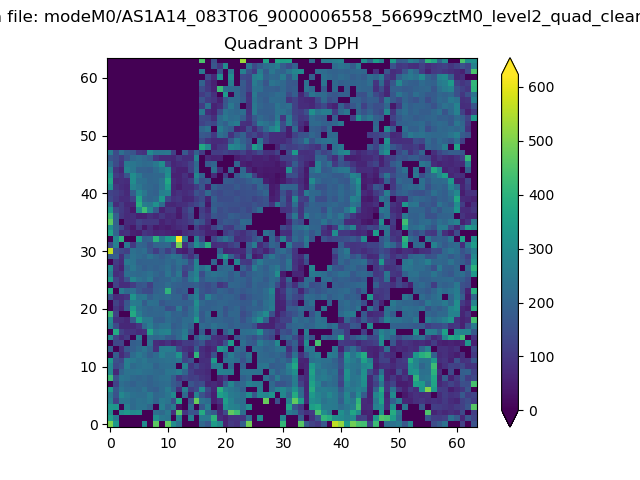 |
 |
Quadrant C |
| Plot type | Count rate plots | Images |
|---|---|---|
| Comparison with Poisson distribution Blue bars denote a histogram of data divided into 1 sec bins. Red curve is a Poisson curve with rate = median count rate of data. |
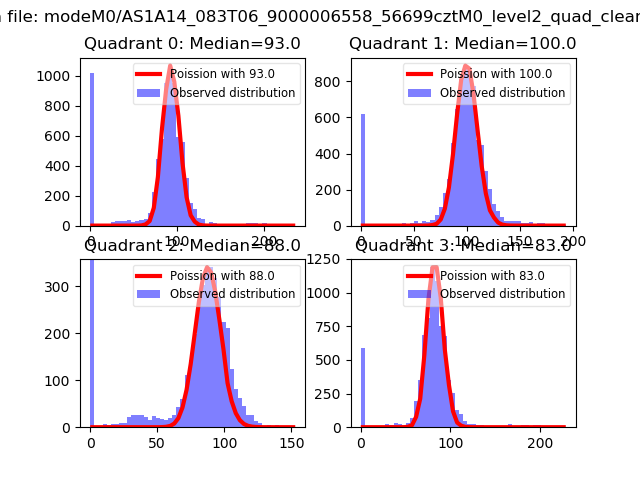 |
 |
| Quadrant-wise count rates Data is divided into 100 sec bins |
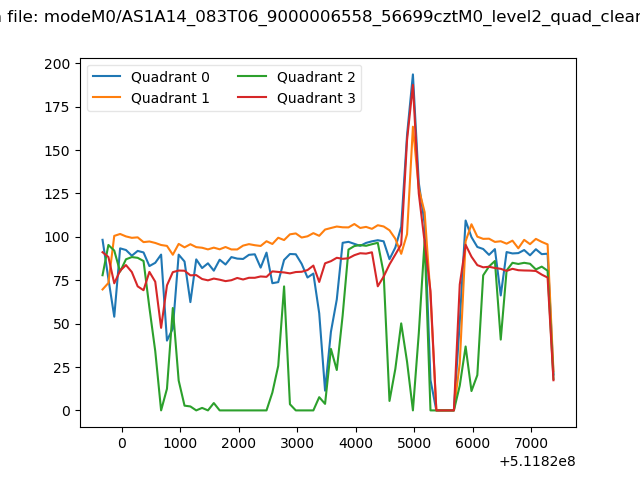 |
|
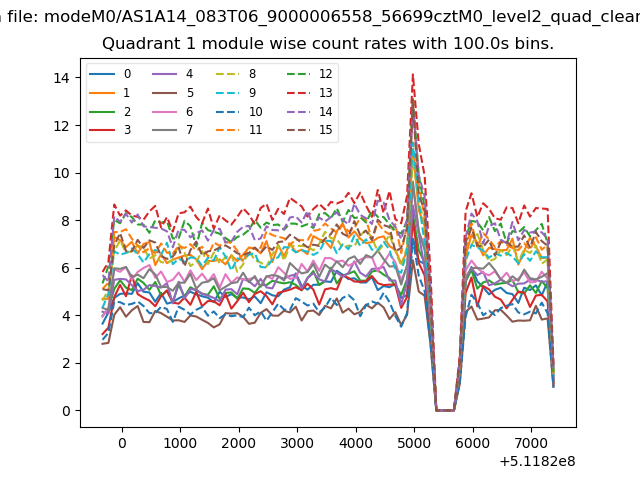
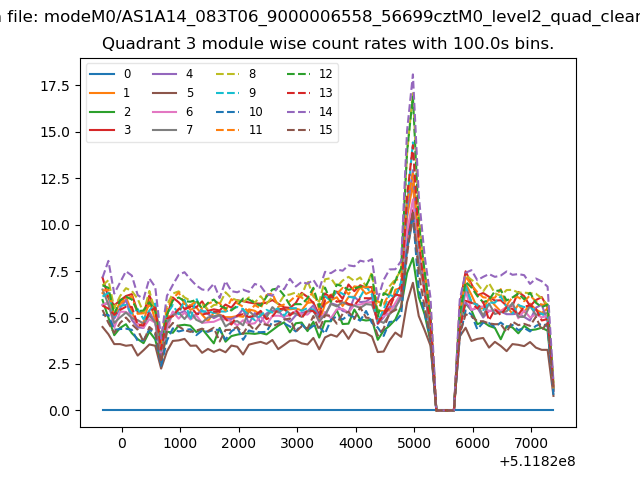
| Module-wise count rates for Quadrant A Data is divided into 100 sec bins |
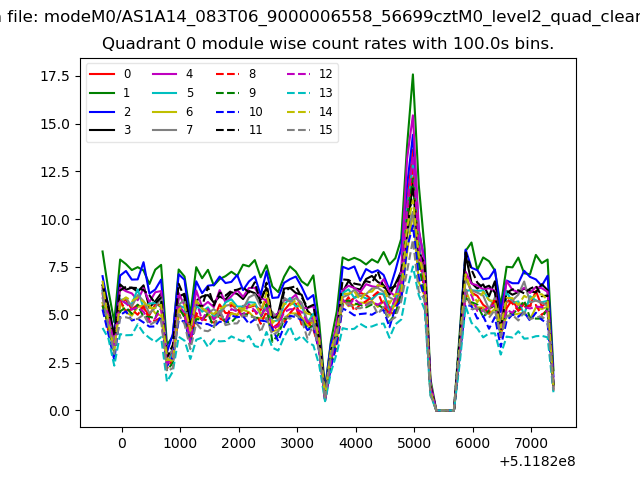 |
 |
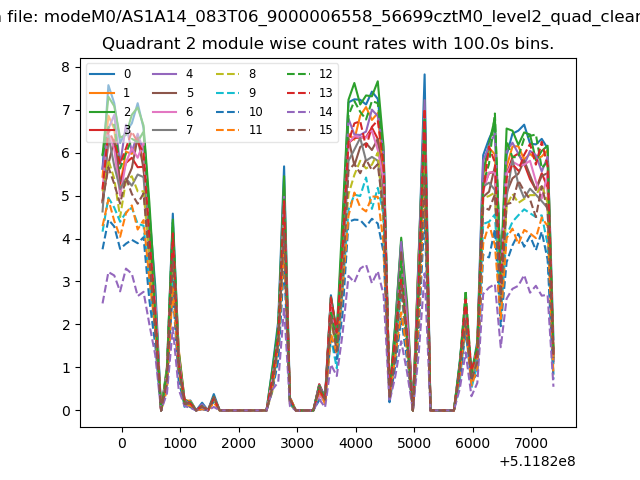
| Module-wise count rates for Quadrant B Data is divided into 100 sec bins |
 |
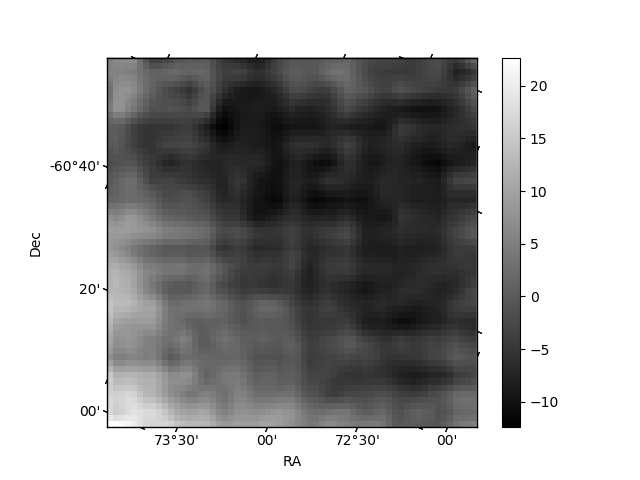 |
| Module-wise count rates for Quadrant C Data is divided into 100 sec bins |
 |
 |
| Module-wise count rates for Quadrant D Data is divided into 100 sec bins |
 |
 |
| Parameter | Plot |
|---|---|
| CZT HV Monitor | 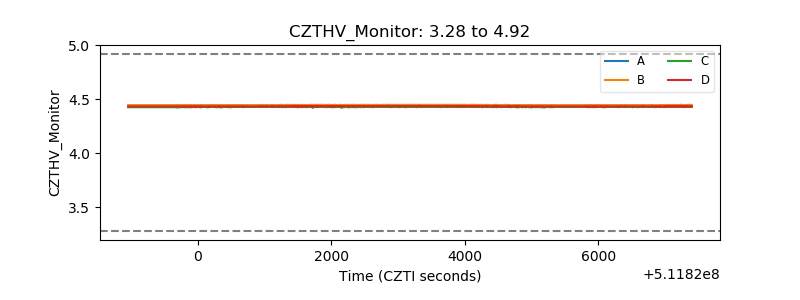 |
| D_VDD | 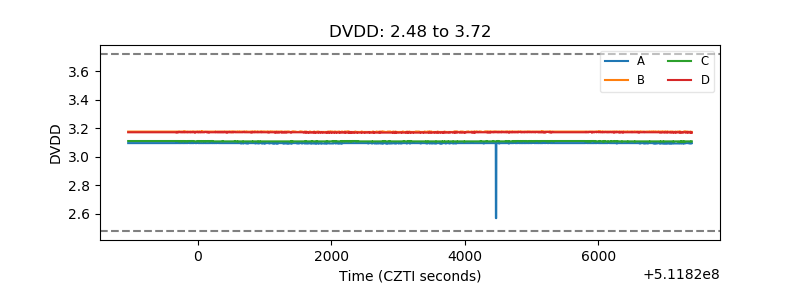 |
| Temperature 1 | 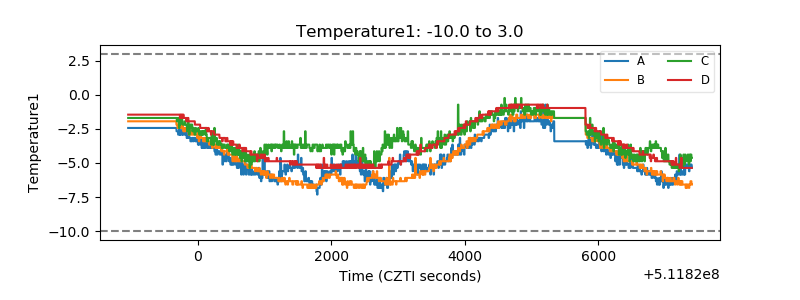 |
| Veto HV Monitor | 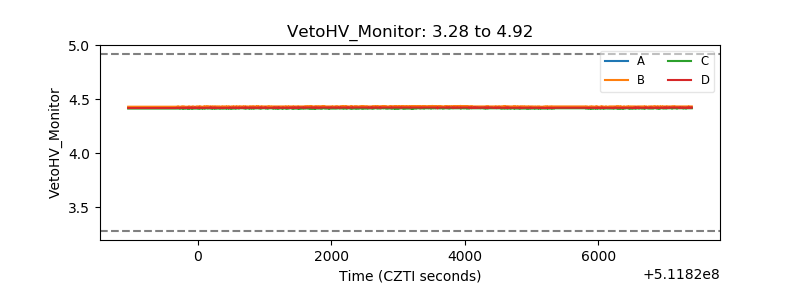 |
| Veto LLD | 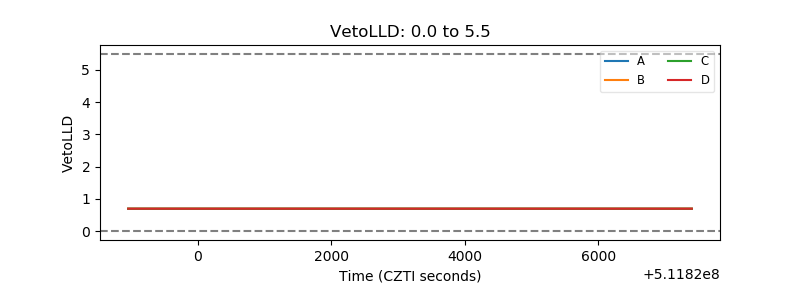 |
| Alpha Counter | 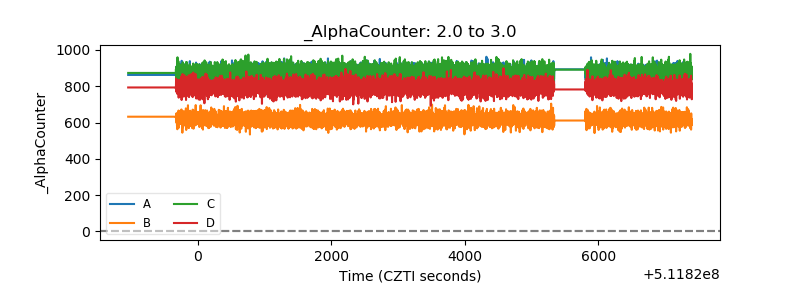 |
| _CPM_Rate | 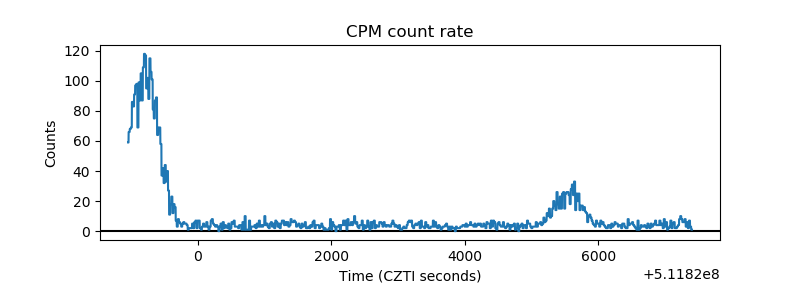 |
| CZT Counter | 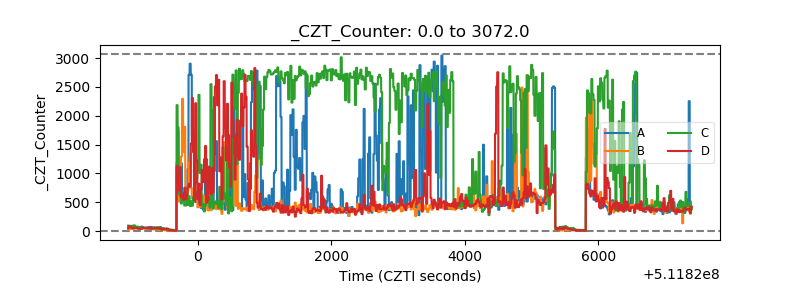 |
| +2.5 Volts monitor |  |
| +5 Volts monitor |  |
| _ROLL_ROT | 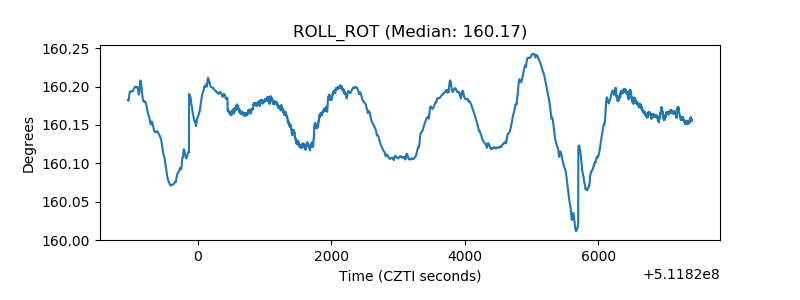 |
| _Roll_DEC | 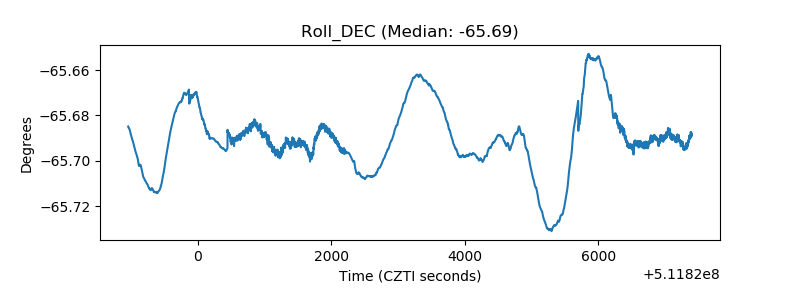 |
| _Roll_RA | 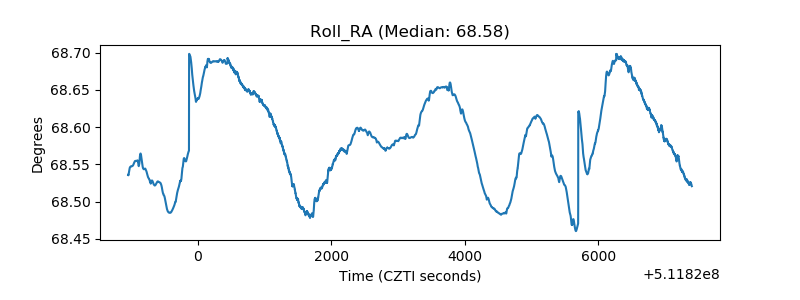 |
| Veto Counter | 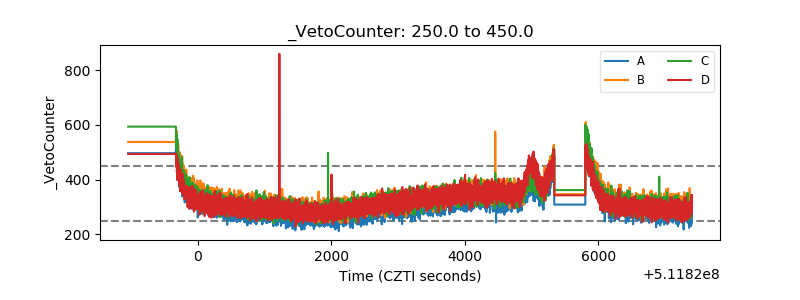 |