| Param | Original file | Final file |
|---|---|---|
| Filename | modeM0/AS1A14_083T06_9000006558_56700cztM0_level2.fits | modeM0/AS1A14_083T06_9000006558_56700cztM0_level2_quad_clean.evt |
| Size (bytes) | 569,016,000 | 110,232,000 |
| Size | 542.7 MB | 105.1 MB |
| Events in quadrant A | 4,865,196 | 734,787 |
| Events in quadrant B | 3,767,822 | 802,009 |
| Events in quadrant C | 7,893,178 | 573,745 |
| Events in quadrant D | 3,912,059 | 668,546 |
| Mode SS | |||
|---|---|---|---|
| Quadrant | BADHDUFLAG | Total packets | Discarded packets |
| A | 0 | 162 | 0 |
| B | 0 | 162 | 0 |
| C | 0 | 162 | 0 |
| D | 0 | 162 | 0 |
| Mode M9 | |||
|---|---|---|---|
| Quadrant | BADHDUFLAG | Total packets | Discarded packets |
| A | 0 | 5 | 0 |
| B | 0 | 5 | 0 |
| C | 0 | 5 | 0 |
| D | 0 | 5 | 0 |
| Mode M0 | |||
|---|---|---|---|
| Quadrant | BADHDUFLAG | Total packets | Discarded packets |
| A | 0 | 20493 | 1 |
| B | 0 | 17385 | 1 |
| C | 0 | 29390 | 1 |
| D | 0 | 17841 | 1 |
| Quadrant | Total seconds | Saturated seconds | Saturation percentage |
|---|---|---|---|
| A | 8037 | 330 | 4.106010% |
| B | 8037 | 167 | 2.077890% |
| C | 8038 | 1641 | 20.415526% |
| D | 8038 | 73 | 0.908186% |
Noise dominated data is calculated using 1-second bins in cleaned event files. If a bin has >2000 counts, and if more than 50% of those come from <1% of pixels, then it is considered to be noise-dominated and hence unusable.
| Quadrant | # 1 sec bins | Bins with >0 counts | Bins with >2000 counts | High rate bins dominated by noise | Noise dominated (total time) | Noise dominated (detector-on time) | Marked lightcurve |
|---|---|---|---|---|---|---|---|
| A | 8502 | 8037 | 227 | 227 | 2.67% | 2.82% | 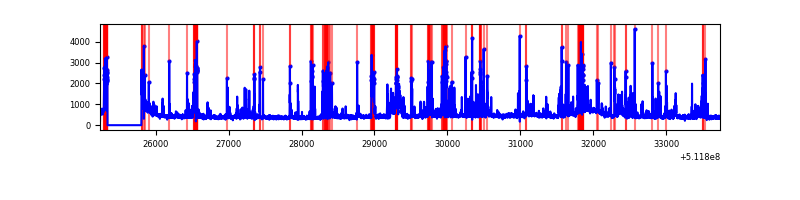 |
| B | 8502 | 8038 | 34 | 34 | 0.40% | 0.42% | 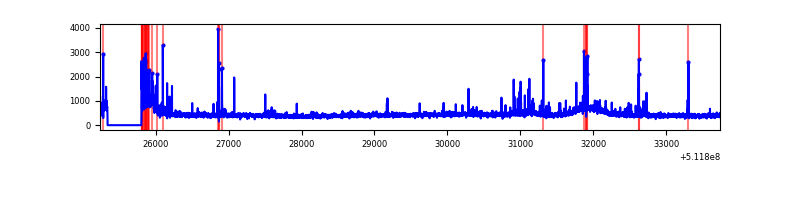 |
| C | 8503 | 8039 | 1352 | 1352 | 15.90% | 16.82% | 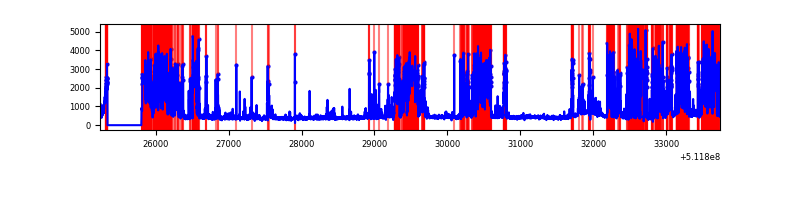 |
| D | 8503 | 8039 | 50 | 50 | 0.59% | 0.62% | 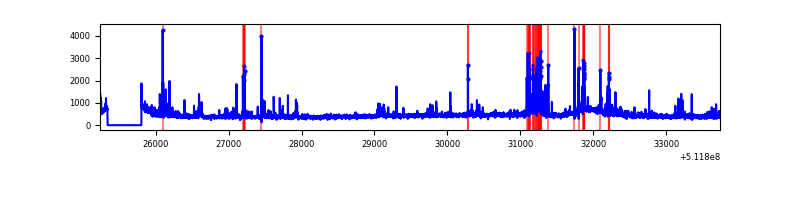 |
Top three noisy pixels from each quadrant. If the there are fewer than three noisy pixels in the level2.evt file, extra rows are filled as -1
| Pixel properties | Quadrant properties | ||||||
|---|---|---|---|---|---|---|---|
| Quadrant | DetID | PixID | Counts | Sigma | Mean | Median | Sigma |
| A | 8 | 26 | 614829 | 2950.47 | 844 | 822 | 208.1 |
| A | 0 | 8 | 530076 | 2543.21 | 844 | 822 | 208.1 |
| A | 3 | 62 | 328342 | 1573.82 | 844 | 822 | 208.1 |
| B | 10 | 247 | 147973 | 801.18 | 851 | 819 | 183.7 |
| B | 4 | 21 | 57672 | 309.53 | 851 | 819 | 183.7 |
| B | 10 | 16 | 48899 | 261.77 | 851 | 819 | 183.7 |
| C | 13 | 3 | 2336128 | 11548.16 | 740 | 731 | 202.2 |
| C | 15 | 230 | 2038468 | 10076.28 | 740 | 731 | 202.2 |
| C | 1 | 28 | 209857 | 1034.09 | 740 | 731 | 202.2 |
| D | 2 | 249 | 301469 | 1309.9 | 825 | 787 | 229.5 |
| D | 5 | 173 | 68273 | 294.0 | 825 | 787 | 229.5 |
| D | 2 | 236 | 56006 | 240.56 | 825 | 787 | 229.5 |
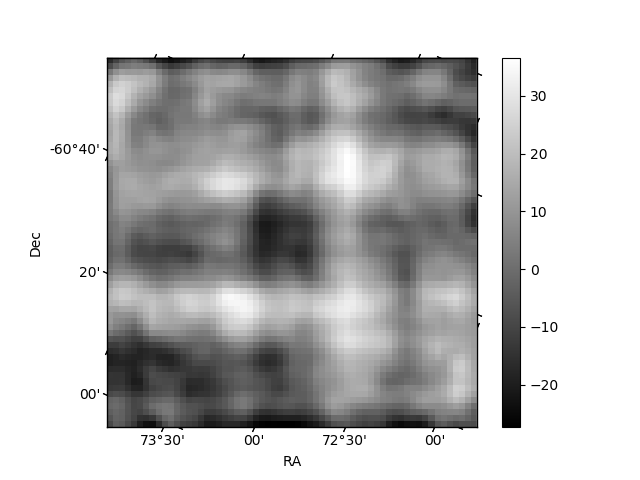
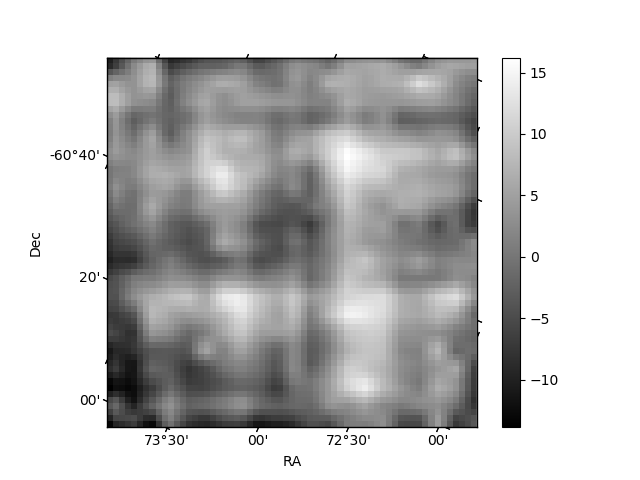
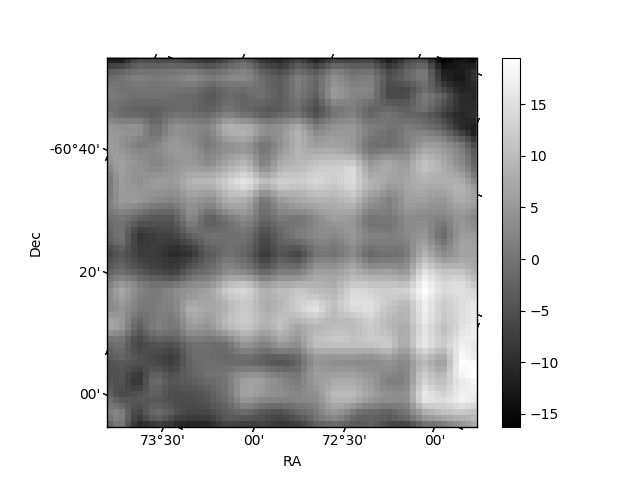
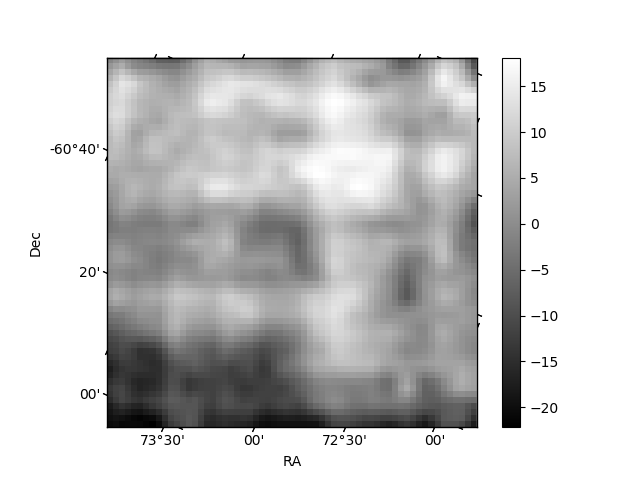
Histogram calculated using DETX and DETY for each event in the final _common_clean file
| Quadrant A | 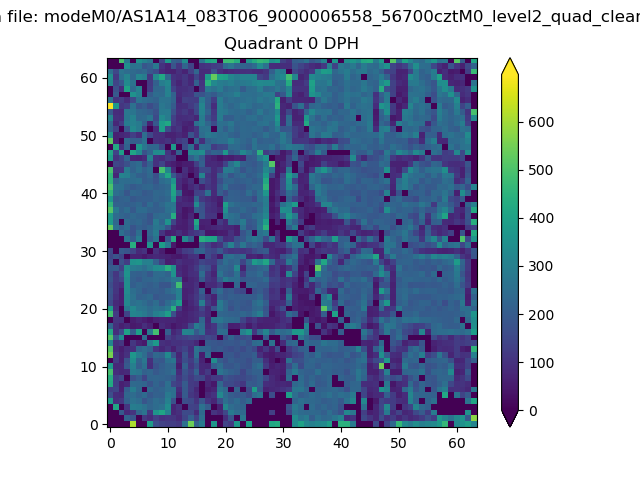 |
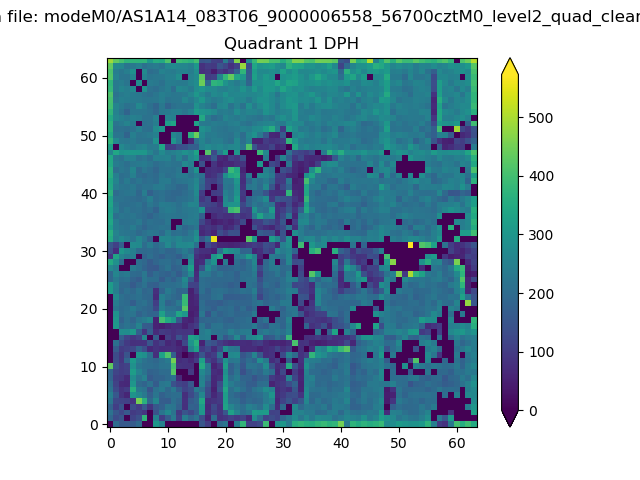 |
Quadrant B |
|---|---|---|---|
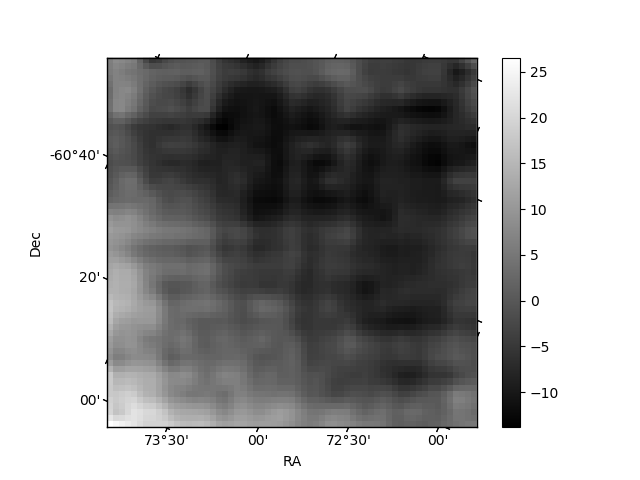
| Quadrant D | 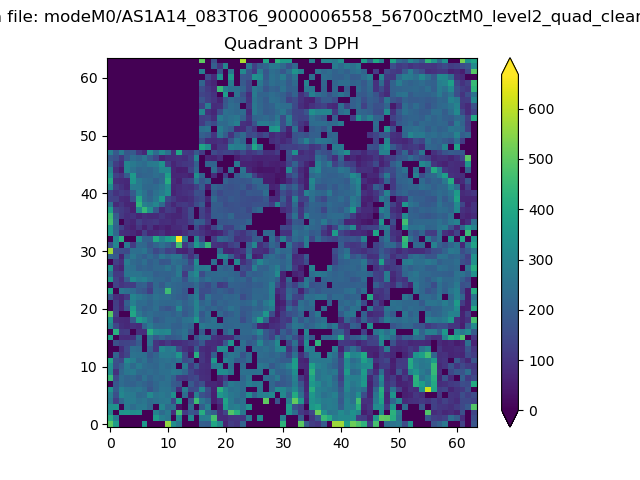 |
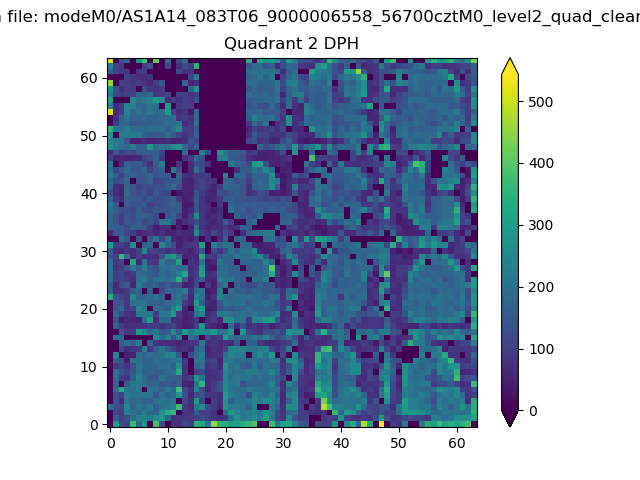 |
Quadrant C |
| Plot type | Count rate plots | Images |
|---|---|---|
| Comparison with Poisson distribution Blue bars denote a histogram of data divided into 1 sec bins. Red curve is a Poisson curve with rate = median count rate of data. |
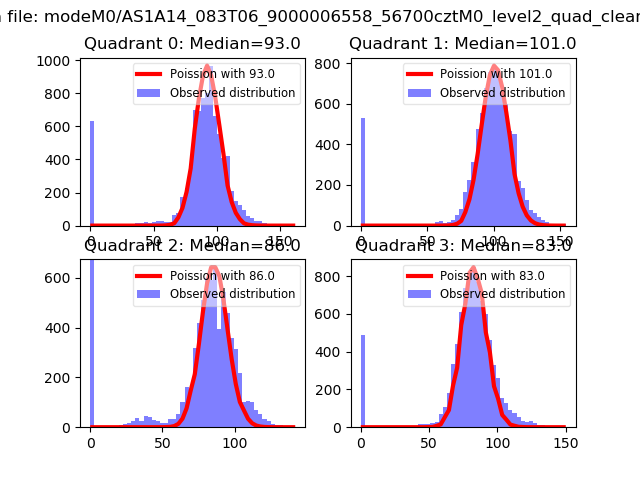 |
 |
| Quadrant-wise count rates Data is divided into 100 sec bins |
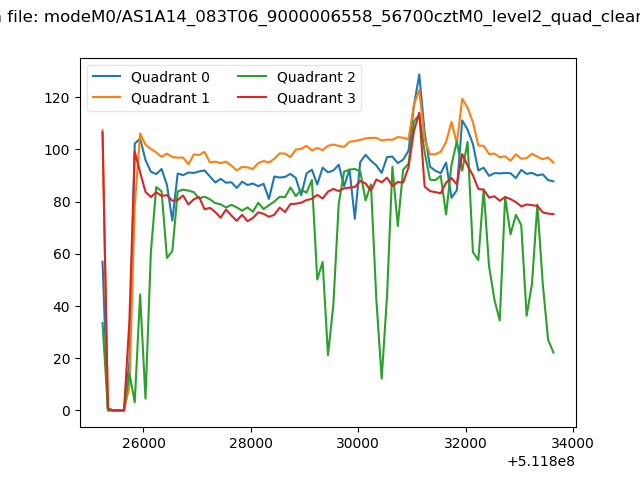 |
|
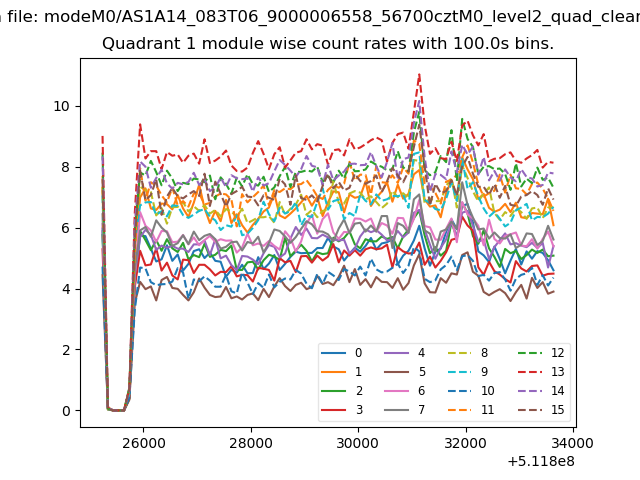
| Module-wise count rates for Quadrant A Data is divided into 100 sec bins |
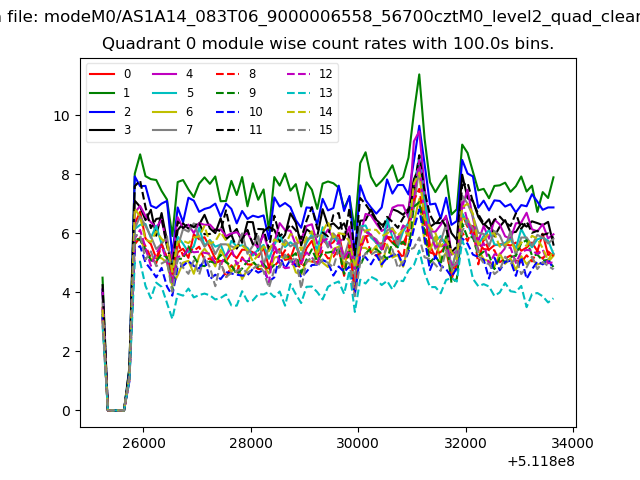 |
 |
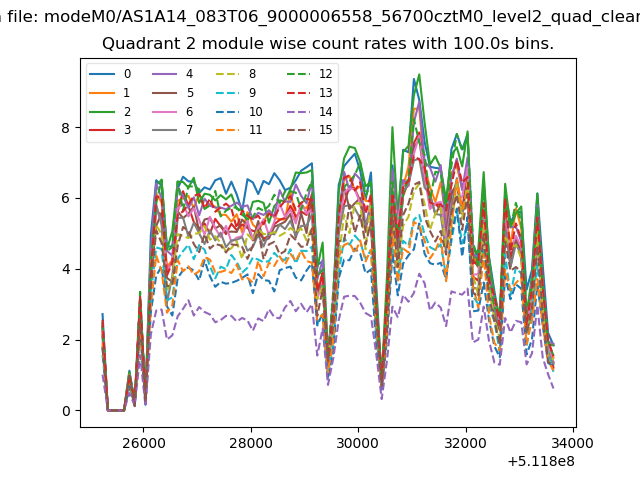
| Module-wise count rates for Quadrant B Data is divided into 100 sec bins |
 |
 |
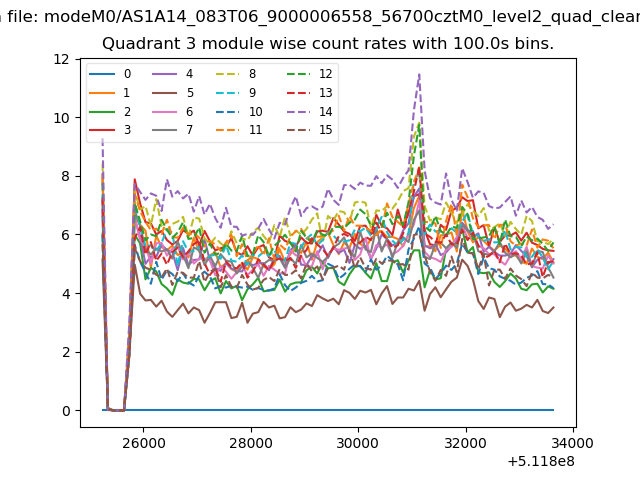
| Module-wise count rates for Quadrant C Data is divided into 100 sec bins |
 |
 |
| Module-wise count rates for Quadrant D Data is divided into 100 sec bins |
 |
 |
| Parameter | Plot |
|---|---|
| CZT HV Monitor | 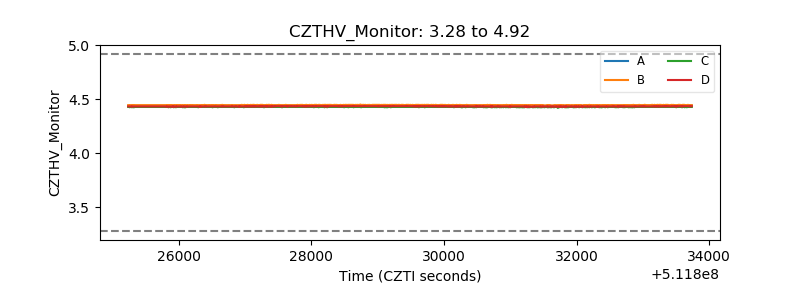 |
| D_VDD | 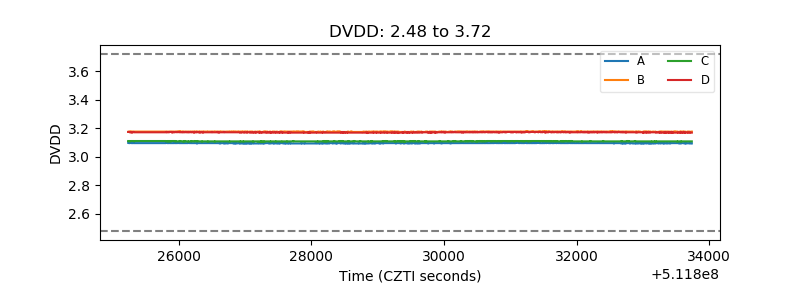 |
| Temperature 1 | 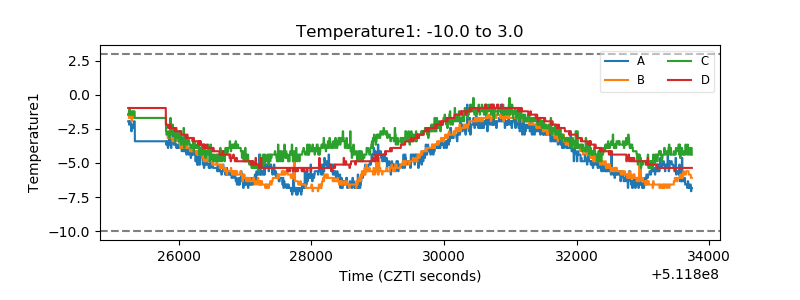 |
| Veto HV Monitor | 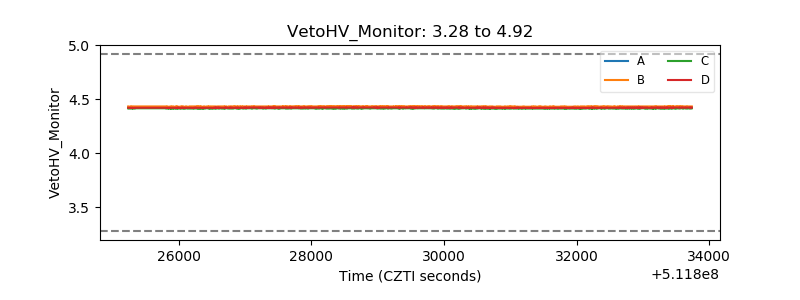 |
| Veto LLD | 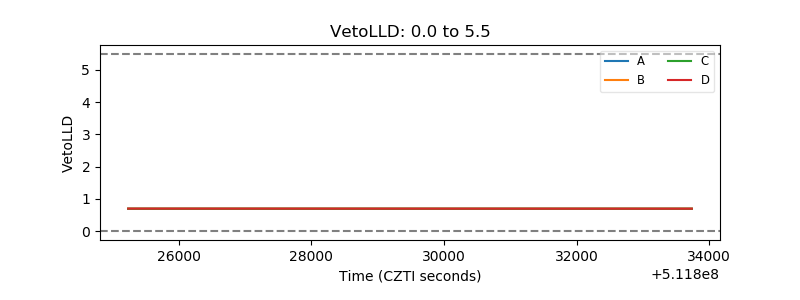 |
| Alpha Counter | 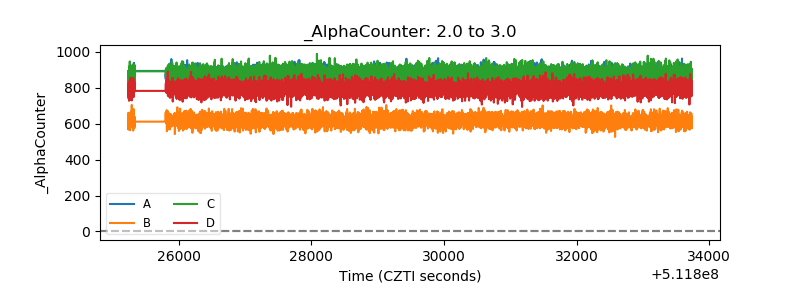 |
| _CPM_Rate | 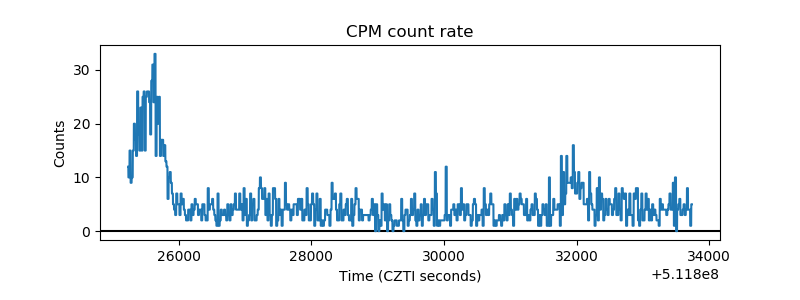 |
| CZT Counter | 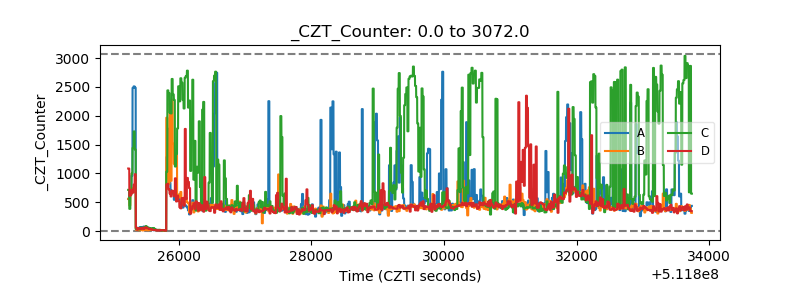 |
| +2.5 Volts monitor |  |
| +5 Volts monitor |  |
| _ROLL_ROT | 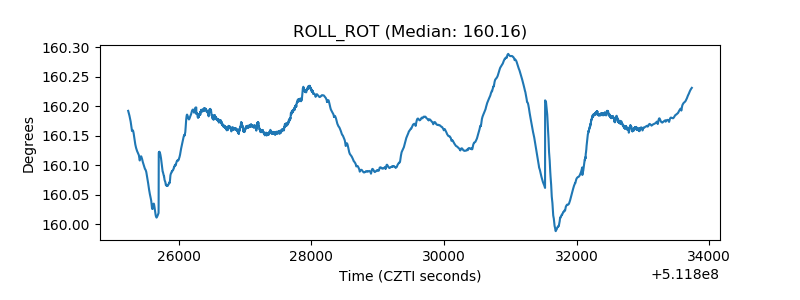 |
| _Roll_DEC | 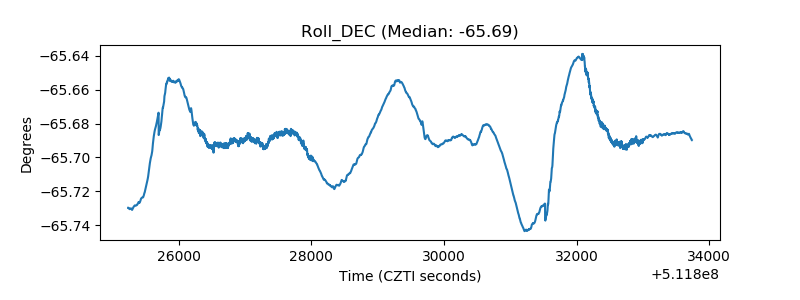 |
| _Roll_RA | 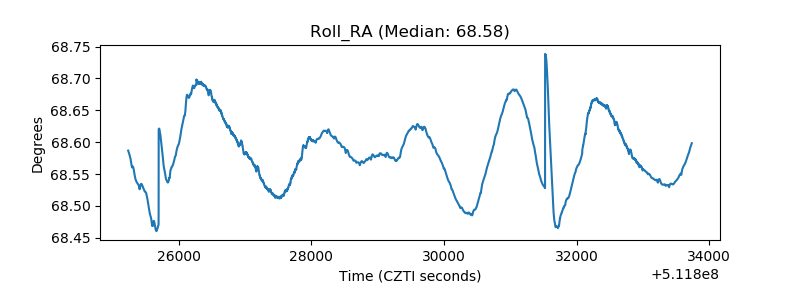 |
| Veto Counter | 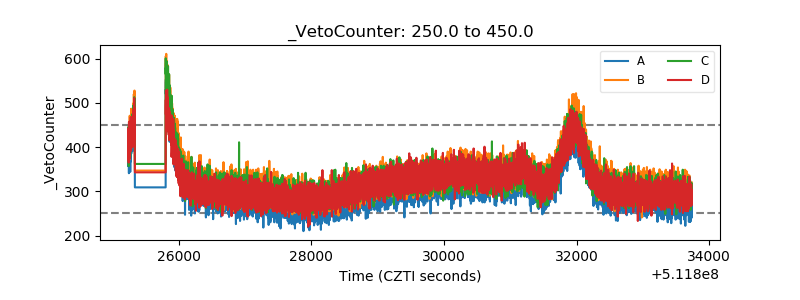 |