| Param | Original file | Final file |
|---|---|---|
| Filename | modeM0/AS1A14_083T06_9000006558_56701cztM0_level2.fits | modeM0/AS1A14_083T06_9000006558_56701cztM0_level2_quad_clean.evt |
| Size (bytes) | 610,925,760 | 120,597,120 |
| Size | 582.6 MB | 115.0 MB |
| Events in quadrant A | 5,312,758 | 801,717 |
| Events in quadrant B | 3,939,686 | 875,289 |
| Events in quadrant C | 8,388,562 | 644,378 |
| Events in quadrant D | 4,294,595 | 722,993 |
| Mode SS | |||
|---|---|---|---|
| Quadrant | BADHDUFLAG | Total packets | Discarded packets |
| A | 0 | 174 | 0 |
| B | 0 | 174 | 0 |
| C | 0 | 174 | 0 |
| D | 0 | 174 | 0 |
| Mode M0 | |||
|---|---|---|---|
| Quadrant | BADHDUFLAG | Total packets | Discarded packets |
| A | 0 | 22167 | 0 |
| B | 0 | 18500 | 0 |
| C | 0 | 30735 | 0 |
| D | 0 | 19392 | 0 |
| Quadrant | Total seconds | Saturated seconds | Saturation percentage |
|---|---|---|---|
| A | 8743 | 267 | 3.053872% |
| B | 8743 | 63 | 0.720576% |
| C | 8744 | 1450 | 16.582800% |
| D | 8744 | 58 | 0.663312% |
Noise dominated data is calculated using 1-second bins in cleaned event files. If a bin has >2000 counts, and if more than 50% of those come from <1% of pixels, then it is considered to be noise-dominated and hence unusable.
| Quadrant | # 1 sec bins | Bins with >0 counts | Bins with >2000 counts | High rate bins dominated by noise | Noise dominated (total time) | Noise dominated (detector-on time) | Marked lightcurve |
|---|---|---|---|---|---|---|---|
| A | 8743 | 8743 | 196 | 196 | 2.24% | 2.24% | 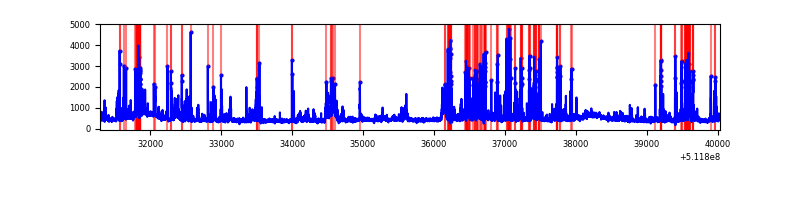 |
| B | 8743 | 8743 | 23 | 23 | 0.26% | 0.26% | 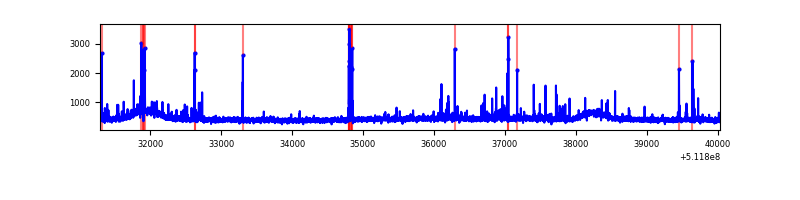 |
| C | 8744 | 8744 | 1236 | 1236 | 14.14% | 14.14% | 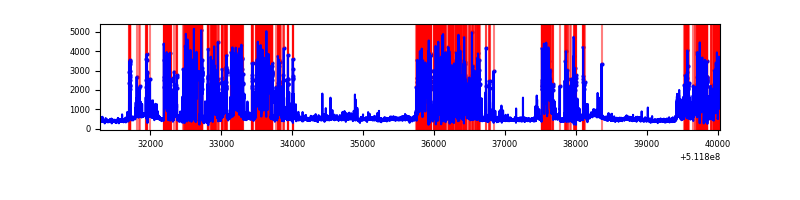 |
| D | 8744 | 8744 | 50 | 50 | 0.57% | 0.57% | 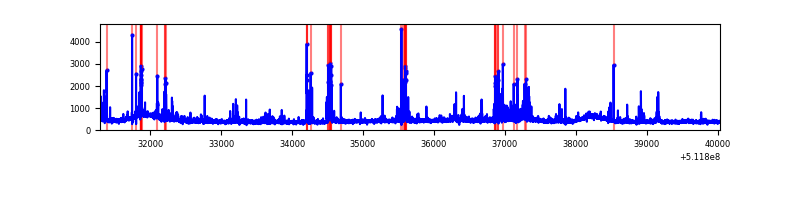 |
Top three noisy pixels from each quadrant. If the there are fewer than three noisy pixels in the level2.evt file, extra rows are filled as -1
| Pixel properties | Quadrant properties | ||||||
|---|---|---|---|---|---|---|---|
| Quadrant | DetID | PixID | Counts | Sigma | Mean | Median | Sigma |
| A | 3 | 62 | 898745 | 3927.61 | 921 | 893 | 228.6 |
| A | 0 | 8 | 439806 | 1920.0 | 921 | 893 | 228.6 |
| A | 8 | 26 | 229290 | 999.11 | 921 | 893 | 228.6 |
| B | 10 | 247 | 62791 | 307.72 | 931 | 896 | 201.1 |
| B | 0 | 213 | 40878 | 198.78 | 931 | 896 | 201.1 |
| B | 4 | 21 | 36416 | 176.59 | 931 | 896 | 201.1 |
| C | 13 | 3 | 3713054 | 16371.81 | 831 | 820 | 226.7 |
| C | 15 | 164 | 515983 | 2271.99 | 831 | 820 | 226.7 |
| C | 15 | 230 | 425316 | 1872.12 | 831 | 820 | 226.7 |
| D | 2 | 249 | 383985 | 1525.74 | 898 | 855 | 251.1 |
| D | 3 | 12 | 92888 | 366.5 | 898 | 855 | 251.1 |
| D | 5 | 173 | 82294 | 324.31 | 898 | 855 | 251.1 |
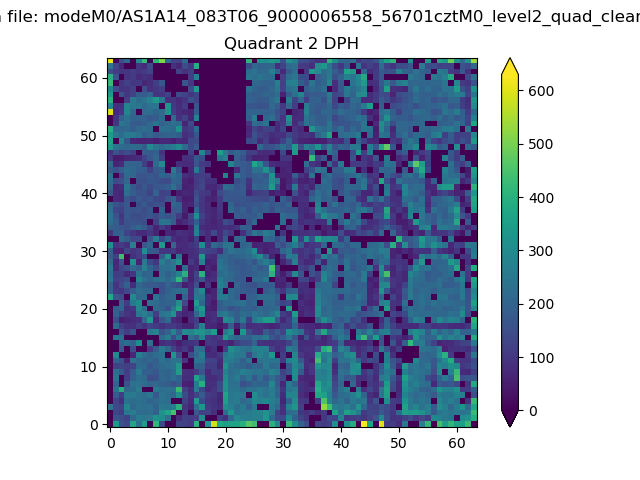
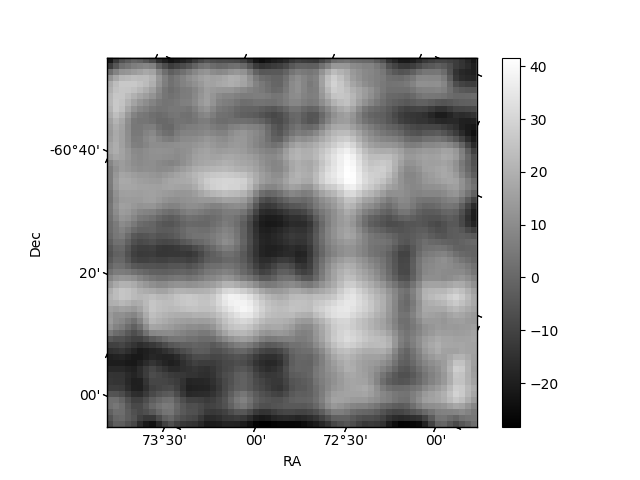
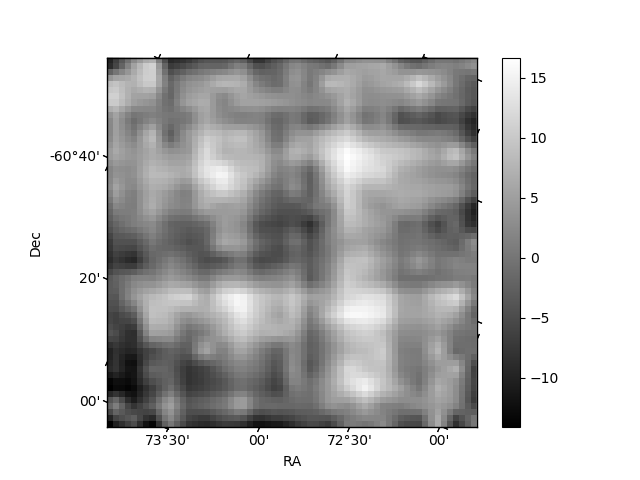
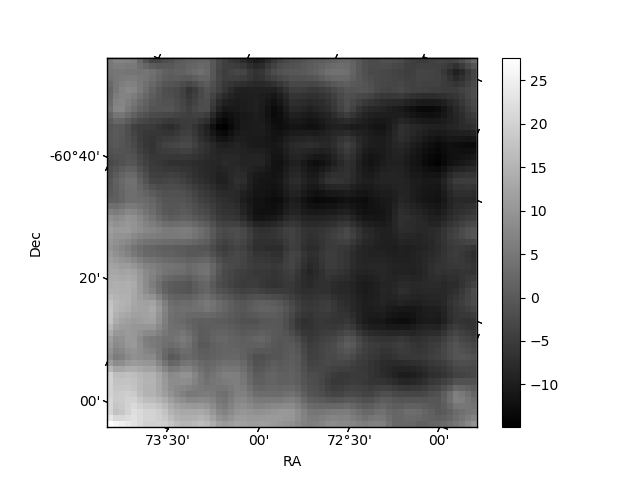
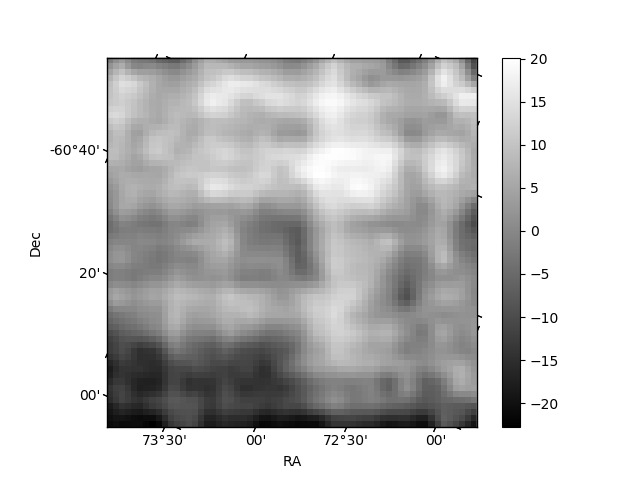
Histogram calculated using DETX and DETY for each event in the final _common_clean file
| Quadrant A | 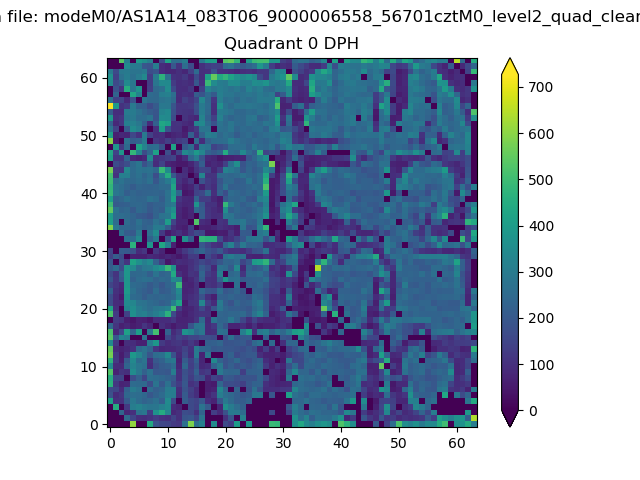 |
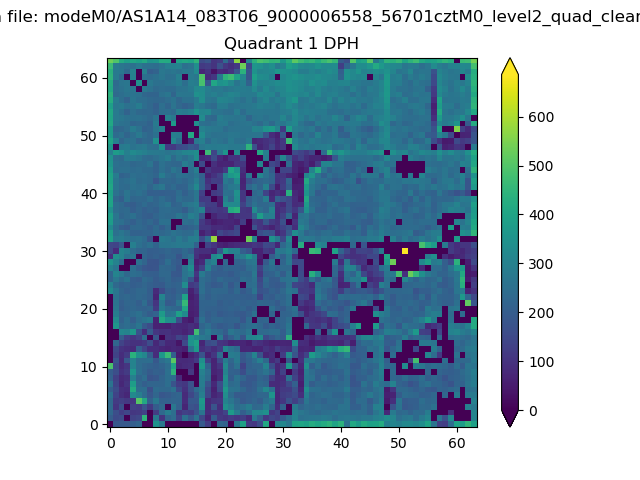 |
Quadrant B |
|---|---|---|---|
| Quadrant D | 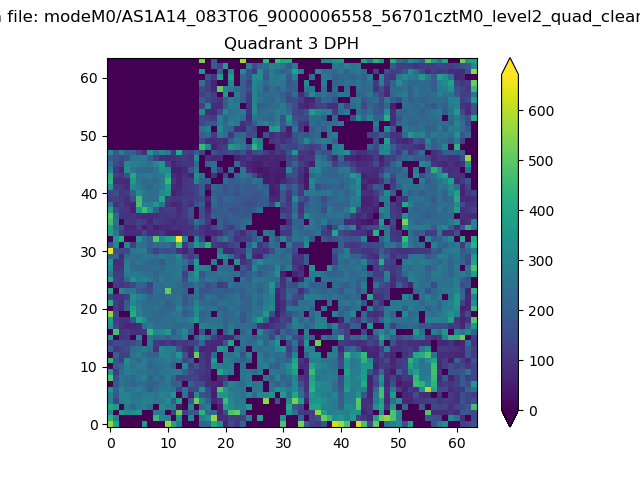 |
 |
Quadrant C |
| Plot type | Count rate plots | Images |
|---|---|---|
| Comparison with Poisson distribution Blue bars denote a histogram of data divided into 1 sec bins. Red curve is a Poisson curve with rate = median count rate of data. |
 |
 |
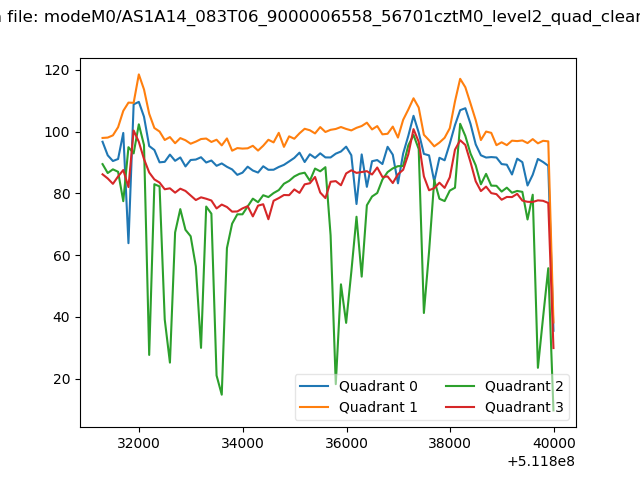
| Quadrant-wise count rates Data is divided into 100 sec bins |
 |
|
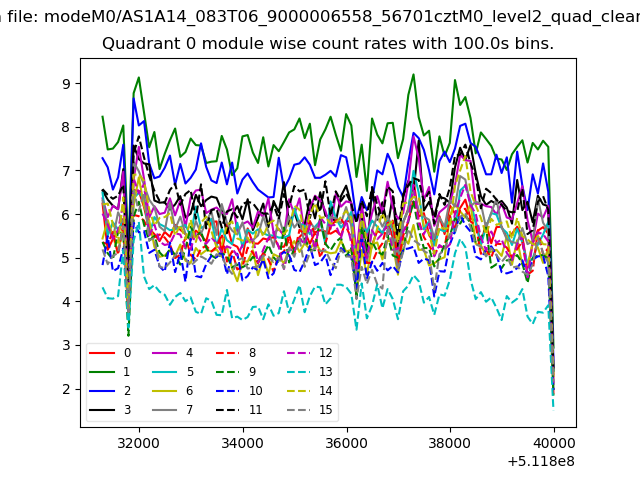
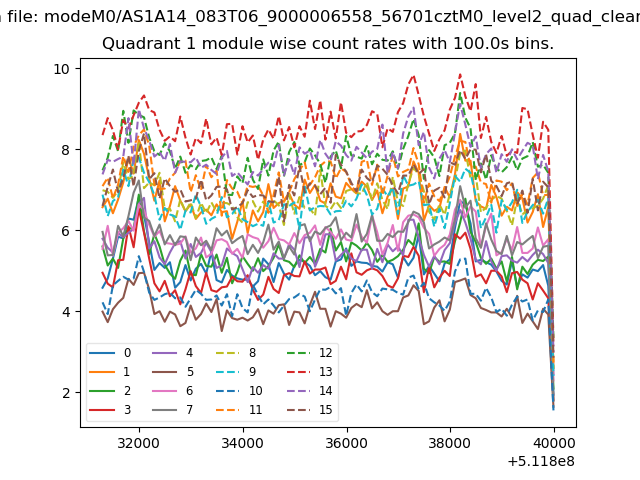
| Module-wise count rates for Quadrant A Data is divided into 100 sec bins |
 |
 |
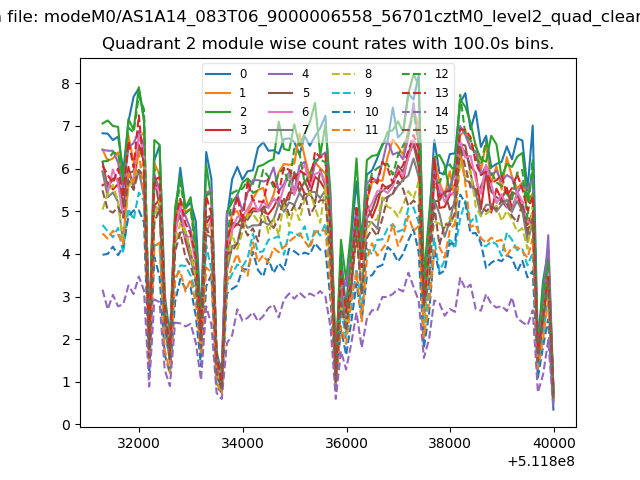
| Module-wise count rates for Quadrant B Data is divided into 100 sec bins |
 |
 |
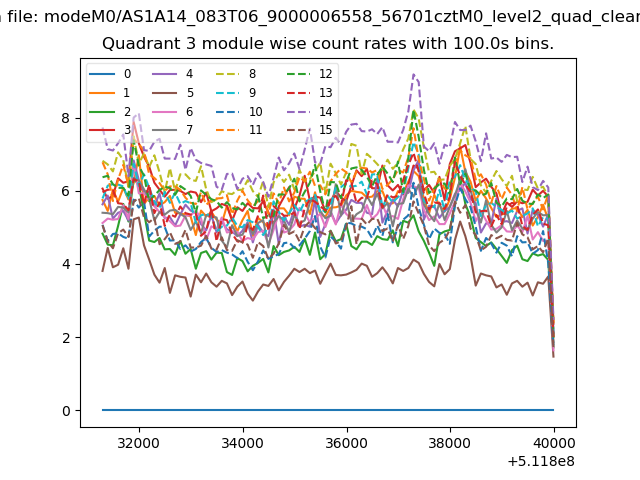
| Module-wise count rates for Quadrant C Data is divided into 100 sec bins |
 |
 |
| Module-wise count rates for Quadrant D Data is divided into 100 sec bins |
 |
 |
| Parameter | Plot |
|---|---|
| CZT HV Monitor | 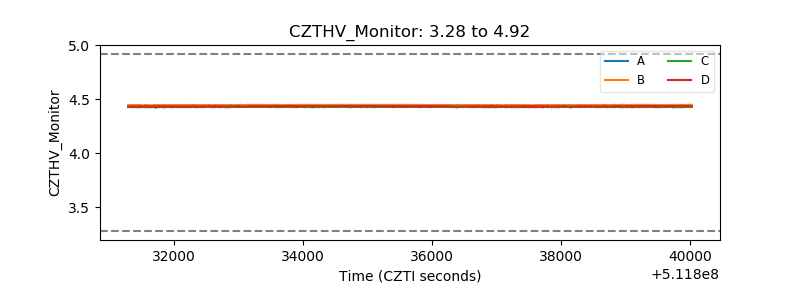 |
| D_VDD | 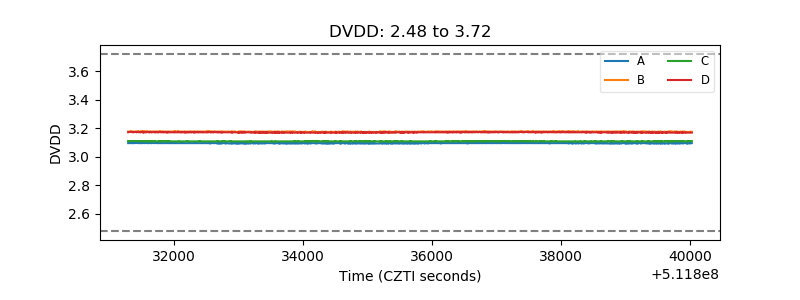 |
| Temperature 1 | 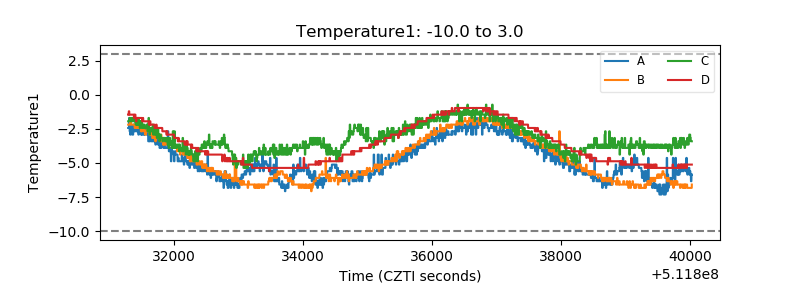 |
| Veto HV Monitor | 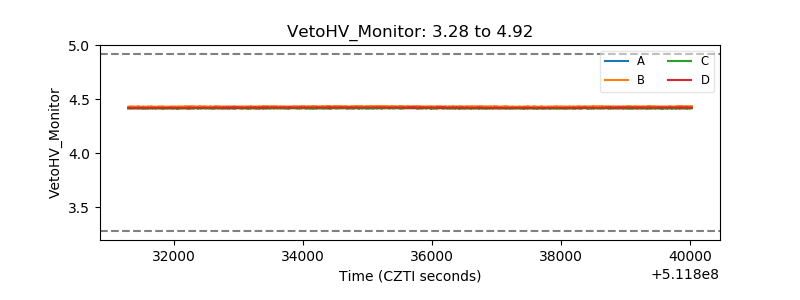 |
| Veto LLD | 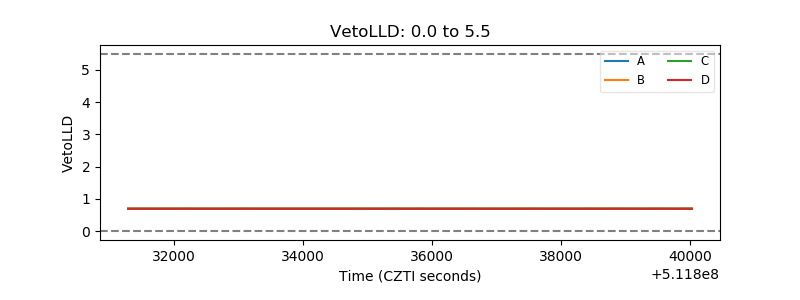 |
| Alpha Counter | 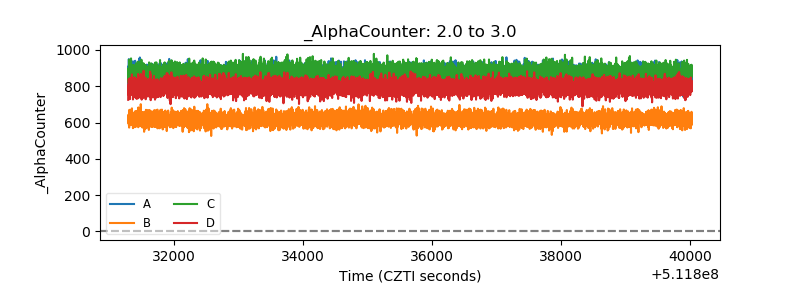 |
| _CPM_Rate | 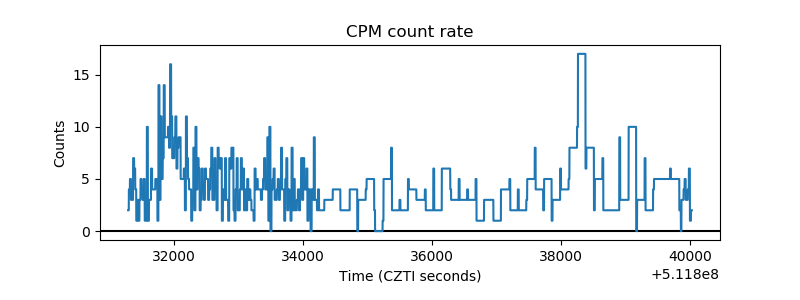 |
| CZT Counter | 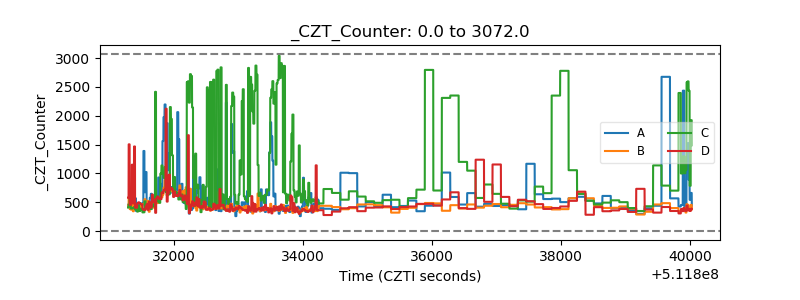 |
| +2.5 Volts monitor |  |
| +5 Volts monitor |  |
| _ROLL_ROT | 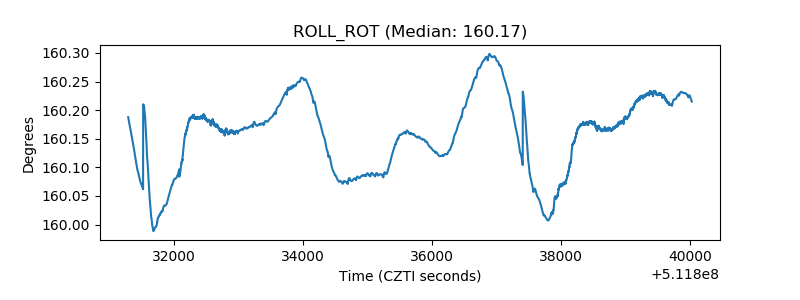 |
| _Roll_DEC | 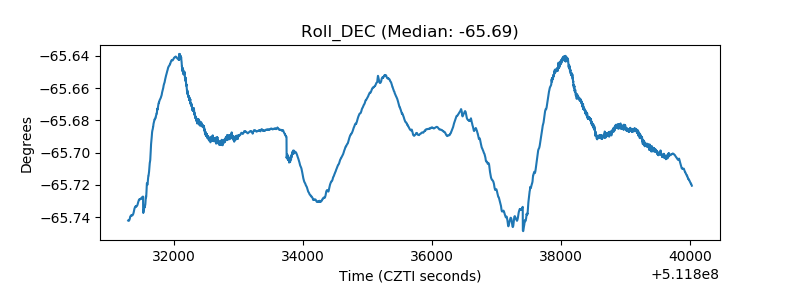 |
| _Roll_RA | 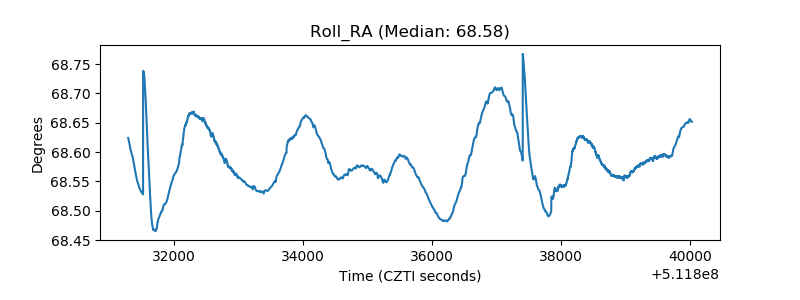 |
| Veto Counter | 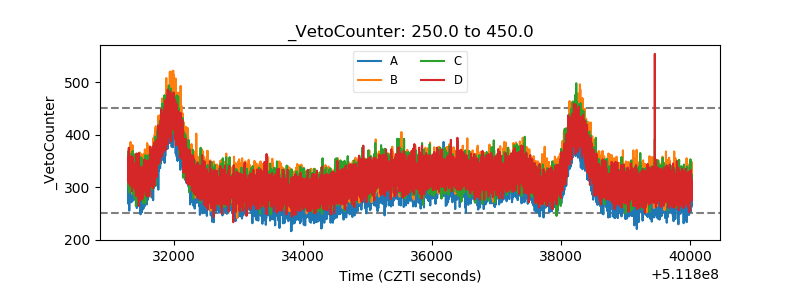 |