| Param | Original file | Final file |
|---|---|---|
| Filename | modeM0/AS1A14_083T06_9000006558_56704cztM0_level2.fits | modeM0/AS1A14_083T06_9000006558_56704cztM0_level2_quad_clean.evt |
| Size (bytes) | 1,425,211,200 | 250,940,160 |
| Size | 1.3 GB | 239.3 MB |
| Events in quadrant A | 13,812,554 | 1,649,907 |
| Events in quadrant B | 13,164,646 | 1,732,275 |
| Events in quadrant C | 14,678,955 | 1,454,384 |
| Events in quadrant D | 9,648,724 | 1,466,779 |
| Mode SS | |||
|---|---|---|---|
| Quadrant | BADHDUFLAG | Total packets | Discarded packets |
| A | 0 | 382 | 0 |
| B | 0 | 382 | 0 |
| C | 0 | 382 | 0 |
| D | 0 | 382 | 0 |
| Mode M9 | |||
|---|---|---|---|
| Quadrant | BADHDUFLAG | Total packets | Discarded packets |
| A | 0 | 7 | 0 |
| B | 0 | 7 | 0 |
| C | 0 | 7 | 0 |
| D | 0 | 7 | 0 |
| Mode M0 | |||
|---|---|---|---|
| Quadrant | BADHDUFLAG | Total packets | Discarded packets |
| A | 0 | 54321 | 2 |
| B | 0 | 52604 | 2 |
| C | 0 | 56703 | 2 |
| D | 0 | 42796 | 3 |
| Quadrant | Total seconds | Saturated seconds | Saturation percentage |
|---|---|---|---|
| A | 18766 | 1141 | 6.080145% |
| B | 18767 | 1455 | 7.752971% |
| C | 18767 | 2165 | 11.536207% |
| D | 18766 | 671 | 3.575615% |
Noise dominated data is calculated using 1-second bins in cleaned event files. If a bin has >2000 counts, and if more than 50% of those come from <1% of pixels, then it is considered to be noise-dominated and hence unusable.
| Quadrant | # 1 sec bins | Bins with >0 counts | Bins with >2000 counts | High rate bins dominated by noise | Noise dominated (total time) | Noise dominated (detector-on time) | Marked lightcurve |
|---|---|---|---|---|---|---|---|
| A | 19561 | 18767 | 683 | 683 | 3.49% | 3.64% | 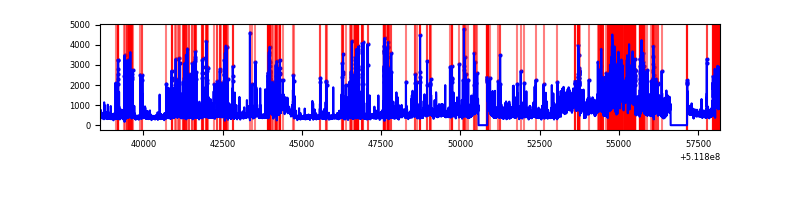 |
| B | 19562 | 18768 | 704 | 704 | 3.60% | 3.75% | 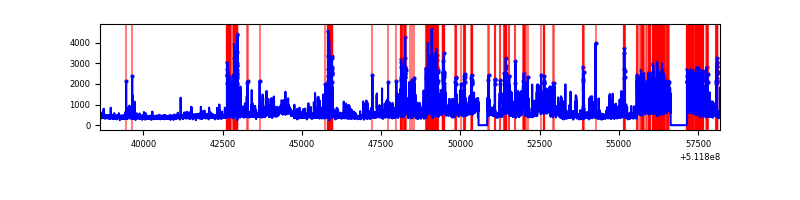 |
| C | 19562 | 18769 | 1507 | 1507 | 7.70% | 8.03% | 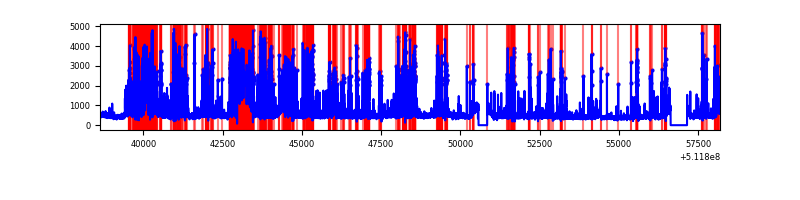 |
| D | 19561 | 18768 | 351 | 351 | 1.79% | 1.87% | 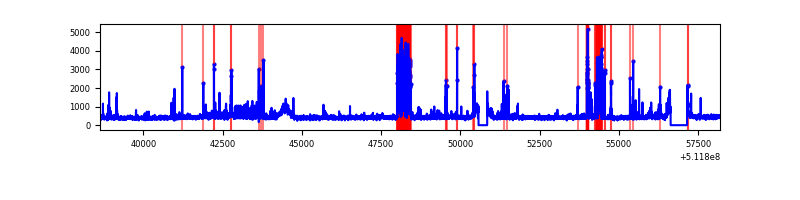 |
Top three noisy pixels from each quadrant. If the there are fewer than three noisy pixels in the level2.evt file, extra rows are filled as -1
| Pixel properties | Quadrant properties | ||||||
|---|---|---|---|---|---|---|---|
| Quadrant | DetID | PixID | Counts | Sigma | Mean | Median | Sigma |
| A | 3 | 14 | 3063158 | 6344.96 | 1970 | 1920 | 482.5 |
| A | 3 | 62 | 2028434 | 4200.31 | 1970 | 1920 | 482.5 |
| A | 6 | 179 | 479653 | 990.19 | 1970 | 1920 | 482.5 |
| B | 5 | 185 | 4437562 | 10714.24 | 1941 | 1868 | 414.0 |
| B | 5 | 172 | 349010 | 838.51 | 1941 | 1868 | 414.0 |
| B | 10 | 247 | 176224 | 421.15 | 1941 | 1868 | 414.0 |
| C | 13 | 3 | 3504198 | 6997.89 | 1854 | 1838 | 500.5 |
| C | 15 | 230 | 2572492 | 5136.29 | 1854 | 1838 | 500.5 |
| C | 15 | 164 | 536913 | 1069.11 | 1854 | 1838 | 500.5 |
| D | 2 | 249 | 1278646 | 2378.7 | 1924 | 1837 | 536.8 |
| D | 5 | 173 | 171422 | 315.94 | 1924 | 1837 | 536.8 |
| D | 2 | 236 | 137492 | 252.73 | 1924 | 1837 | 536.8 |
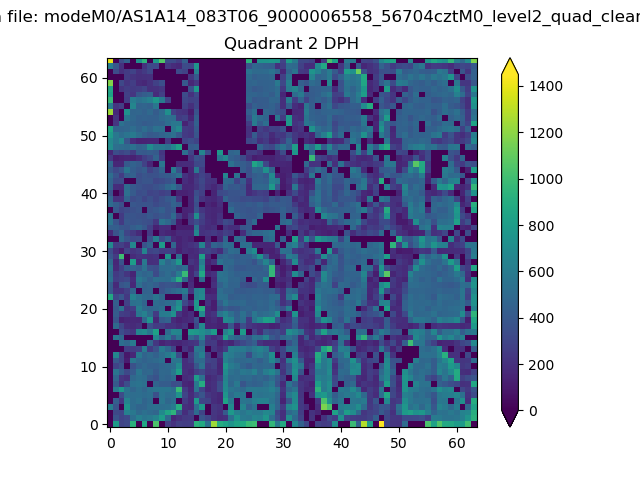
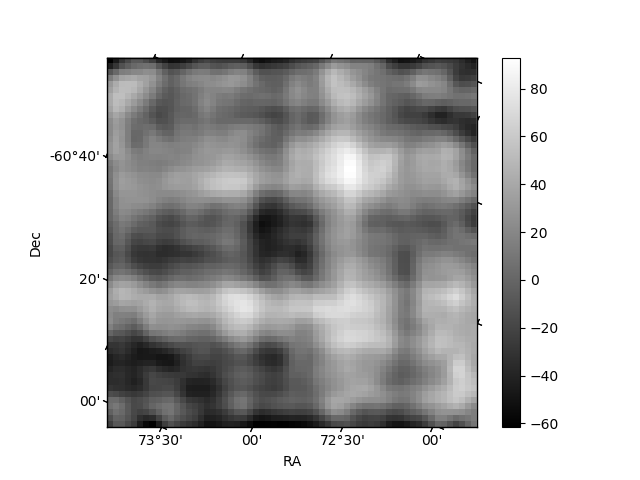
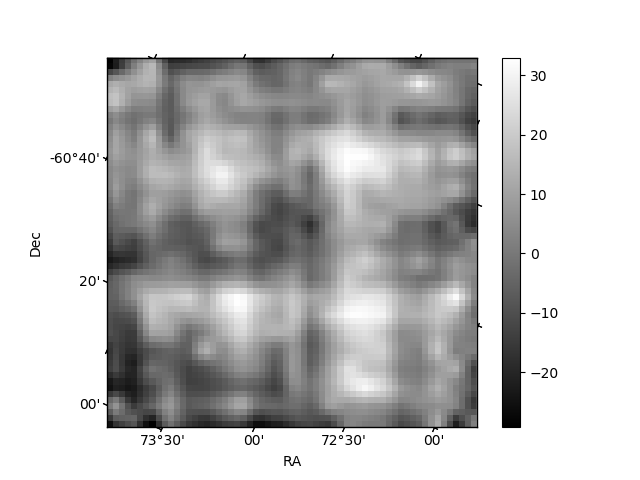
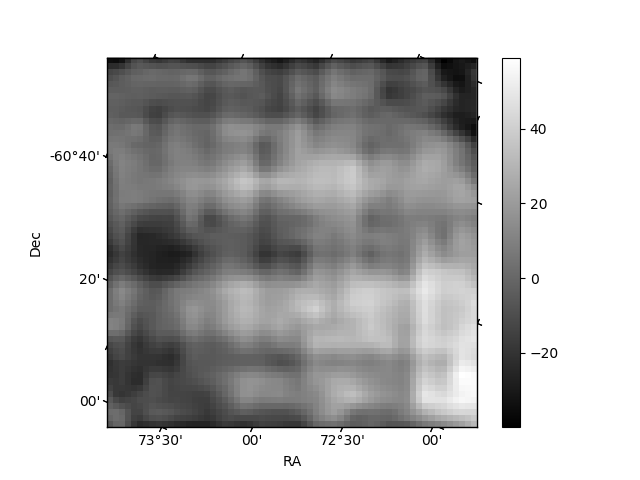
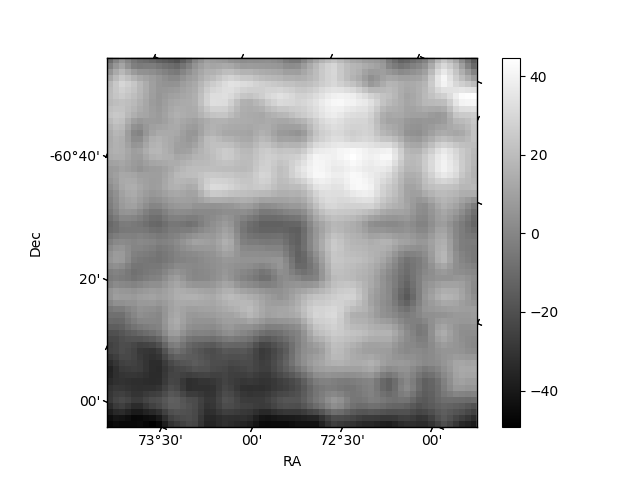
Histogram calculated using DETX and DETY for each event in the final _common_clean file
| Quadrant A | 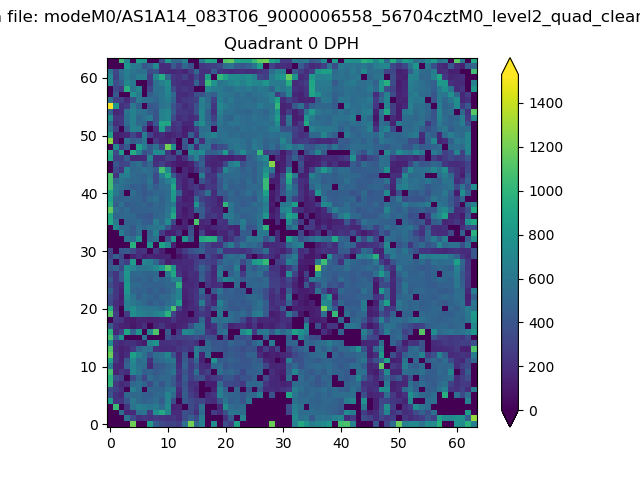 |
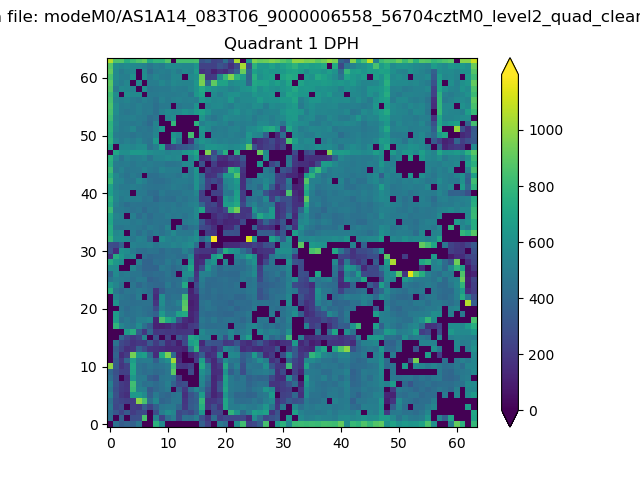 |
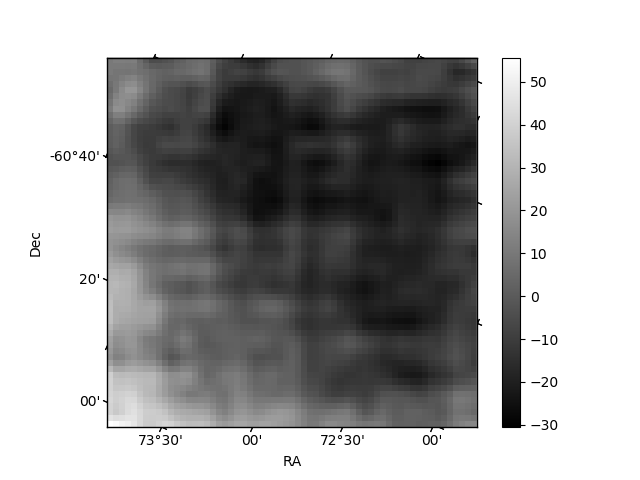
Quadrant B |
|---|---|---|---|
| Quadrant D | 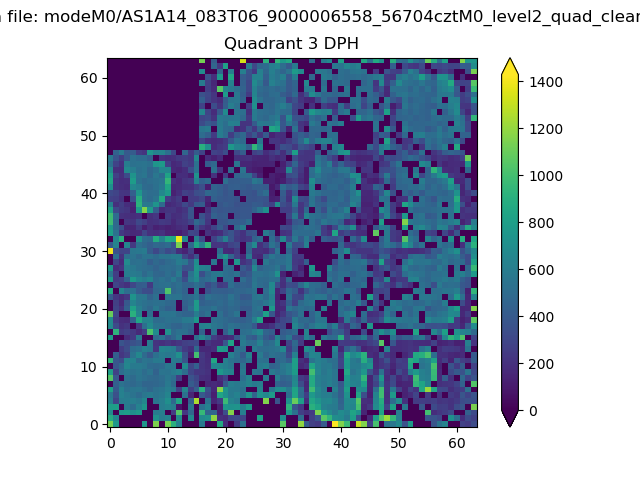 |
 |
Quadrant C |
| Plot type | Count rate plots | Images |
|---|---|---|
| Comparison with Poisson distribution Blue bars denote a histogram of data divided into 1 sec bins. Red curve is a Poisson curve with rate = median count rate of data. |
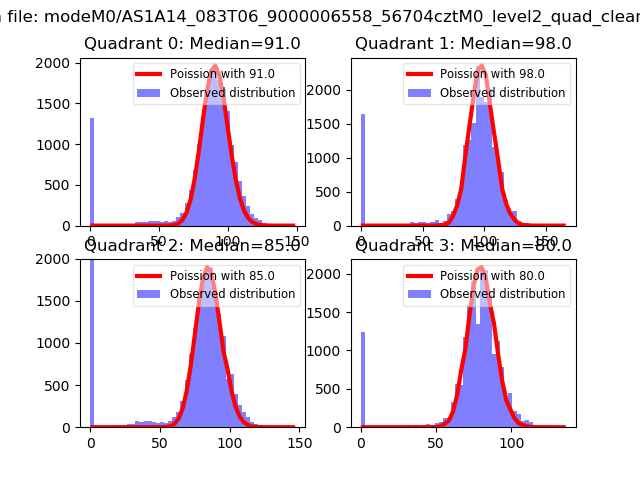 |
 |
| Quadrant-wise count rates Data is divided into 100 sec bins |
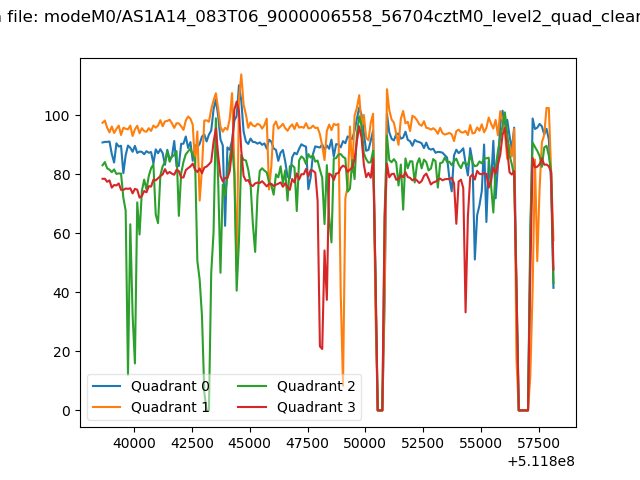 |
|
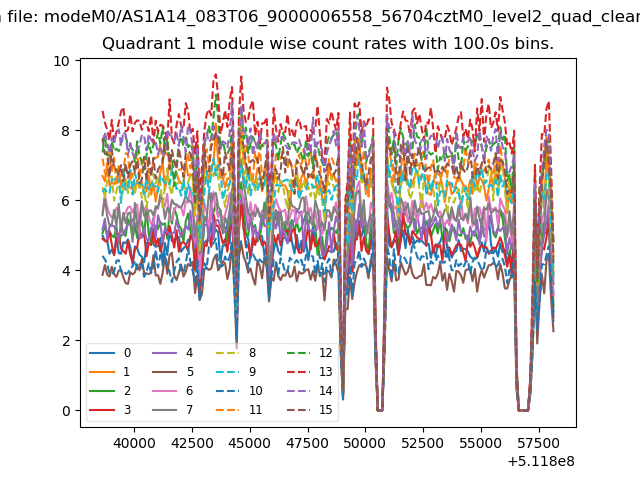
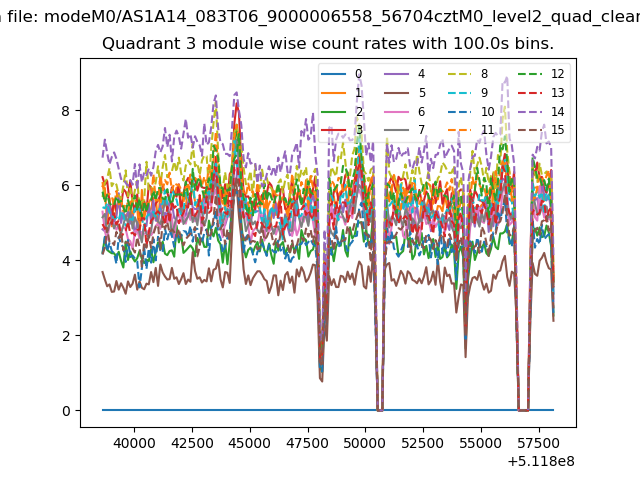
| Module-wise count rates for Quadrant A Data is divided into 100 sec bins |
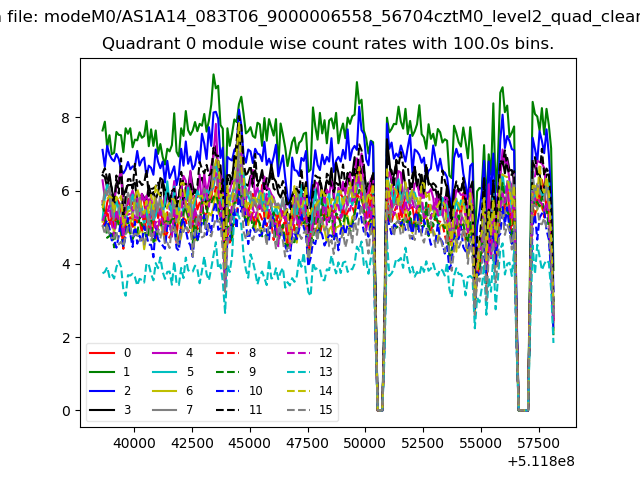 |
 |
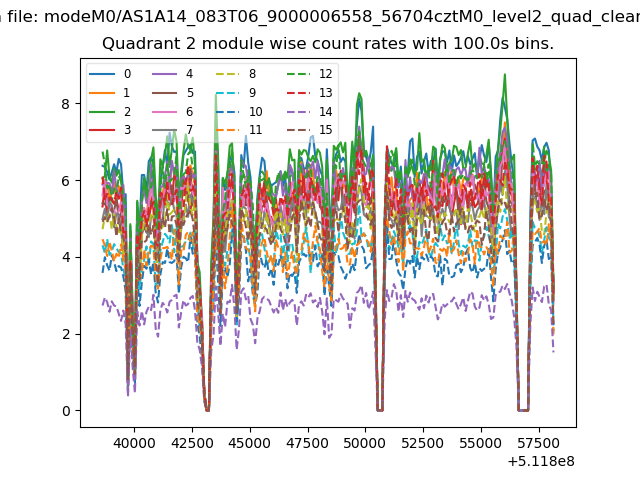
| Module-wise count rates for Quadrant B Data is divided into 100 sec bins |
 |
 |
| Module-wise count rates for Quadrant C Data is divided into 100 sec bins |
 |
 |
| Module-wise count rates for Quadrant D Data is divided into 100 sec bins |
 |
 |
| Parameter | Plot |
|---|---|
| CZT HV Monitor | 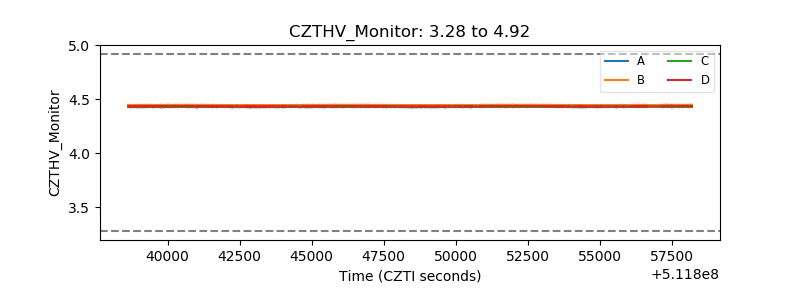 |
| D_VDD | 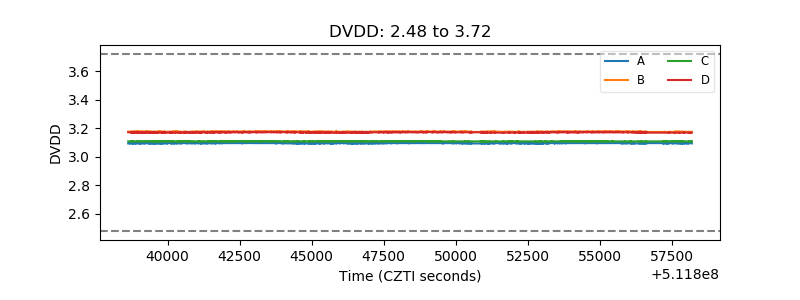 |
| Temperature 1 | 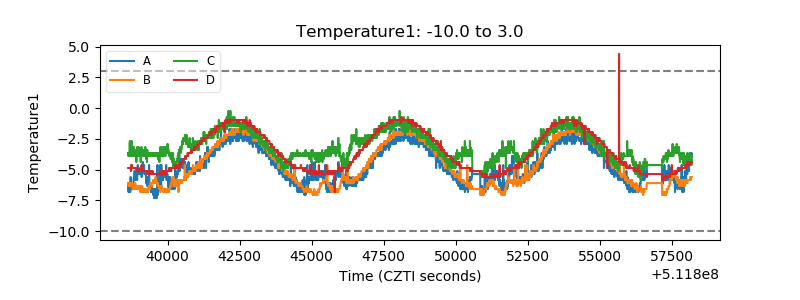 |
| Veto HV Monitor | 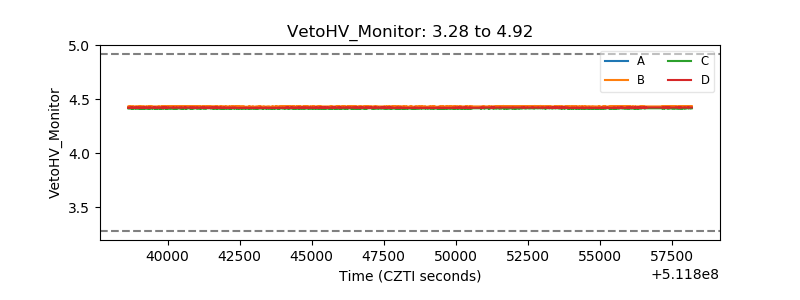 |
| Veto LLD | 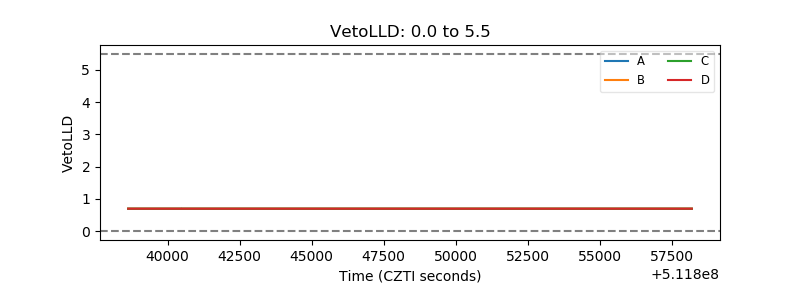 |
| Alpha Counter | 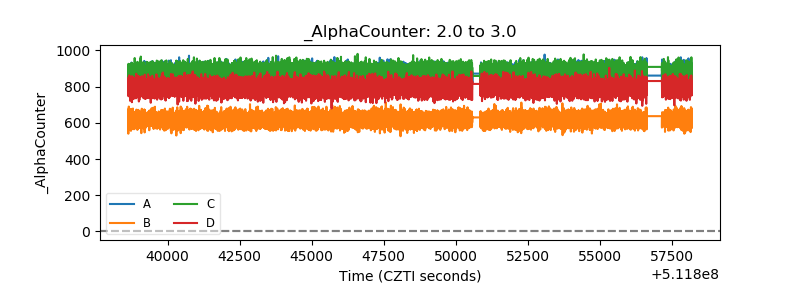 |
| _CPM_Rate | 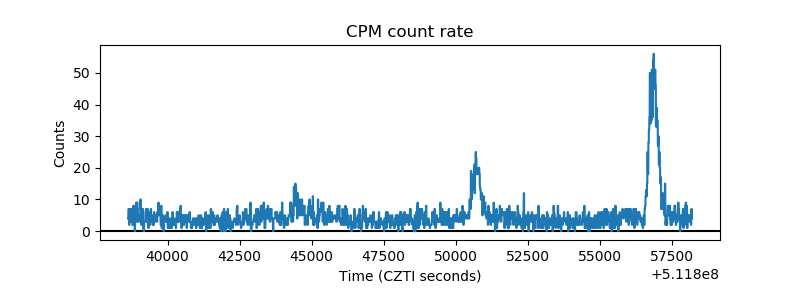 |
| CZT Counter | 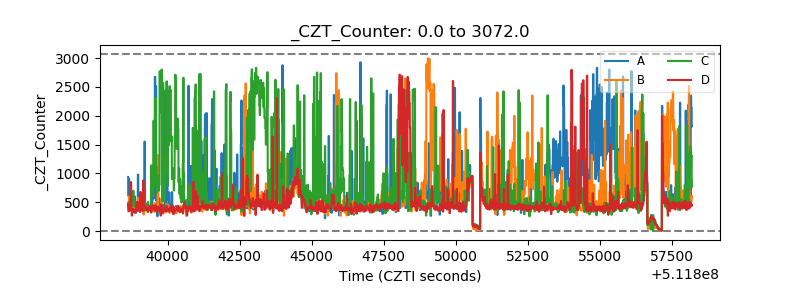 |
| +2.5 Volts monitor |  |
| +5 Volts monitor |  |
| _ROLL_ROT | 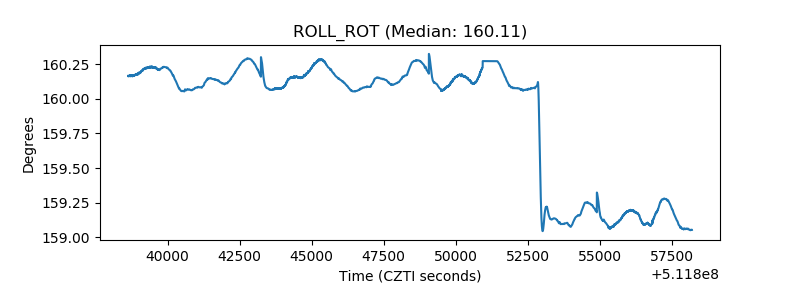 |
| _Roll_DEC | 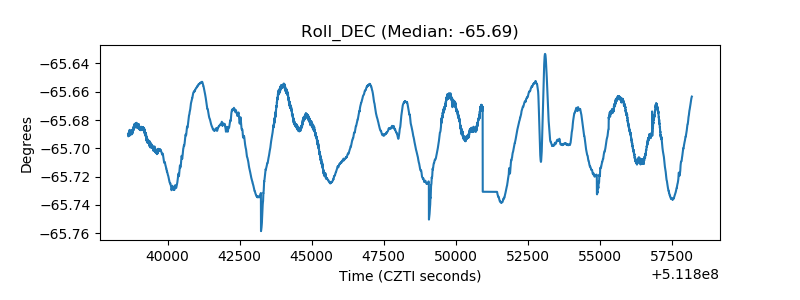 |
| _Roll_RA | 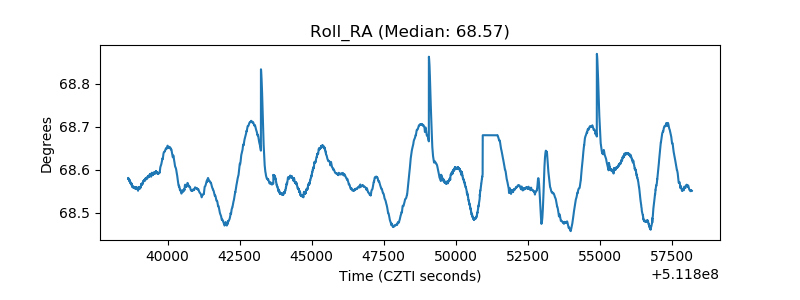 |
| Veto Counter | 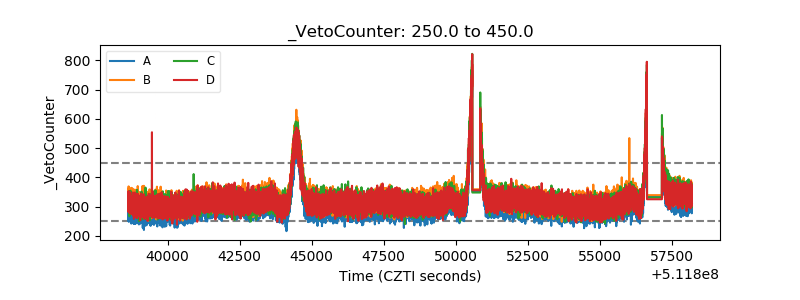 |