| Param | Original file | Final file |
|---|---|---|
| Filename | modeM0/AS1A14_083T06_9000006558_56706cztM0_level2.fits | modeM0/AS1A14_083T06_9000006558_56706cztM0_level2_quad_clean.evt |
| Size (bytes) | 514,463,040 | 90,653,760 |
| Size | 490.6 MB | 86.5 MB |
| Events in quadrant A | 4,088,936 | 609,417 |
| Events in quadrant B | 6,748,376 | 585,092 |
| Events in quadrant C | 4,409,124 | 544,294 |
| Events in quadrant D | 3,298,151 | 557,437 |
| Mode SS | |||
|---|---|---|---|
| Quadrant | BADHDUFLAG | Total packets | Discarded packets |
| A | 0 | 132 | 0 |
| B | 0 | 132 | 0 |
| C | 0 | 132 | 0 |
| D | 0 | 132 | 0 |
| Mode M9 | |||
|---|---|---|---|
| Quadrant | BADHDUFLAG | Total packets | Discarded packets |
| A | 0 | 8 | 0 |
| B | 0 | 8 | 0 |
| C | 0 | 8 | 0 |
| D | 0 | 8 | 0 |
| Mode M0 | |||
|---|---|---|---|
| Quadrant | BADHDUFLAG | Total packets | Discarded packets |
| A | 0 | 16426 | 1 |
| B | 0 | 24467 | 1 |
| C | 0 | 17803 | 1 |
| D | 0 | 14285 | 1 |
| Quadrant | Total seconds | Saturated seconds | Saturation percentage |
|---|---|---|---|
| A | 6425 | 241 | 3.750973% |
| B | 6425 | 988 | 15.377432% |
| C | 6425 | 621 | 9.665370% |
| D | 6426 | 121 | 1.882975% |
Noise dominated data is calculated using 1-second bins in cleaned event files. If a bin has >2000 counts, and if more than 50% of those come from <1% of pixels, then it is considered to be noise-dominated and hence unusable.
| Quadrant | # 1 sec bins | Bins with >0 counts | Bins with >2000 counts | High rate bins dominated by noise | Noise dominated (total time) | Noise dominated (detector-on time) | Marked lightcurve |
|---|---|---|---|---|---|---|---|
| A | 7275 | 6425 | 156 | 156 | 2.14% | 2.43% | 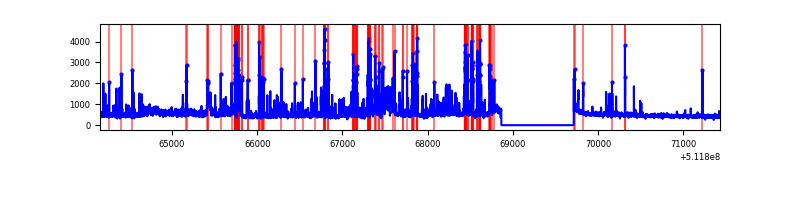 |
| B | 7275 | 6425 | 737 | 737 | 10.13% | 11.47% | 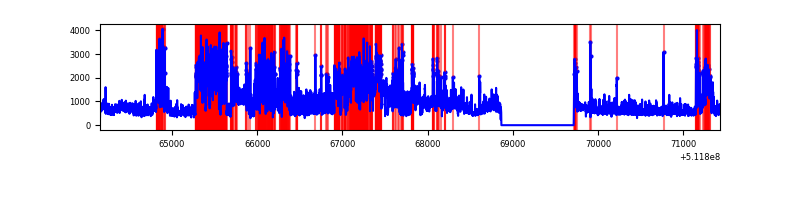 |
| C | 7275 | 6425 | 499 | 499 | 6.86% | 7.77% | 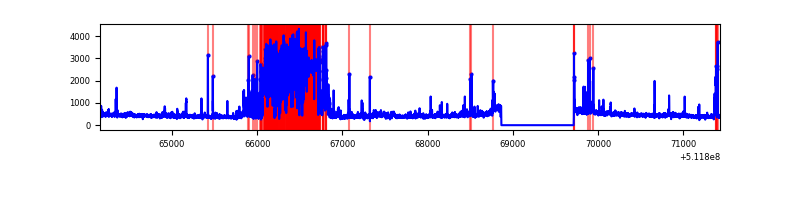 |
| D | 7276 | 6427 | 63 | 63 | 0.87% | 0.98% | 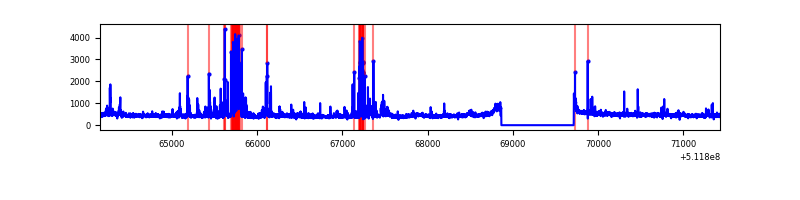 |
Top three noisy pixels from each quadrant. If the there are fewer than three noisy pixels in the level2.evt file, extra rows are filled as -1
| Pixel properties | Quadrant properties | ||||||
|---|---|---|---|---|---|---|---|
| Quadrant | DetID | PixID | Counts | Sigma | Mean | Median | Sigma |
| A | 3 | 14 | 631488 | 3670.4 | 687 | 670 | 171.9 |
| A | 3 | 62 | 571291 | 3320.14 | 687 | 670 | 171.9 |
| A | 8 | 26 | 108042 | 624.74 | 687 | 670 | 171.9 |
| B | 5 | 185 | 3710857 | 26286.39 | 655 | 633 | 141.1 |
| B | 0 | 63 | 87200 | 613.31 | 655 | 633 | 141.1 |
| B | 4 | 236 | 62092 | 435.43 | 655 | 633 | 141.1 |
| C | 15 | 230 | 1558779 | 8862.63 | 643 | 635 | 175.8 |
| C | 13 | 3 | 99596 | 562.88 | 643 | 635 | 175.8 |
| C | 14 | 96 | 35588 | 198.81 | 643 | 635 | 175.8 |
| D | 2 | 249 | 243121 | 1267.3 | 672 | 641 | 191.3 |
| D | 6 | 239 | 174297 | 907.59 | 672 | 641 | 191.3 |
| D | 5 | 173 | 61994 | 320.65 | 672 | 641 | 191.3 |
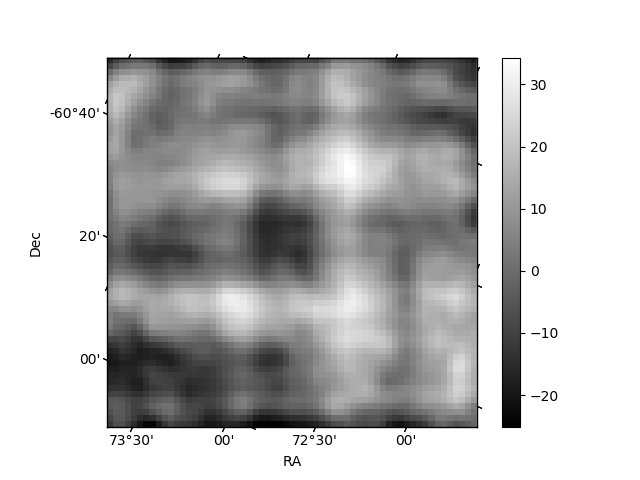
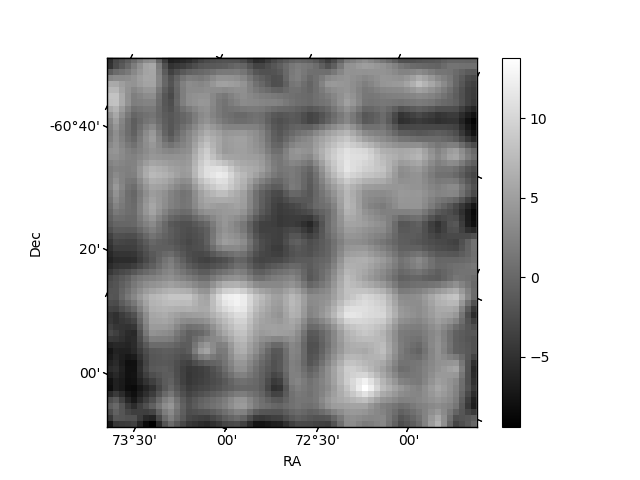
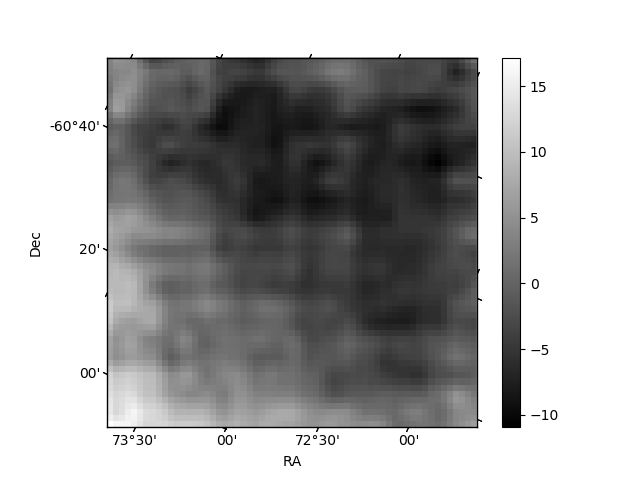
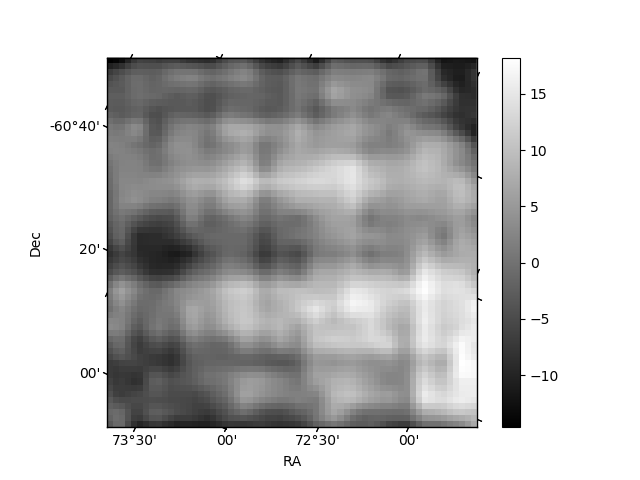
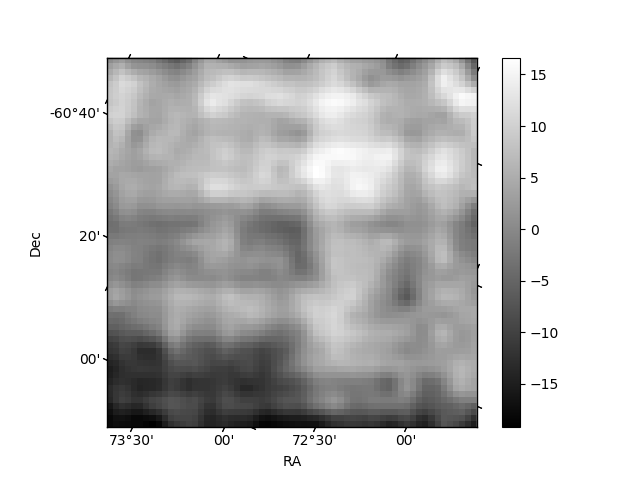
Histogram calculated using DETX and DETY for each event in the final _common_clean file
| Quadrant A | 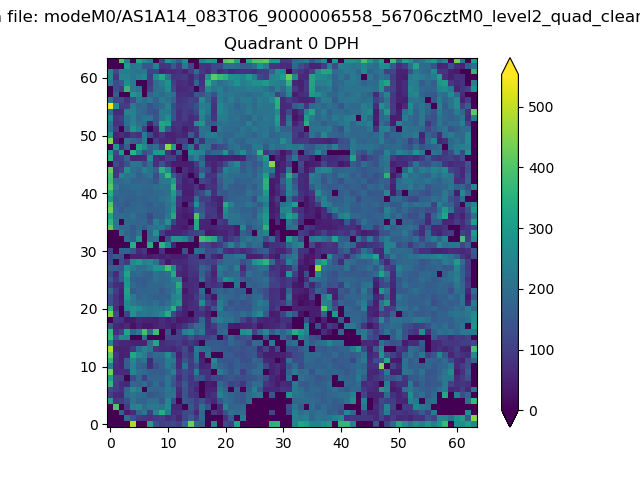 |
 |
Quadrant B |
|---|---|---|---|
| Quadrant D | 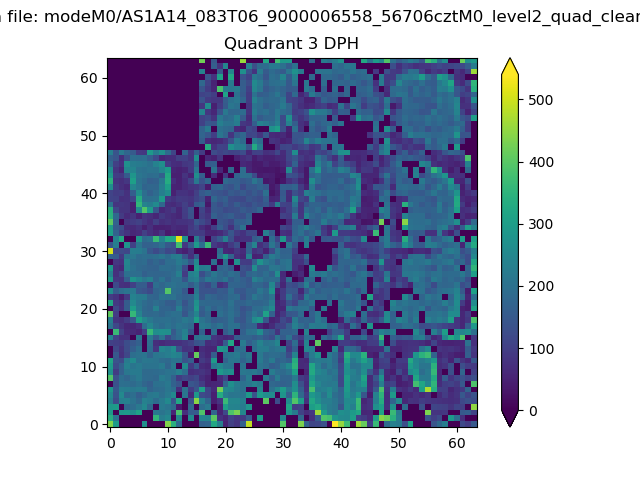 |
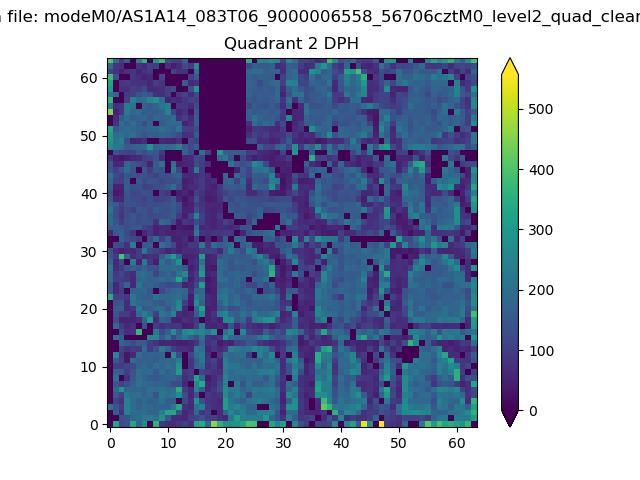 |
Quadrant C |
| Plot type | Count rate plots | Images |
|---|---|---|
| Comparison with Poisson distribution Blue bars denote a histogram of data divided into 1 sec bins. Red curve is a Poisson curve with rate = median count rate of data. |
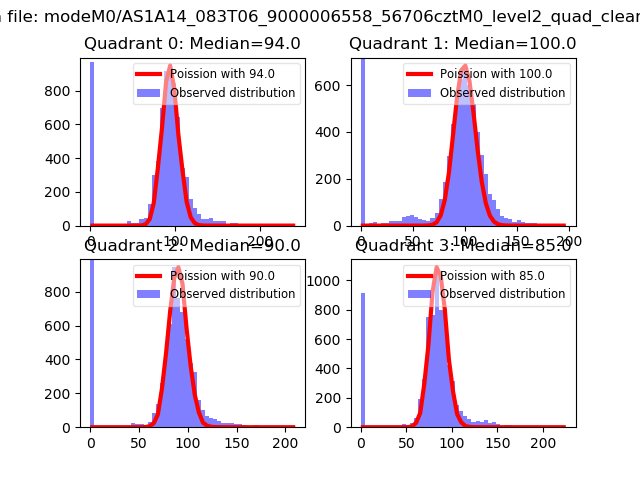 |
 |
| Quadrant-wise count rates Data is divided into 100 sec bins |
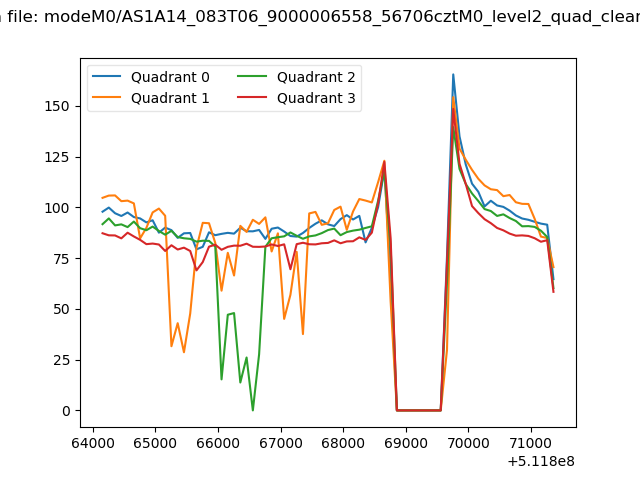 |
|
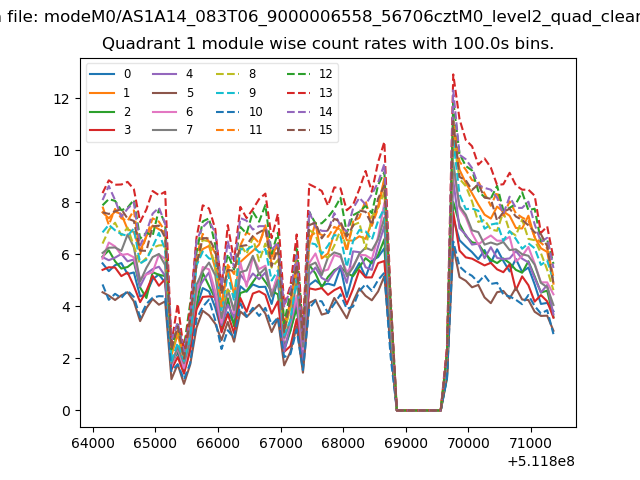
| Module-wise count rates for Quadrant A Data is divided into 100 sec bins |
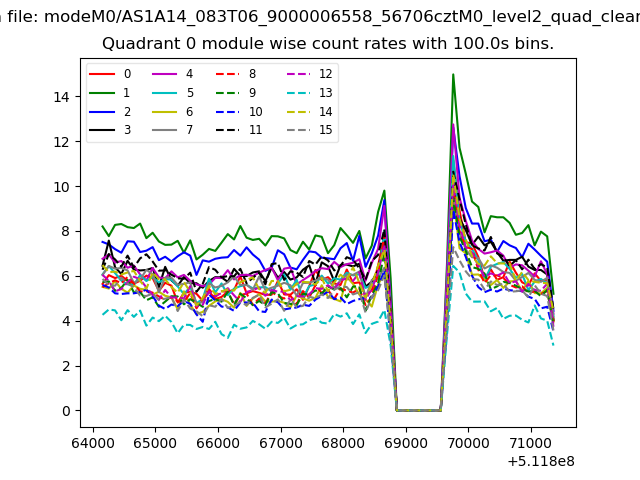 |
 |
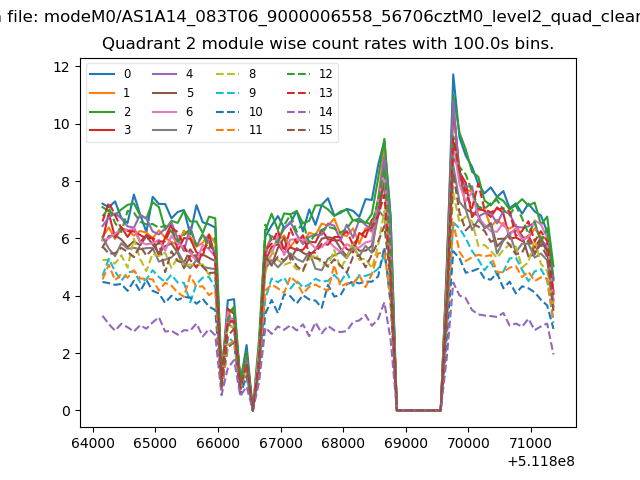
| Module-wise count rates for Quadrant B Data is divided into 100 sec bins |
 |
 |
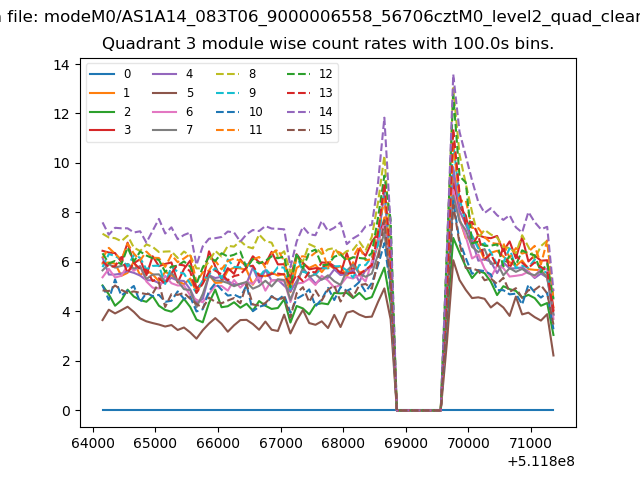
| Module-wise count rates for Quadrant C Data is divided into 100 sec bins |
 |
 |
| Module-wise count rates for Quadrant D Data is divided into 100 sec bins |
 |
 |
| Parameter | Plot |
|---|---|
| CZT HV Monitor | 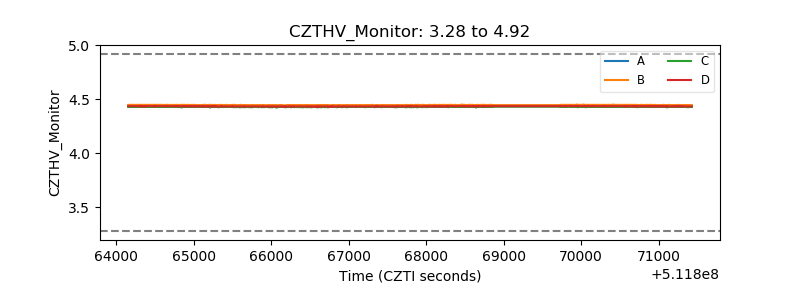 |
| D_VDD | 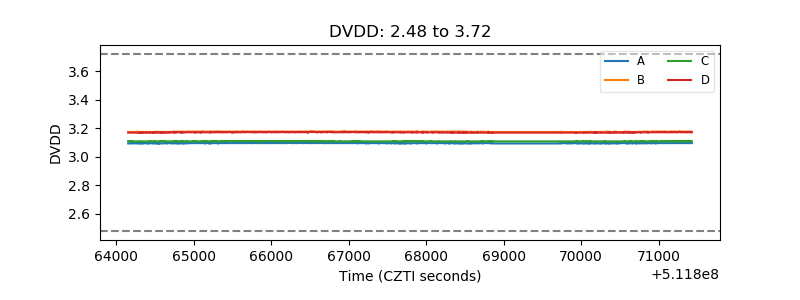 |
| Temperature 1 | 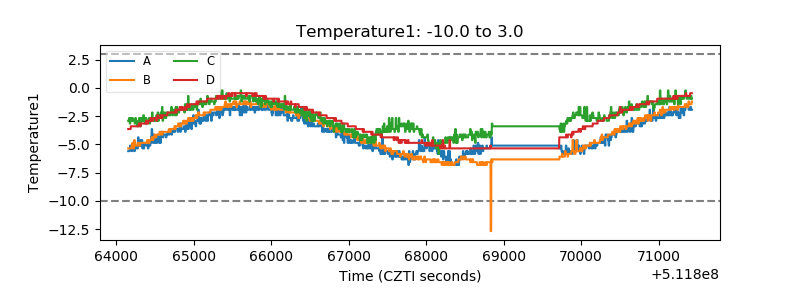 |
| Veto HV Monitor | 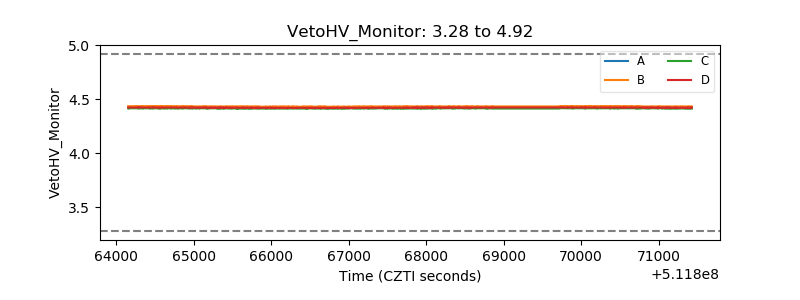 |
| Veto LLD | 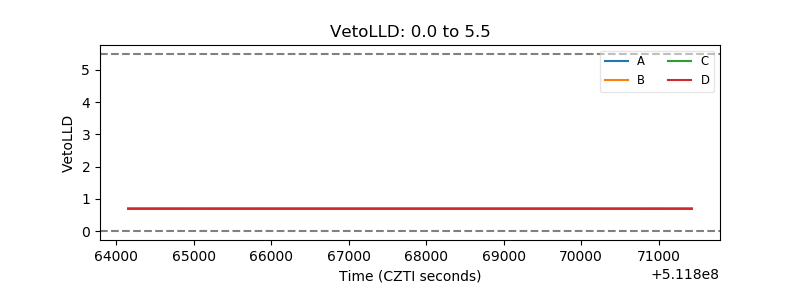 |
| Alpha Counter | 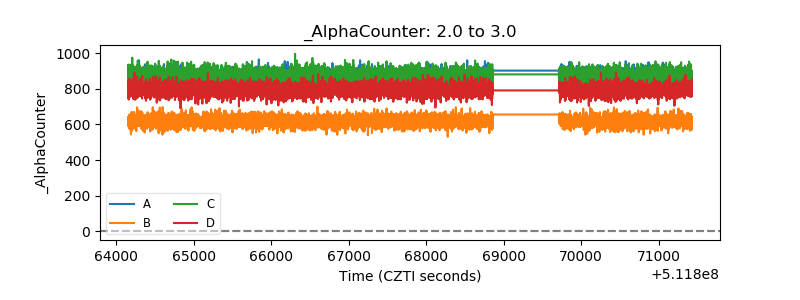 |
| _CPM_Rate | 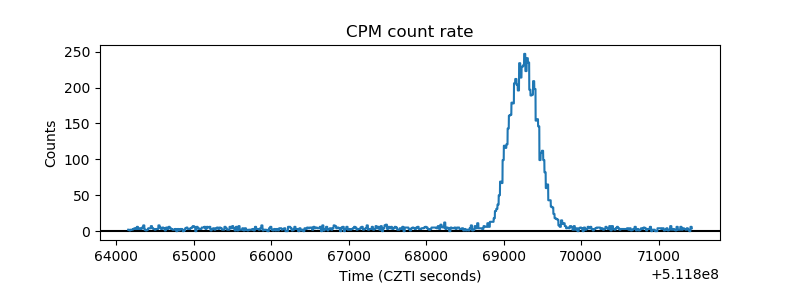 |
| CZT Counter | 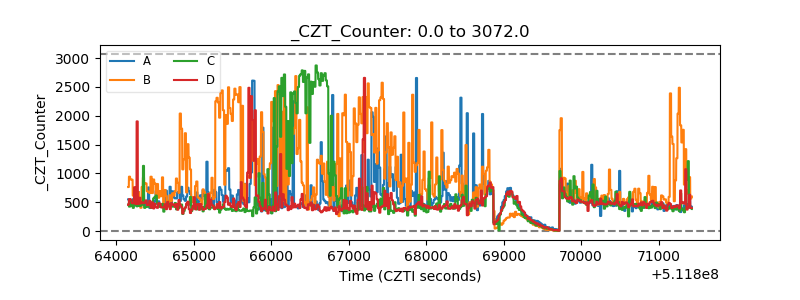 |
| +2.5 Volts monitor |  |
| +5 Volts monitor |  |
| _ROLL_ROT | 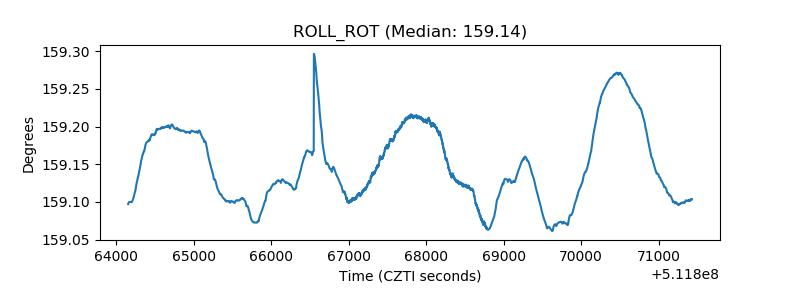 |
| _Roll_DEC | 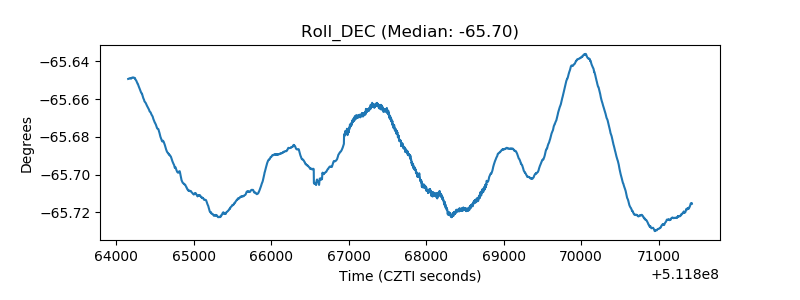 |
| _Roll_RA | 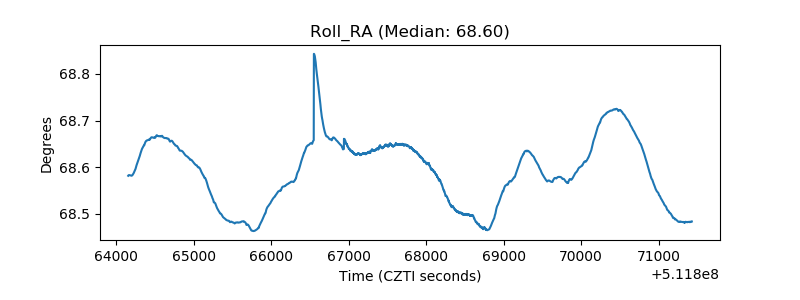 |
| Veto Counter | 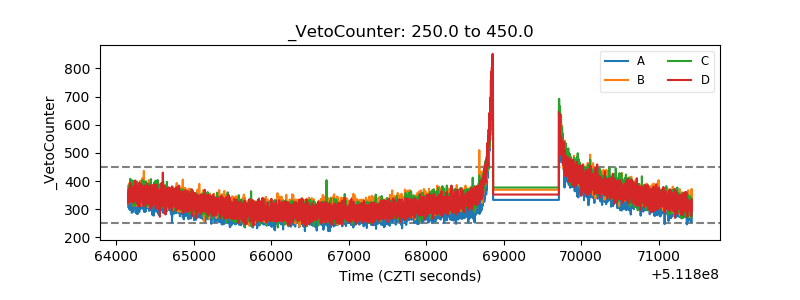 |