| Param | Original file | Final file |
|---|---|---|
| Filename | modeM0/AS1A14_083T06_9000006558_56708cztM0_level2.fits | modeM0/AS1A14_083T06_9000006558_56708cztM0_level2_quad_clean.evt |
| Size (bytes) | 592,804,800 | 92,629,440 |
| Size | 565.3 MB | 88.3 MB |
| Events in quadrant A | 4,984,977 | 607,036 |
| Events in quadrant B | 7,848,640 | 580,673 |
| Events in quadrant C | 5,192,250 | 558,168 |
| Events in quadrant D | 3,408,259 | 600,685 |
| Mode SS | |||
|---|---|---|---|
| Quadrant | BADHDUFLAG | Total packets | Discarded packets |
| A | 0 | 134 | 0 |
| B | 0 | 134 | 0 |
| C | 0 | 134 | 0 |
| D | 0 | 134 | 0 |
| Mode M9 | |||
|---|---|---|---|
| Quadrant | BADHDUFLAG | Total packets | Discarded packets |
| A | 0 | 9 | 0 |
| B | 0 | 9 | 0 |
| C | 0 | 9 | 0 |
| D | 0 | 9 | 0 |
| Mode M0 | |||
|---|---|---|---|
| Quadrant | BADHDUFLAG | Total packets | Discarded packets |
| A | 0 | 19349 | 1 |
| B | 0 | 27774 | 1 |
| C | 0 | 20007 | 1 |
| D | 0 | 14769 | 1 |
| Quadrant | Total seconds | Saturated seconds | Saturation percentage |
|---|---|---|---|
| A | 6564 | 626 | 9.536868% |
| B | 6564 | 1430 | 21.785497% |
| C | 6565 | 756 | 11.515613% |
| D | 6565 | 126 | 1.919269% |
Noise dominated data is calculated using 1-second bins in cleaned event files. If a bin has >2000 counts, and if more than 50% of those come from <1% of pixels, then it is considered to be noise-dominated and hence unusable.
| Quadrant | # 1 sec bins | Bins with >0 counts | Bins with >2000 counts | High rate bins dominated by noise | Noise dominated (total time) | Noise dominated (detector-on time) | Marked lightcurve |
|---|---|---|---|---|---|---|---|
| A | 7514 | 6564 | 450 | 450 | 5.99% | 6.86% | 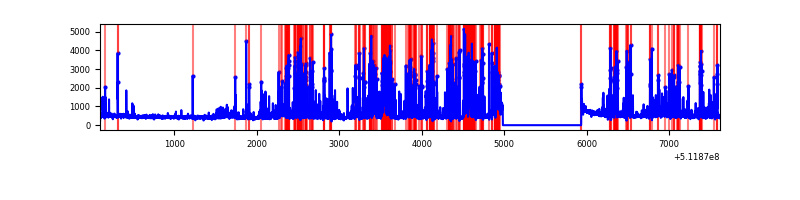 |
| B | 7514 | 6565 | 1136 | 1136 | 15.12% | 17.30% | 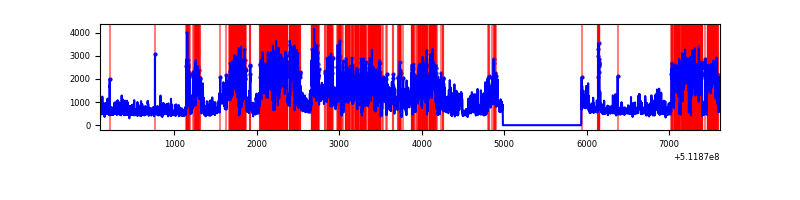 |
| C | 7515 | 6566 | 599 | 599 | 7.97% | 9.12% | 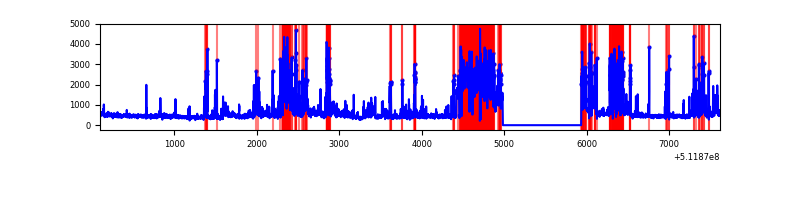 |
| D | 7515 | 6565 | 57 | 57 | 0.76% | 0.87% | 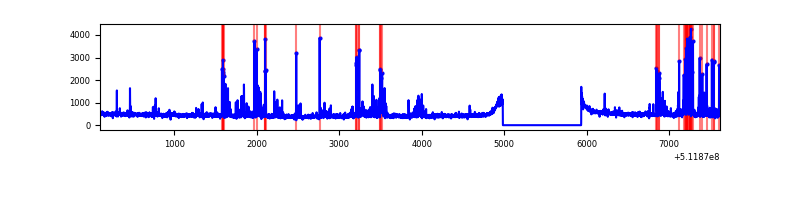 |
Top three noisy pixels from each quadrant. If the there are fewer than three noisy pixels in the level2.evt file, extra rows are filled as -1
| Pixel properties | Quadrant properties | ||||||
|---|---|---|---|---|---|---|---|
| Quadrant | DetID | PixID | Counts | Sigma | Mean | Median | Sigma |
| A | 3 | 62 | 1987188 | 11382.73 | 691 | 673 | 174.5 |
| A | 10 | 251 | 101487 | 577.66 | 691 | 673 | 174.5 |
| A | 4 | 95 | 58933 | 333.83 | 691 | 673 | 174.5 |
| B | 5 | 185 | 4810010 | 33164.75 | 676 | 652 | 145.0 |
| B | 0 | 63 | 133759 | 917.89 | 676 | 652 | 145.0 |
| B | 10 | 247 | 56230 | 383.26 | 676 | 652 | 145.0 |
| C | 13 | 3 | 1526546 | 8445.48 | 647 | 640 | 180.7 |
| C | 9 | 38 | 491196 | 2715.1 | 647 | 640 | 180.7 |
| C | 15 | 230 | 378187 | 2089.62 | 647 | 640 | 180.7 |
| D | 2 | 249 | 300514 | 1490.03 | 704 | 672 | 201.2 |
| D | 6 | 239 | 110509 | 545.82 | 704 | 672 | 201.2 |
| D | 5 | 173 | 55470 | 272.31 | 704 | 672 | 201.2 |
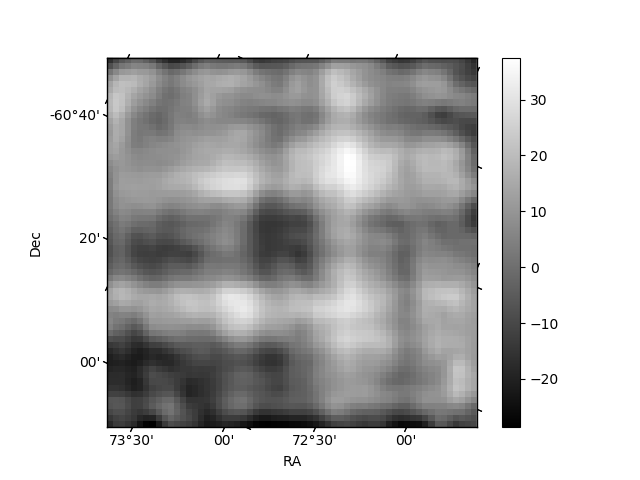
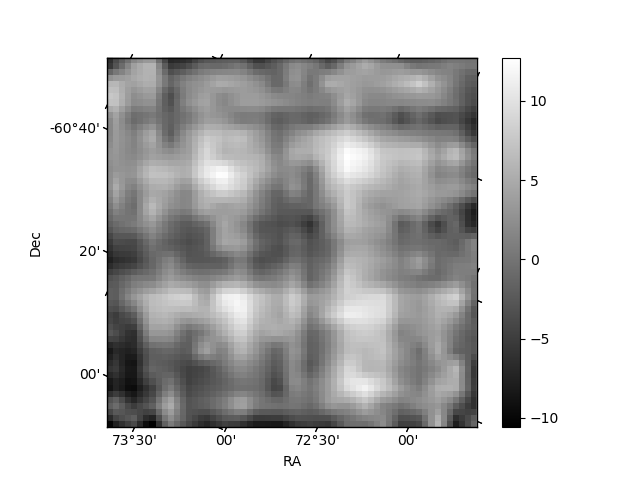
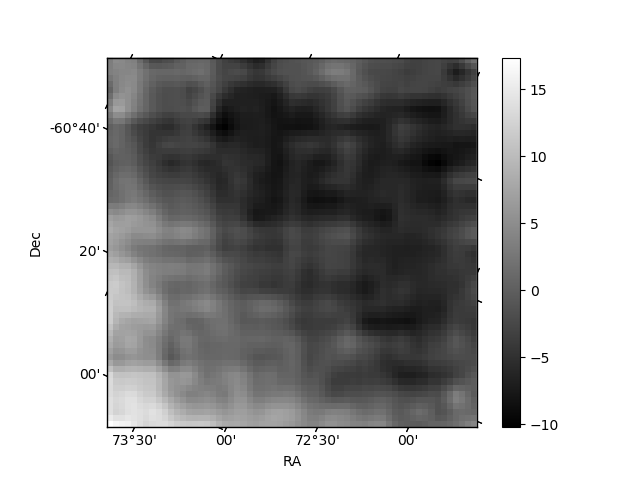
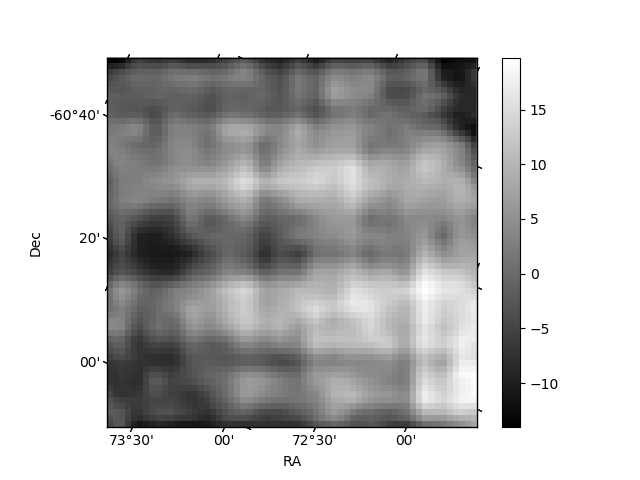
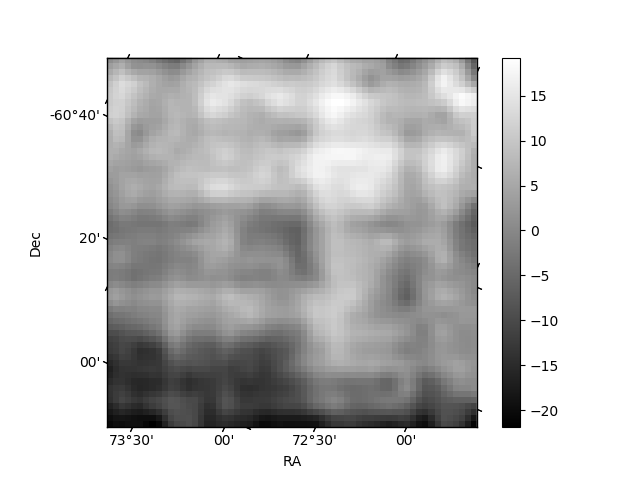
Histogram calculated using DETX and DETY for each event in the final _common_clean file
| Quadrant A | 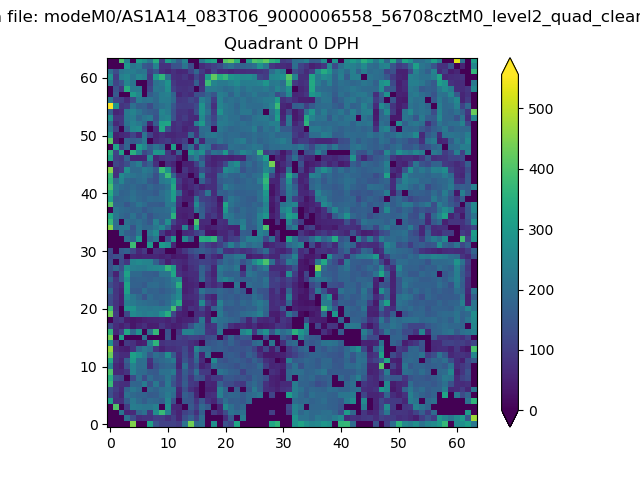 |
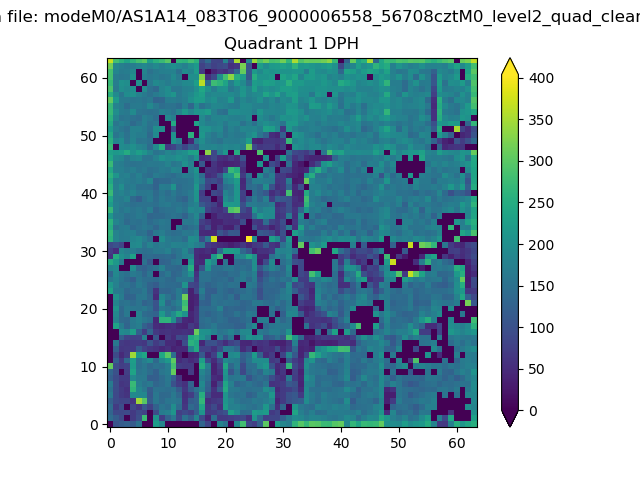 |
Quadrant B |
|---|---|---|---|
| Quadrant D | 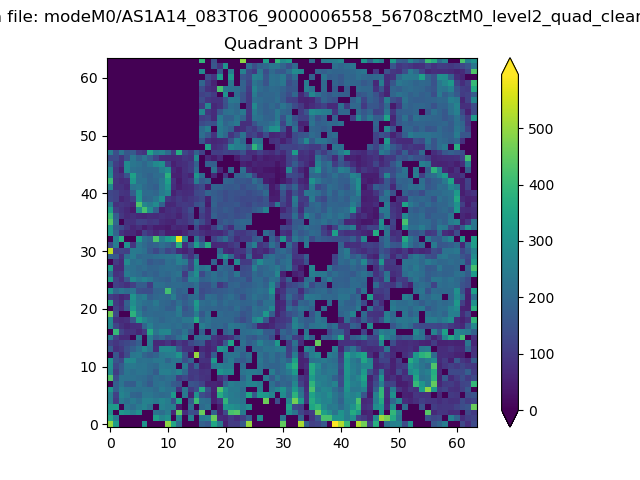 |
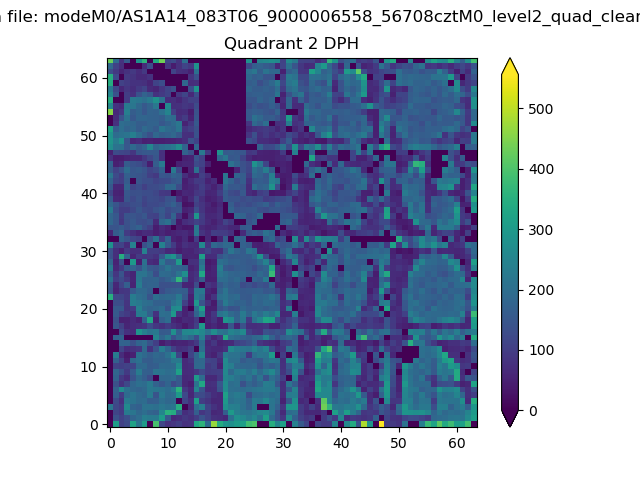 |
Quadrant C |
| Plot type | Count rate plots | Images |
|---|---|---|
| Comparison with Poisson distribution Blue bars denote a histogram of data divided into 1 sec bins. Red curve is a Poisson curve with rate = median count rate of data. |
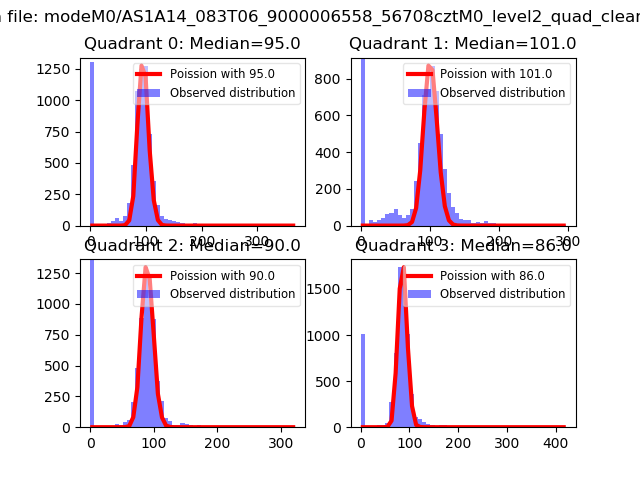 |
 |
| Quadrant-wise count rates Data is divided into 100 sec bins |
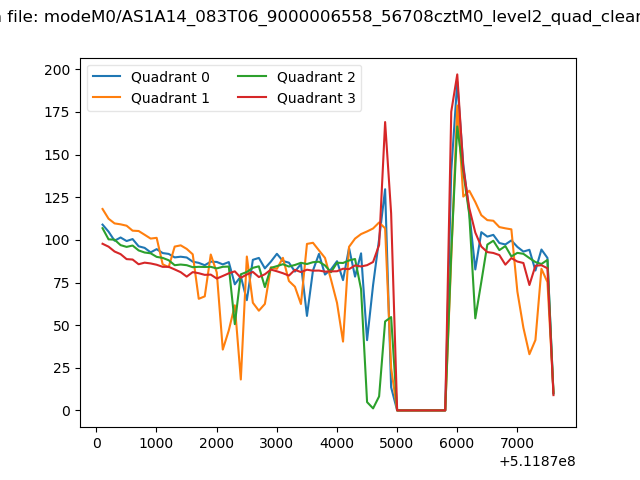 |
|
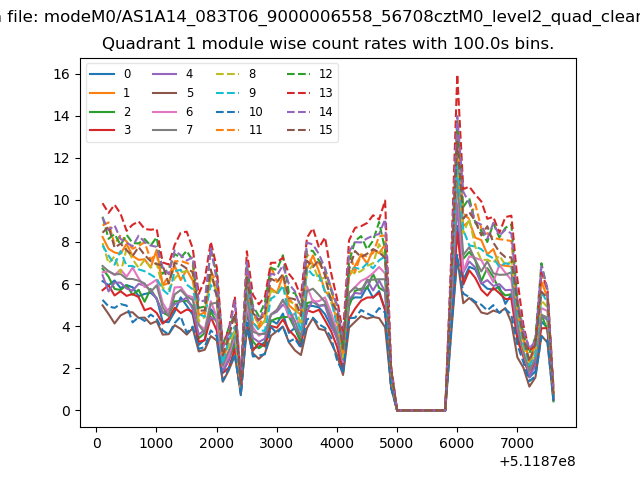
| Module-wise count rates for Quadrant A Data is divided into 100 sec bins |
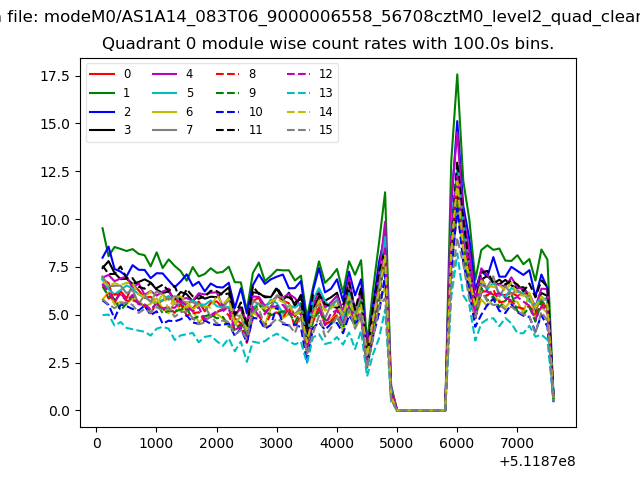 |
 |
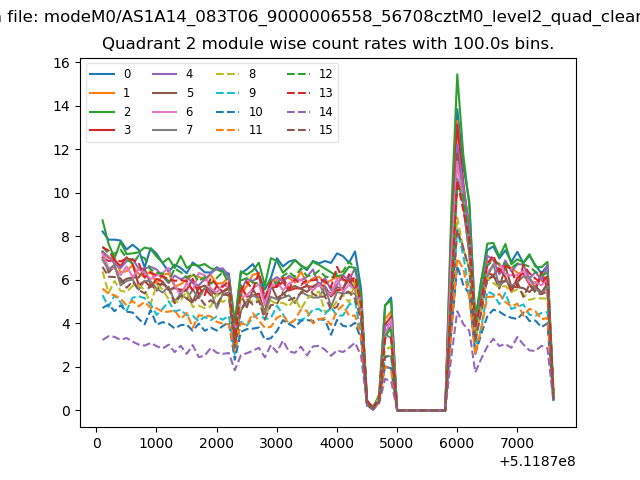
| Module-wise count rates for Quadrant B Data is divided into 100 sec bins |
 |
 |
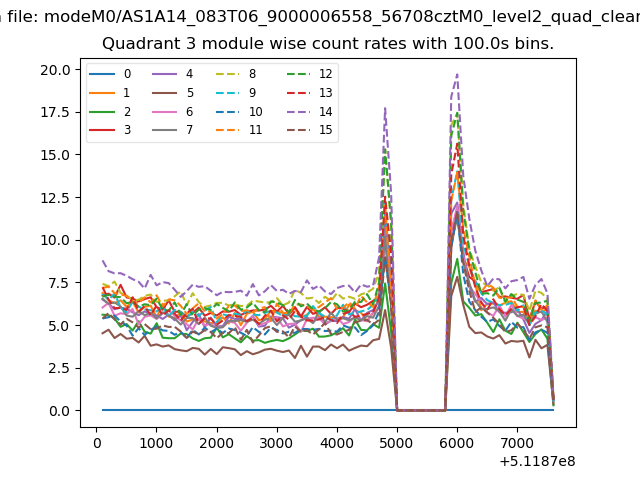
| Module-wise count rates for Quadrant C Data is divided into 100 sec bins |
 |
 |
| Module-wise count rates for Quadrant D Data is divided into 100 sec bins |
 |
 |
| Parameter | Plot |
|---|---|
| CZT HV Monitor | 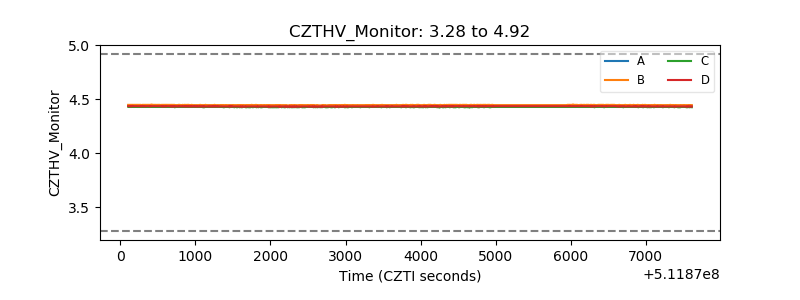 |
| D_VDD | 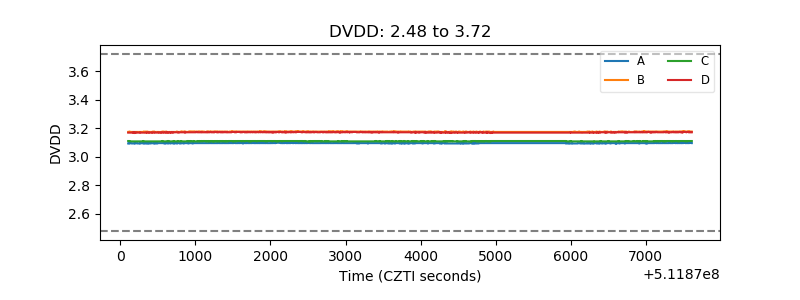 |
| Temperature 1 | 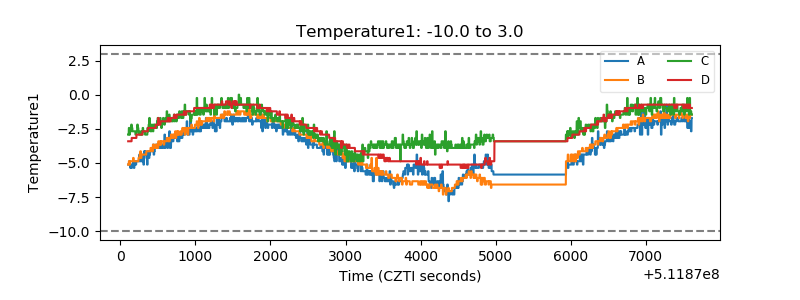 |
| Veto HV Monitor | 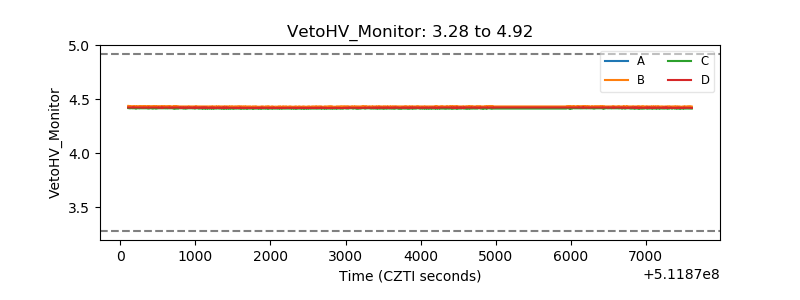 |
| Veto LLD | 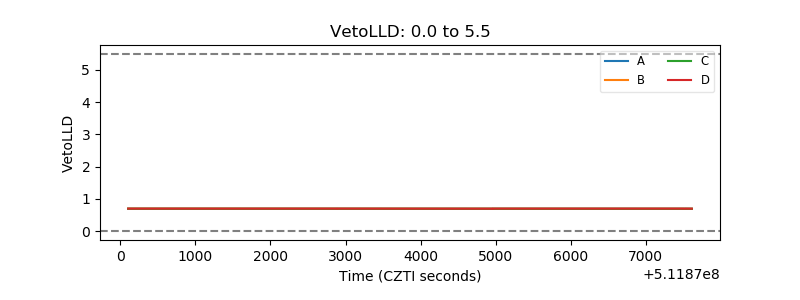 |
| Alpha Counter | 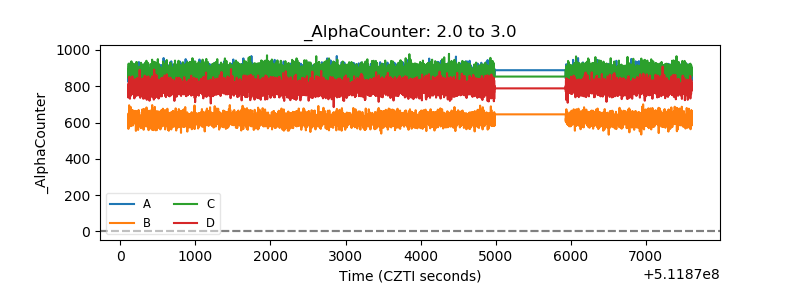 |
| _CPM_Rate | 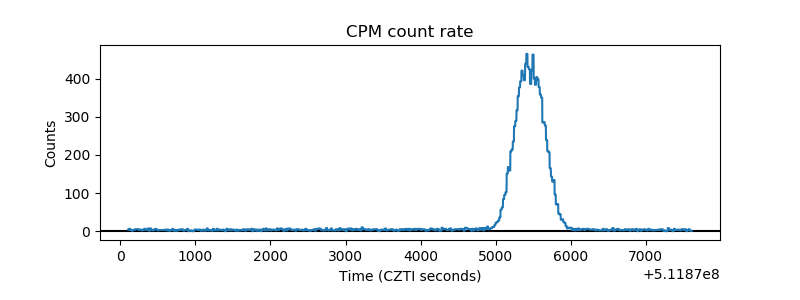 |
| CZT Counter | 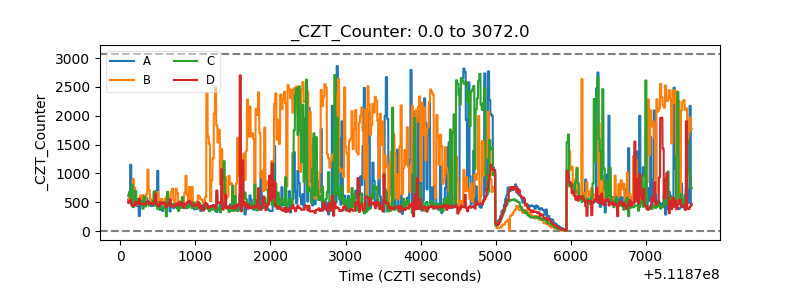 |
| +2.5 Volts monitor |  |
| +5 Volts monitor |  |
| _ROLL_ROT | 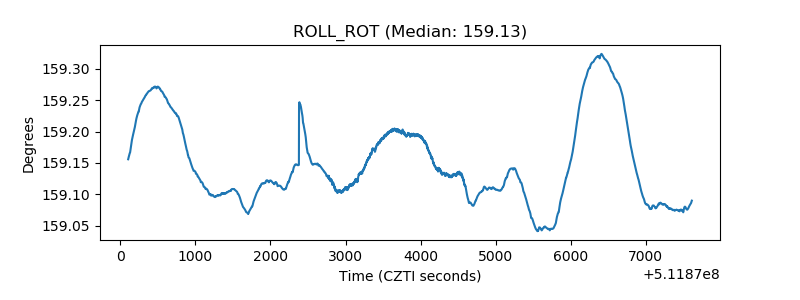 |
| _Roll_DEC | 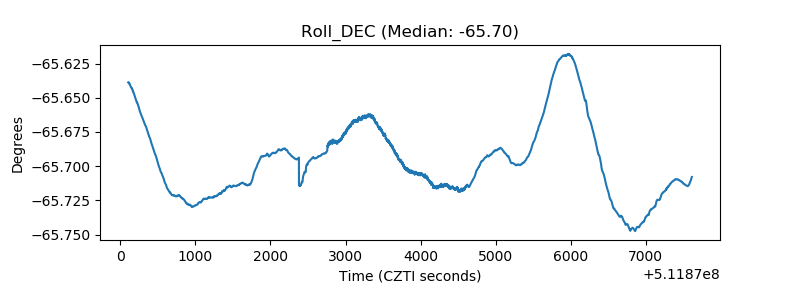 |
| _Roll_RA | 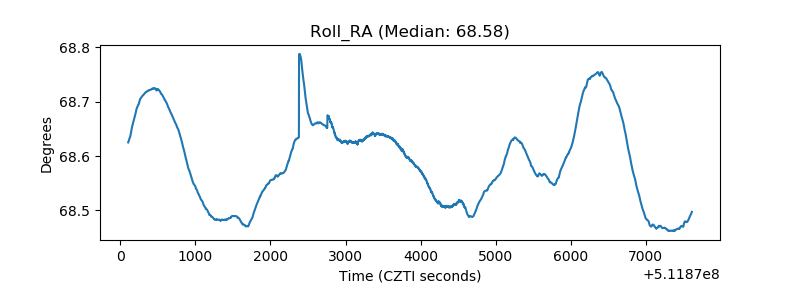 |
| Veto Counter | 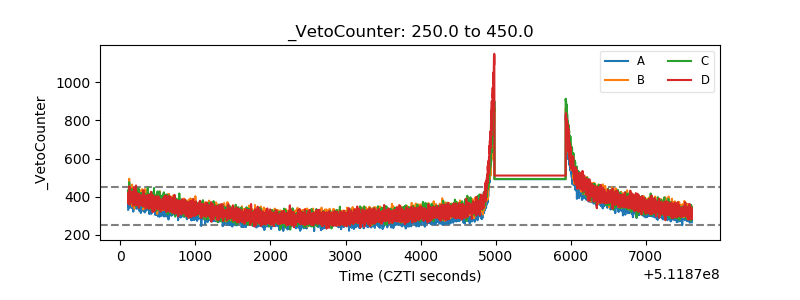 |