| Param | Original file | Final file |
|---|---|---|
| Filename | modeM0/AS1A14_083T06_9000006558_56710cztM0_level2.fits | modeM0/AS1A14_083T06_9000006558_56710cztM0_level2_quad_clean.evt |
| Size (bytes) | 457,418,880 | 85,161,600 |
| Size | 436.2 MB | 81.2 MB |
| Events in quadrant A | 3,694,103 | 559,428 |
| Events in quadrant B | 5,580,225 | 563,519 |
| Events in quadrant C | 3,688,840 | 533,700 |
| Events in quadrant D | 3,505,386 | 505,148 |
| Mode SS | |||
|---|---|---|---|
| Quadrant | BADHDUFLAG | Total packets | Discarded packets |
| A | 0 | 122 | 0 |
| B | 0 | 122 | 0 |
| C | 0 | 122 | 0 |
| D | 0 | 122 | 0 |
| Mode M9 | |||
|---|---|---|---|
| Quadrant | BADHDUFLAG | Total packets | Discarded packets |
| A | 0 | 11 | 0 |
| B | 0 | 11 | 0 |
| C | 0 | 11 | 0 |
| D | 0 | 11 | 0 |
| Mode M0 | |||
|---|---|---|---|
| Quadrant | BADHDUFLAG | Total packets | Discarded packets |
| A | 0 | 15428 | 1 |
| B | 0 | 20668 | 1 |
| C | 0 | 15204 | 1 |
| D | 0 | 14696 | 1 |
| Quadrant | Total seconds | Saturated seconds | Saturation percentage |
|---|---|---|---|
| A | 5963 | 347 | 5.819219% |
| B | 5963 | 768 | 12.879423% |
| C | 5964 | 211 | 3.537894% |
| D | 5964 | 230 | 3.856472% |
Noise dominated data is calculated using 1-second bins in cleaned event files. If a bin has >2000 counts, and if more than 50% of those come from <1% of pixels, then it is considered to be noise-dominated and hence unusable.
| Quadrant | # 1 sec bins | Bins with >0 counts | Bins with >2000 counts | High rate bins dominated by noise | Noise dominated (total time) | Noise dominated (detector-on time) | Marked lightcurve |
|---|---|---|---|---|---|---|---|
| A | 7078 | 5963 | 233 | 233 | 3.29% | 3.91% | 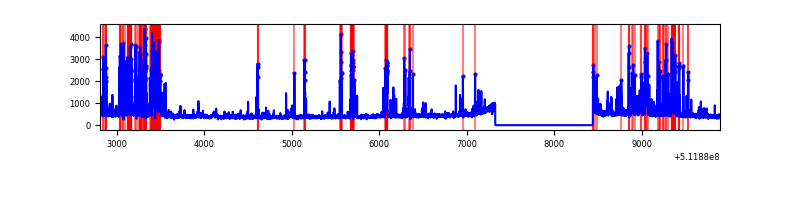 |
| B | 7078 | 5963 | 531 | 531 | 7.50% | 8.90% | 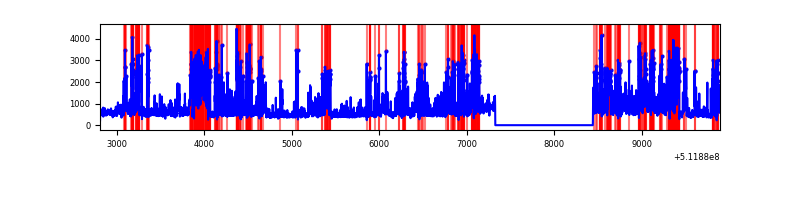 |
| C | 7079 | 5965 | 158 | 158 | 2.23% | 2.65% | 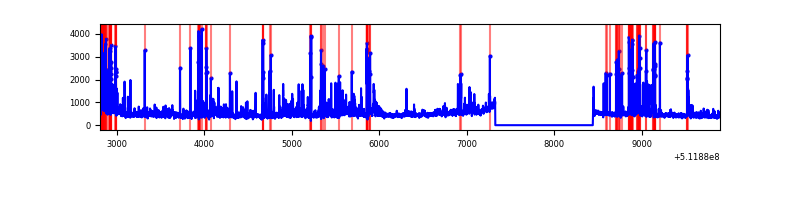 |
| D | 7079 | 5965 | 177 | 177 | 2.50% | 2.97% | 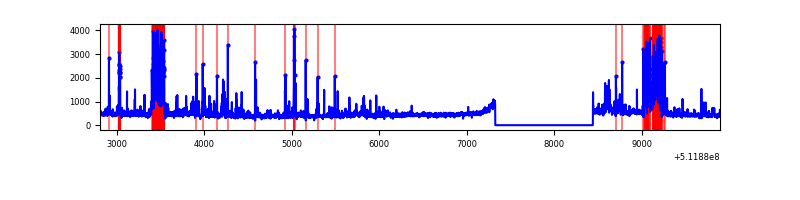 |
Top three noisy pixels from each quadrant. If the there are fewer than three noisy pixels in the level2.evt file, extra rows are filled as -1
| Pixel properties | Quadrant properties | ||||||
|---|---|---|---|---|---|---|---|
| Quadrant | DetID | PixID | Counts | Sigma | Mean | Median | Sigma |
| A | 3 | 62 | 918680 | 5886.65 | 628 | 613 | 156.0 |
| A | 8 | 26 | 113561 | 724.22 | 628 | 613 | 156.0 |
| A | 4 | 95 | 91279 | 581.35 | 628 | 613 | 156.0 |
| B | 5 | 185 | 2912527 | 22602.04 | 603 | 583 | 128.8 |
| B | 10 | 247 | 133898 | 1034.77 | 603 | 583 | 128.8 |
| B | 2 | 249 | 52941 | 406.39 | 603 | 583 | 128.8 |
| C | 13 | 3 | 766322 | 4674.51 | 601 | 594 | 163.8 |
| C | 9 | 38 | 310461 | 1891.63 | 601 | 594 | 163.8 |
| C | 12 | 252 | 79616 | 482.4 | 601 | 594 | 163.8 |
| D | 2 | 249 | 585415 | 3414.66 | 605 | 576 | 171.3 |
| D | 8 | 240 | 179072 | 1042.17 | 605 | 576 | 171.3 |
| D | 6 | 239 | 68723 | 397.89 | 605 | 576 | 171.3 |
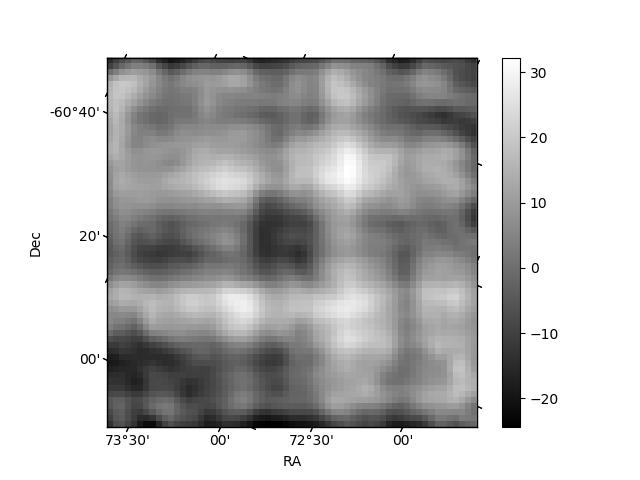
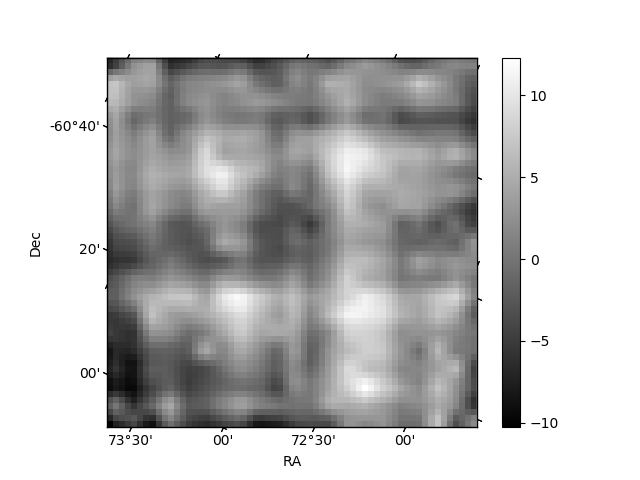
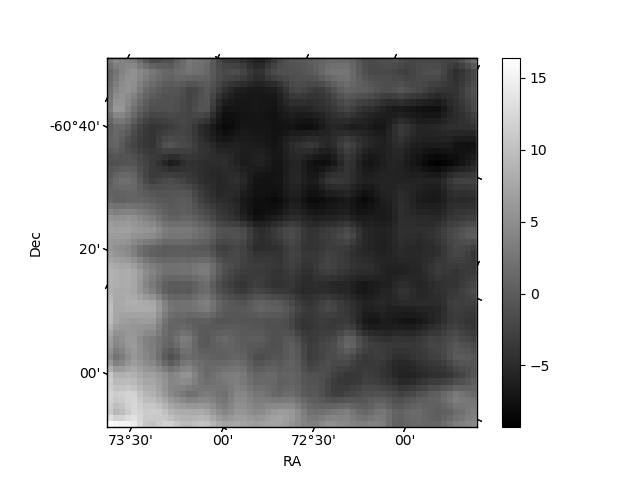
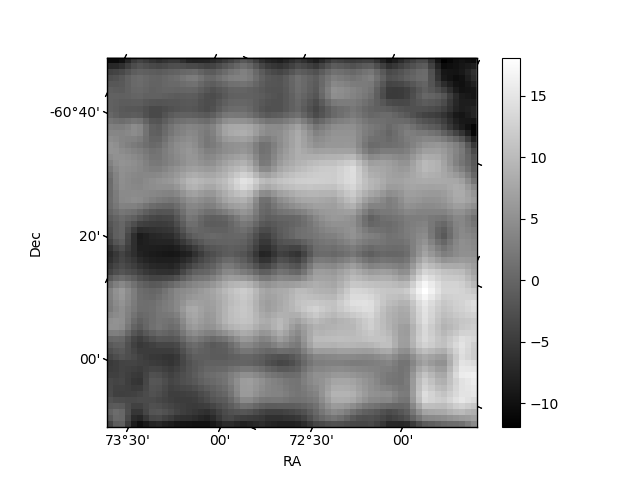
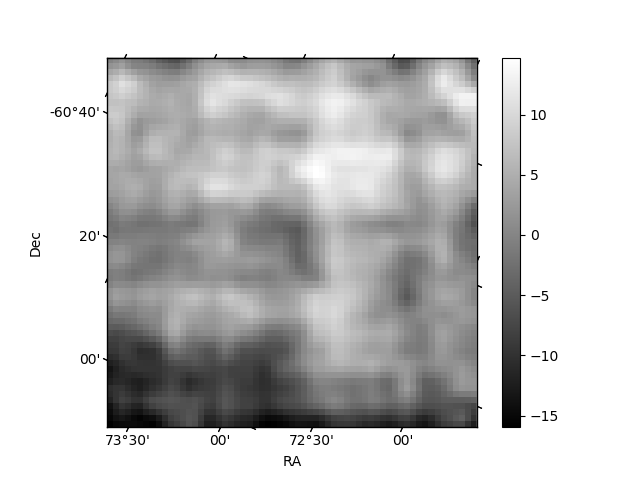
Histogram calculated using DETX and DETY for each event in the final _common_clean file
| Quadrant A | 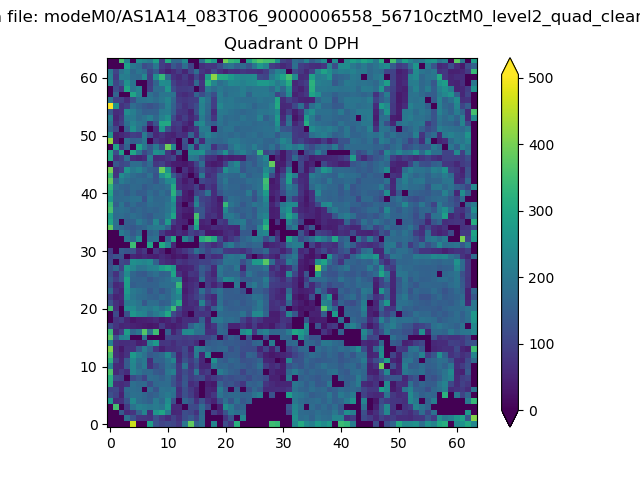 |
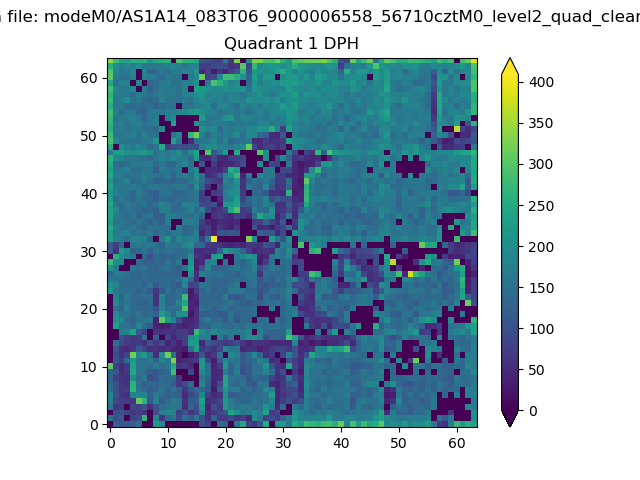 |
Quadrant B |
|---|---|---|---|
| Quadrant D | 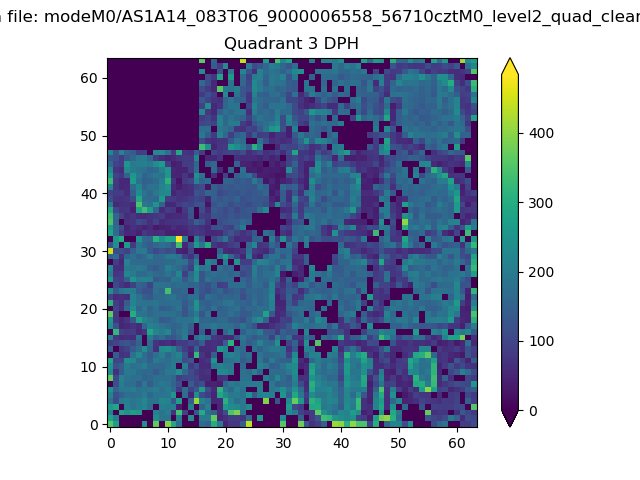 |
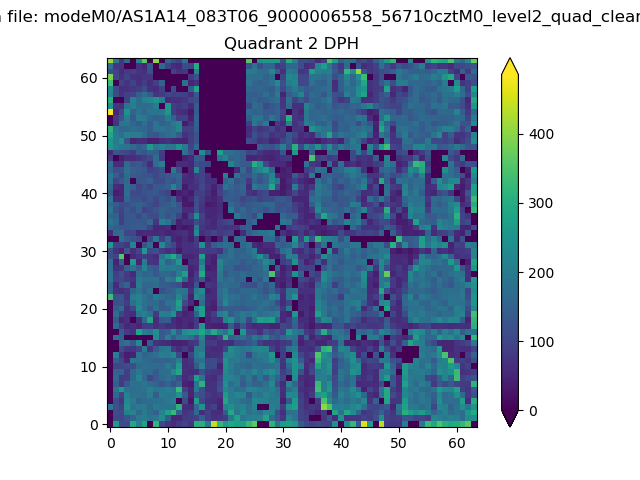 |
Quadrant C |
| Plot type | Count rate plots | Images |
|---|---|---|
| Comparison with Poisson distribution Blue bars denote a histogram of data divided into 1 sec bins. Red curve is a Poisson curve with rate = median count rate of data. |
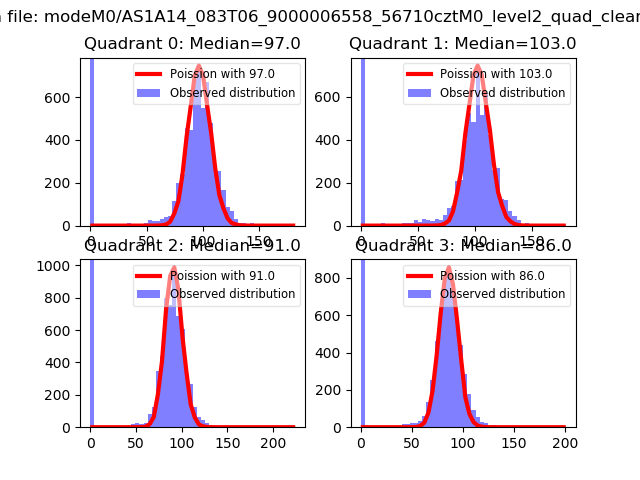 |
 |
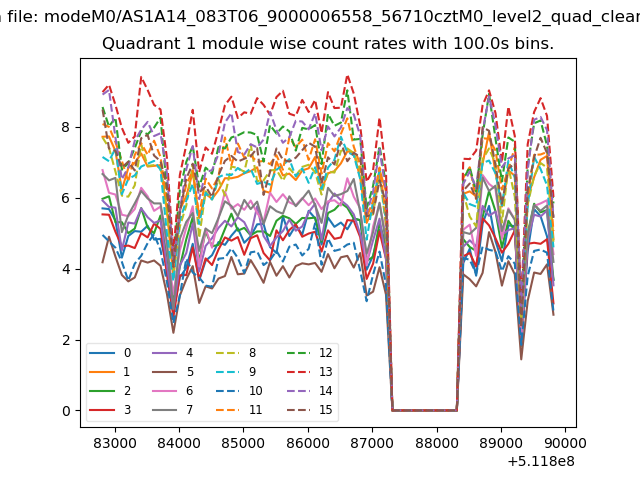
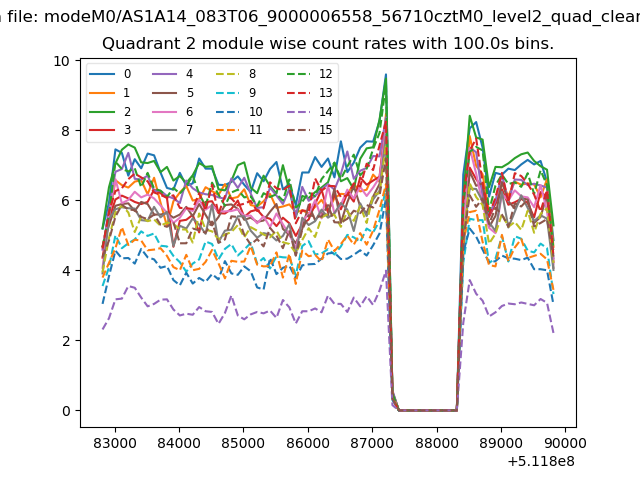
| Quadrant-wise count rates Data is divided into 100 sec bins |
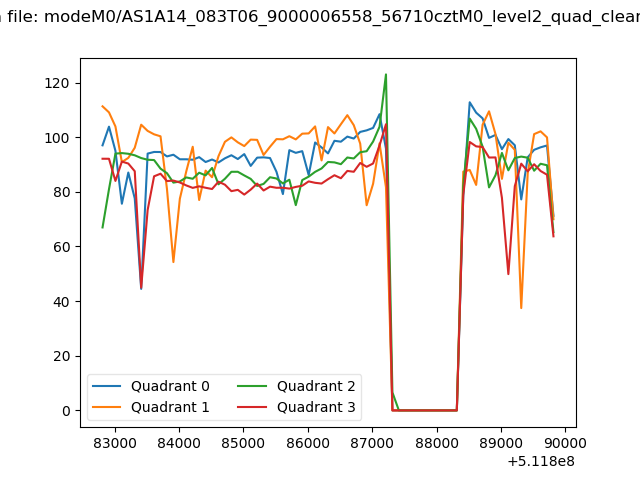 |
|
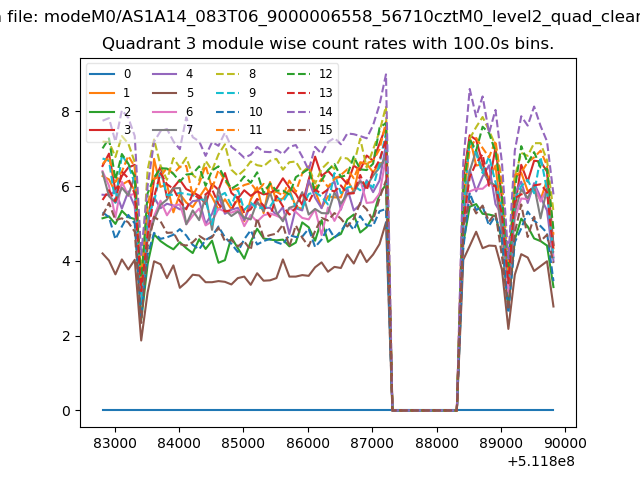
| Module-wise count rates for Quadrant A Data is divided into 100 sec bins |
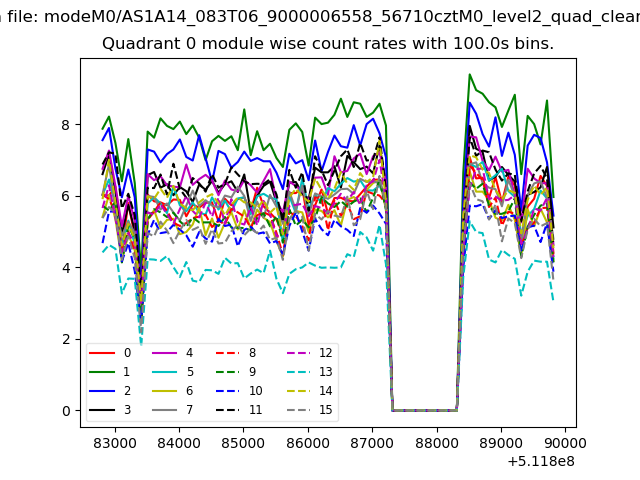 |
 |
| Module-wise count rates for Quadrant B Data is divided into 100 sec bins |
 |
 |
| Module-wise count rates for Quadrant C Data is divided into 100 sec bins |
 |
 |
| Module-wise count rates for Quadrant D Data is divided into 100 sec bins |
 |
 |
| Parameter | Plot |
|---|---|
| CZT HV Monitor |  |
| D_VDD | 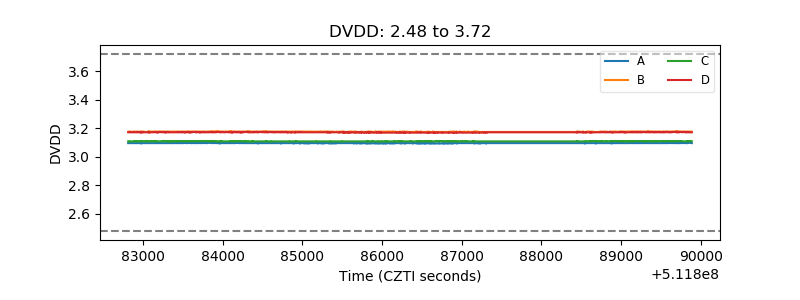 |
| Temperature 1 | 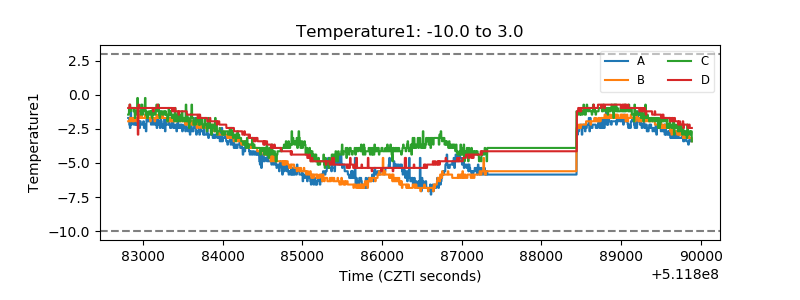 |
| Veto HV Monitor | 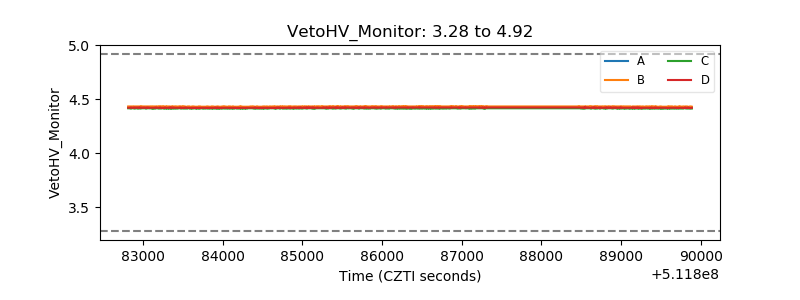 |
| Veto LLD | 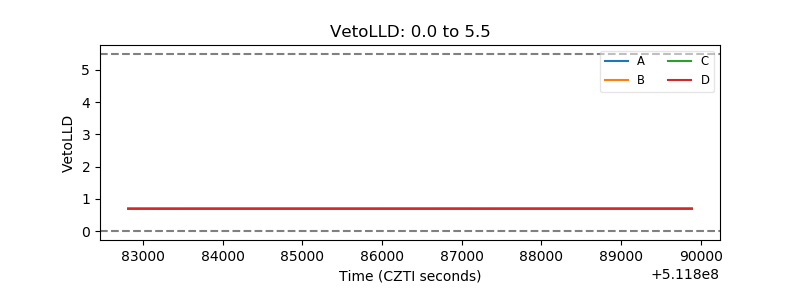 |
| Alpha Counter | 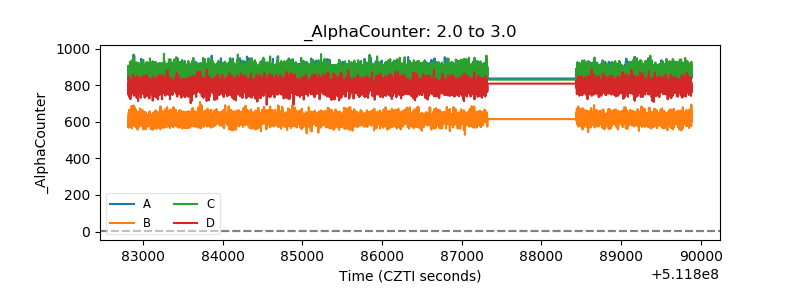 |
| _CPM_Rate | 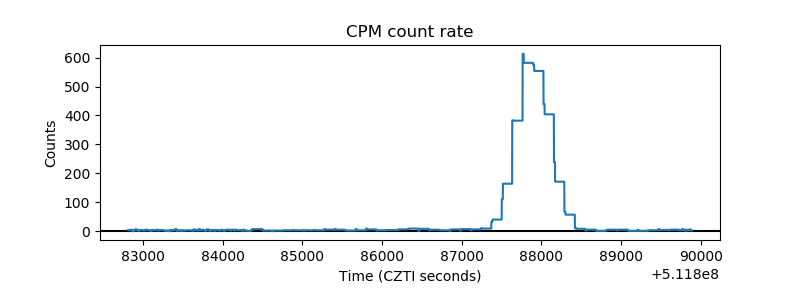 |
| CZT Counter | 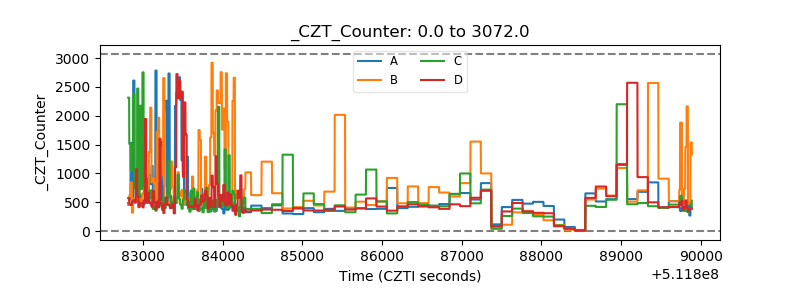 |
| +2.5 Volts monitor |  |
| +5 Volts monitor |  |
| _ROLL_ROT | 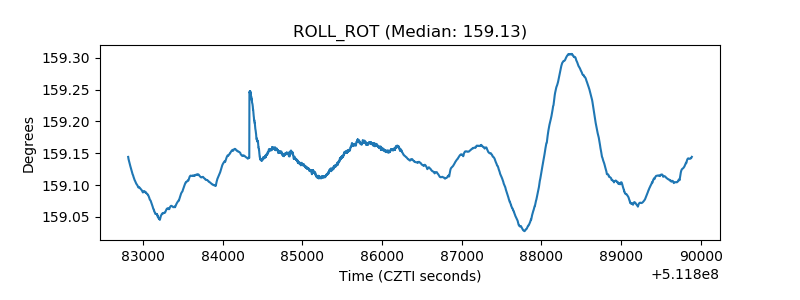 |
| _Roll_DEC | 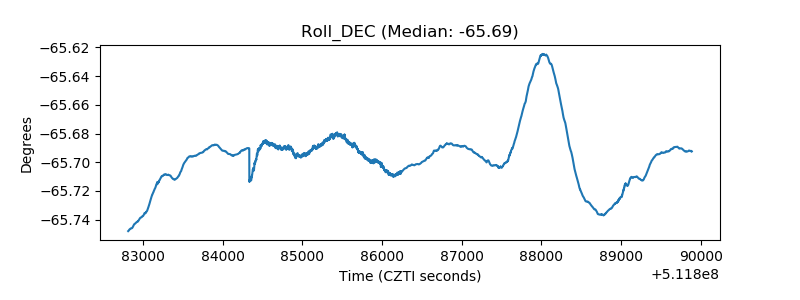 |
| _Roll_RA | 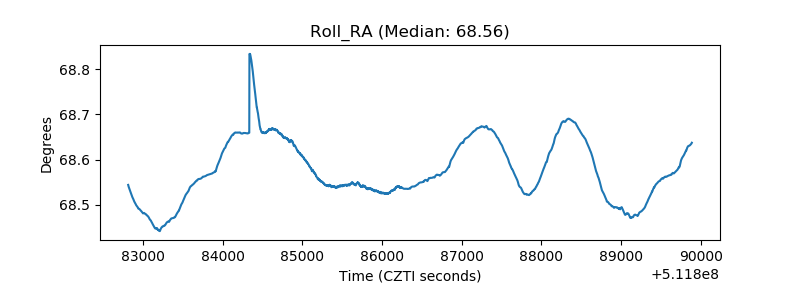 |
| Veto Counter | 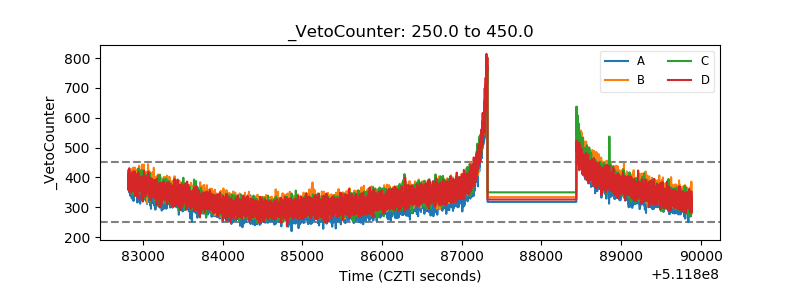 |