| Param | Original file | Final file |
|---|---|---|
| Filename | modeM0/AS1A14_083T06_9000006558_56711cztM0_level2.fits | modeM0/AS1A14_083T06_9000006558_56711cztM0_level2_quad_clean.evt |
| Size (bytes) | 476,608,320 | 83,606,400 |
| Size | 454.5 MB | 79.7 MB |
| Events in quadrant A | 4,083,404 | 555,497 |
| Events in quadrant B | 5,364,748 | 540,839 |
| Events in quadrant C | 4,236,648 | 515,041 |
| Events in quadrant D | 3,491,139 | 500,808 |
| Mode SS | |||
|---|---|---|---|
| Quadrant | BADHDUFLAG | Total packets | Discarded packets |
| A | 0 | 122 | 0 |
| B | 0 | 122 | 0 |
| C | 0 | 122 | 0 |
| D | 0 | 122 | 0 |
| Mode M9 | |||
|---|---|---|---|
| Quadrant | BADHDUFLAG | Total packets | Discarded packets |
| A | 0 | 11 | 0 |
| B | 0 | 11 | 0 |
| C | 0 | 11 | 0 |
| D | 0 | 11 | 0 |
| Mode M0 | |||
|---|---|---|---|
| Quadrant | BADHDUFLAG | Total packets | Discarded packets |
| A | 0 | 16436 | 1 |
| B | 0 | 20037 | 1 |
| C | 0 | 17034 | 1 |
| D | 0 | 14908 | 1 |
| Quadrant | Total seconds | Saturated seconds | Saturation percentage |
|---|---|---|---|
| A | 6000 | 347 | 5.783333% |
| B | 6000 | 900 | 15.000000% |
| C | 6000 | 407 | 6.783333% |
| D | 6001 | 207 | 3.449425% |
Noise dominated data is calculated using 1-second bins in cleaned event files. If a bin has >2000 counts, and if more than 50% of those come from <1% of pixels, then it is considered to be noise-dominated and hence unusable.
| Quadrant | # 1 sec bins | Bins with >0 counts | Bins with >2000 counts | High rate bins dominated by noise | Noise dominated (total time) | Noise dominated (detector-on time) | Marked lightcurve |
|---|---|---|---|---|---|---|---|
| A | 7145 | 6001 | 275 | 275 | 3.85% | 4.58% | 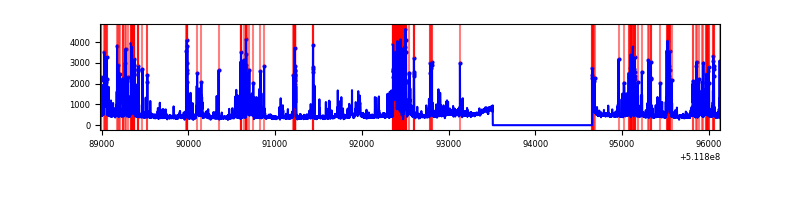 |
| B | 7145 | 6001 | 726 | 726 | 10.16% | 12.10% | 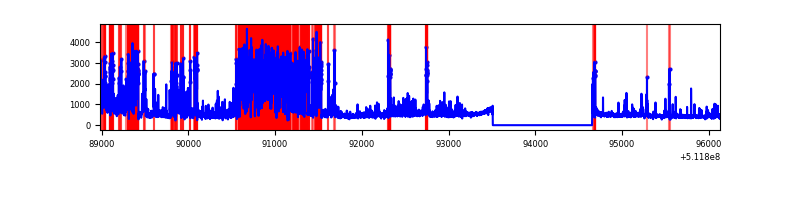 |
| C | 7145 | 6001 | 358 | 358 | 5.01% | 5.97% | 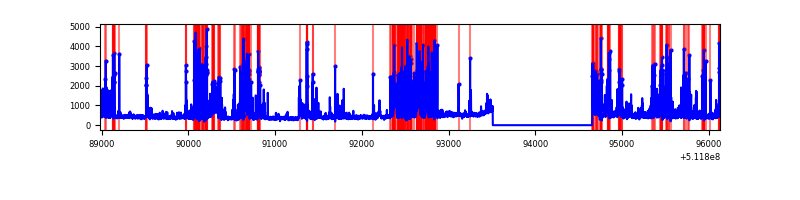 |
| D | 7146 | 6002 | 190 | 190 | 2.66% | 3.17% | 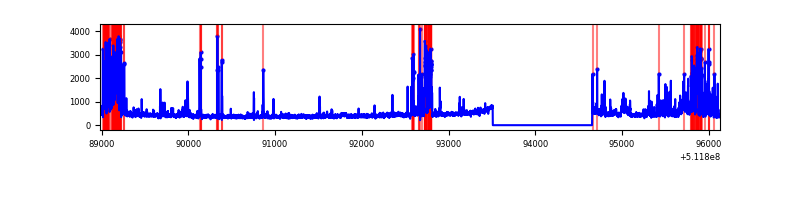 |
Top three noisy pixels from each quadrant. If the there are fewer than three noisy pixels in the level2.evt file, extra rows are filled as -1
| Pixel properties | Quadrant properties | ||||||
|---|---|---|---|---|---|---|---|
| Quadrant | DetID | PixID | Counts | Sigma | Mean | Median | Sigma |
| A | 3 | 62 | 988512 | 6417.12 | 620 | 604 | 153.9 |
| A | 8 | 26 | 270688 | 1754.38 | 620 | 604 | 153.9 |
| A | 10 | 251 | 184061 | 1191.68 | 620 | 604 | 153.9 |
| B | 5 | 185 | 2740651 | 21473.95 | 596 | 575 | 127.6 |
| B | 10 | 247 | 135901 | 1060.55 | 596 | 575 | 127.6 |
| B | 0 | 213 | 33720 | 259.76 | 596 | 575 | 127.6 |
| C | 13 | 3 | 1699256 | 10548.02 | 586 | 579 | 161.0 |
| C | 9 | 38 | 69623 | 428.73 | 586 | 579 | 161.0 |
| C | 12 | 252 | 55416 | 340.51 | 586 | 579 | 161.0 |
| D | 2 | 249 | 655911 | 3886.68 | 596 | 569 | 168.6 |
| D | 11 | 129 | 179754 | 1062.7 | 596 | 569 | 168.6 |
| D | 8 | 240 | 55225 | 324.15 | 596 | 569 | 168.6 |
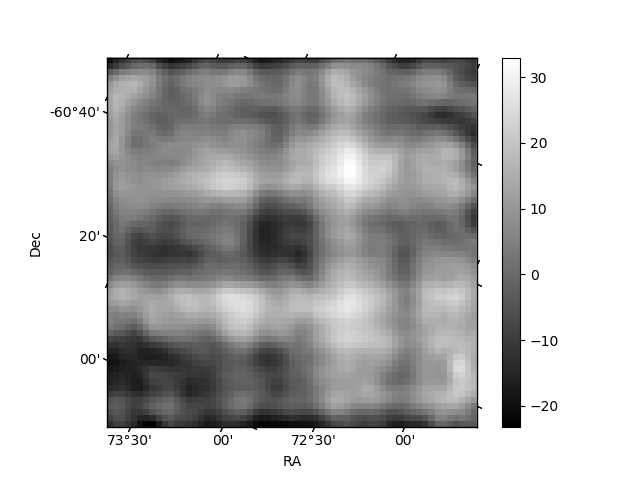
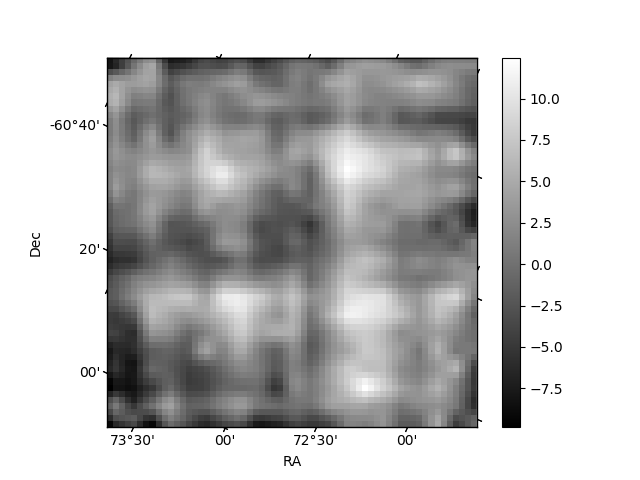
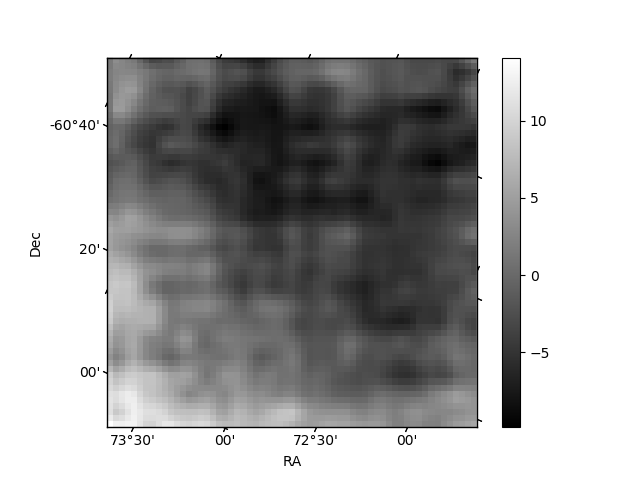
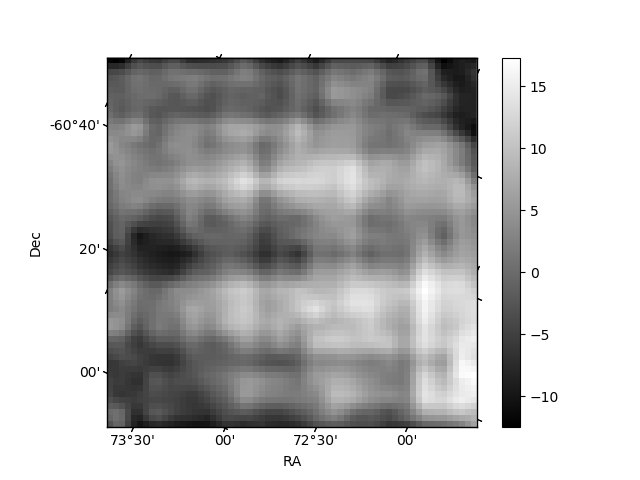
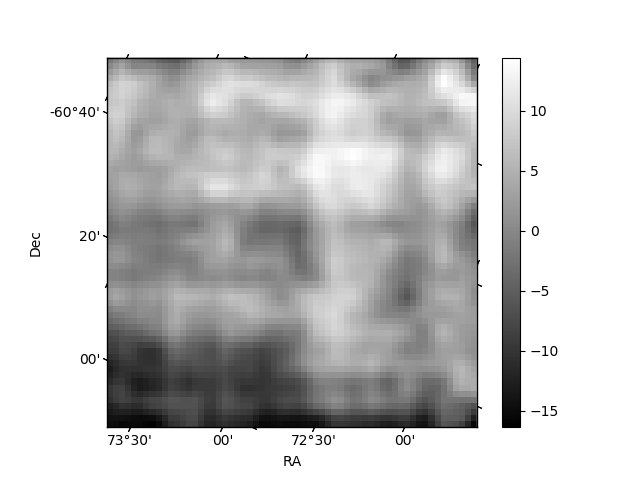
Histogram calculated using DETX and DETY for each event in the final _common_clean file
| Quadrant A | 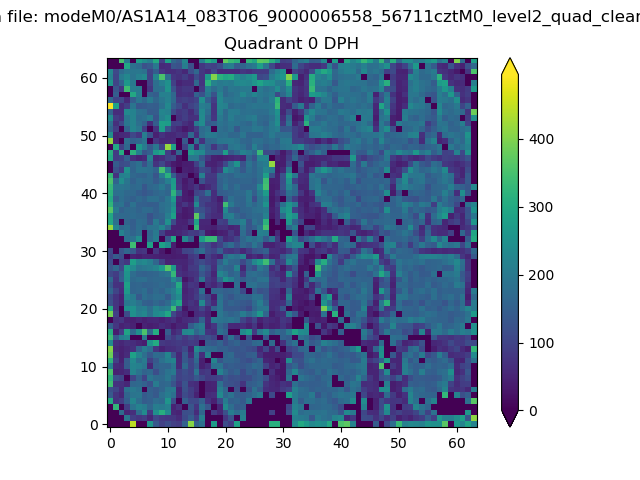 |
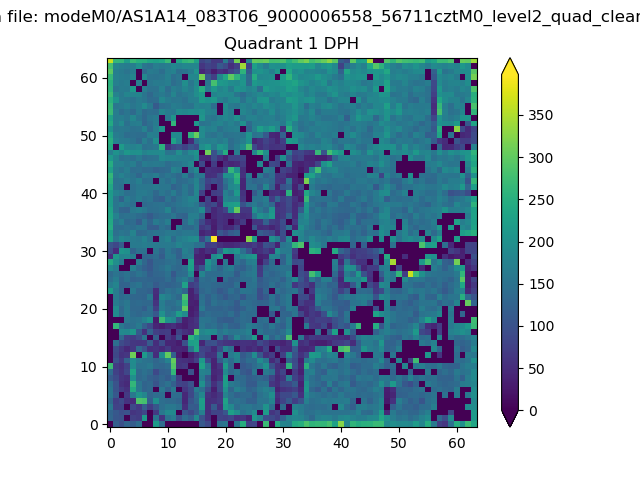 |
Quadrant B |
|---|---|---|---|
| Quadrant D | 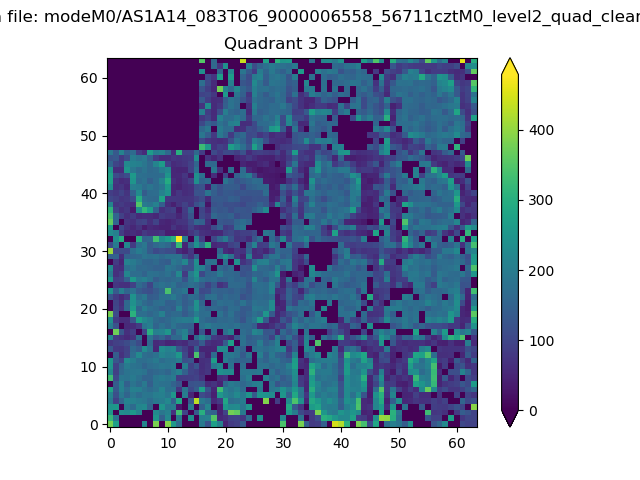 |
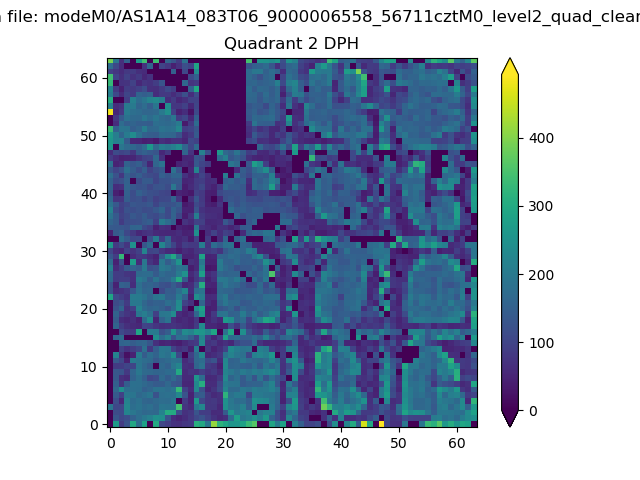 |
Quadrant C |
| Plot type | Count rate plots | Images |
|---|---|---|
| Comparison with Poisson distribution Blue bars denote a histogram of data divided into 1 sec bins. Red curve is a Poisson curve with rate = median count rate of data. |
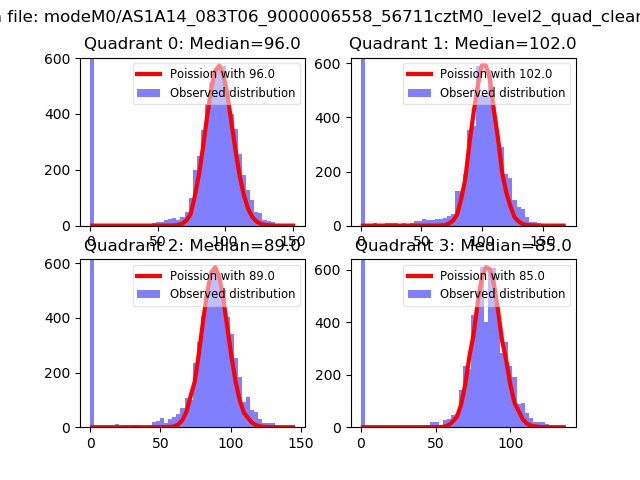 |
 |
| Quadrant-wise count rates Data is divided into 100 sec bins |
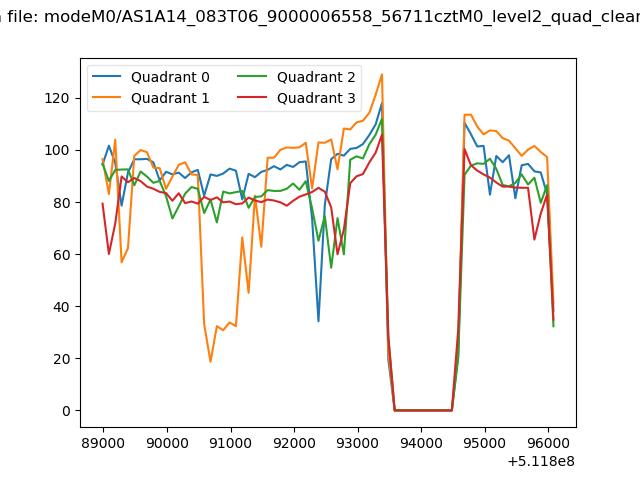 |
|
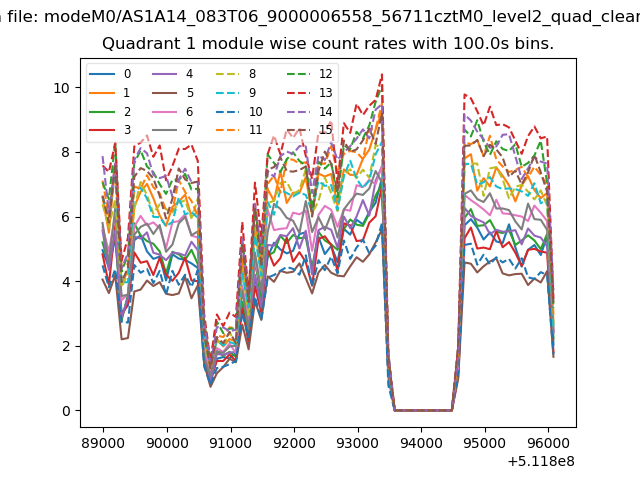
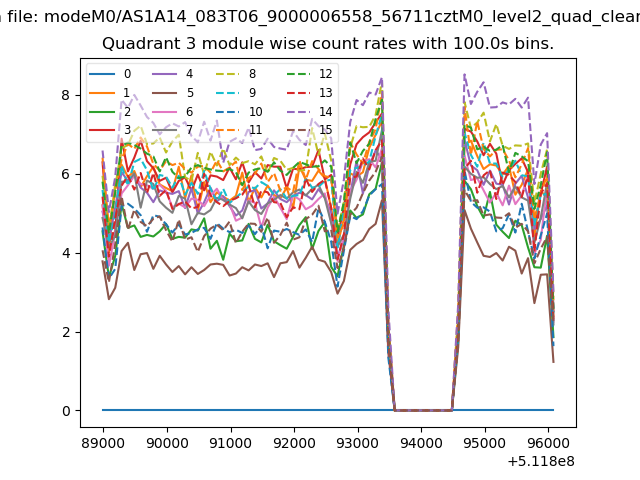
| Module-wise count rates for Quadrant A Data is divided into 100 sec bins |
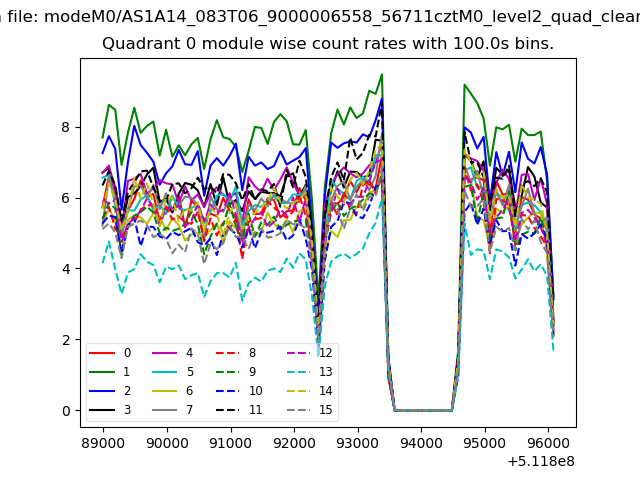 |
 |
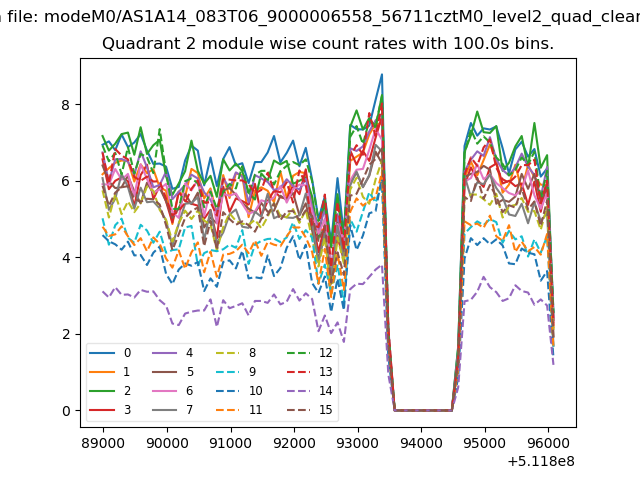
| Module-wise count rates for Quadrant B Data is divided into 100 sec bins |
 |
 |
| Module-wise count rates for Quadrant C Data is divided into 100 sec bins |
 |
 |
| Module-wise count rates for Quadrant D Data is divided into 100 sec bins |
 |
 |
| Parameter | Plot |
|---|---|
| CZT HV Monitor | 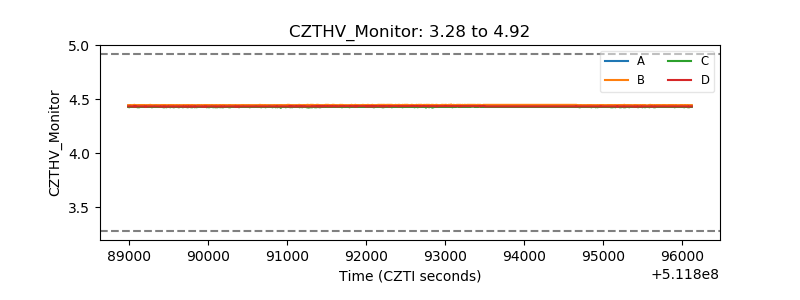 |
| D_VDD | 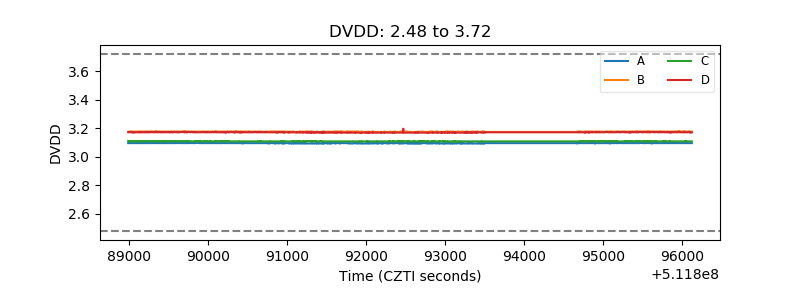 |
| Temperature 1 | 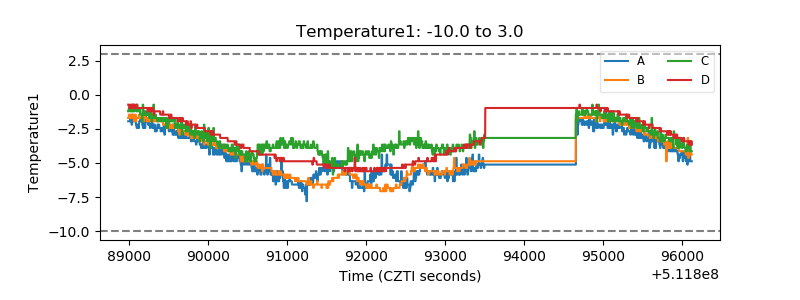 |
| Veto HV Monitor | 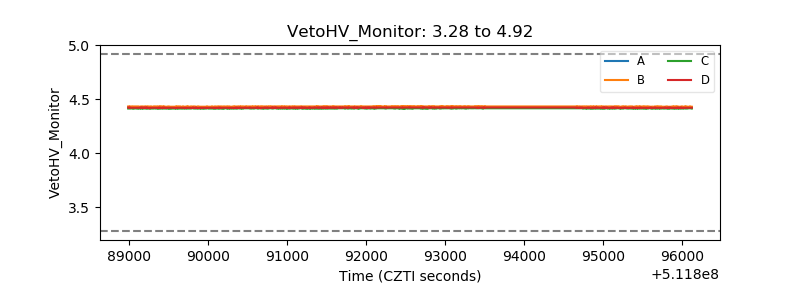 |
| Veto LLD | 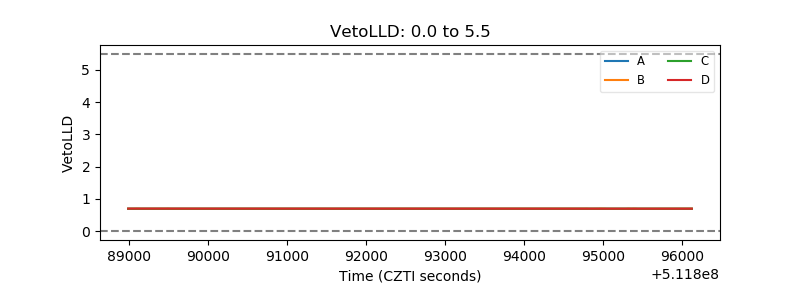 |
| Alpha Counter | 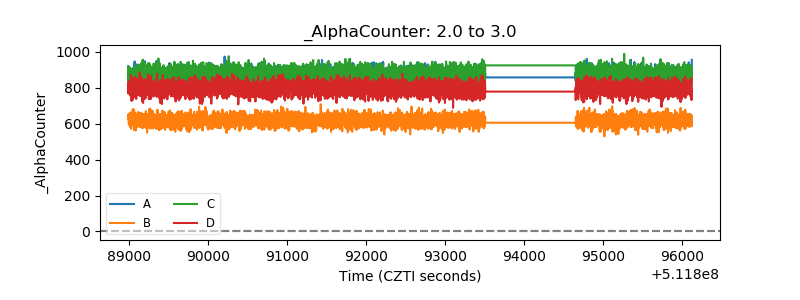 |
| _CPM_Rate | 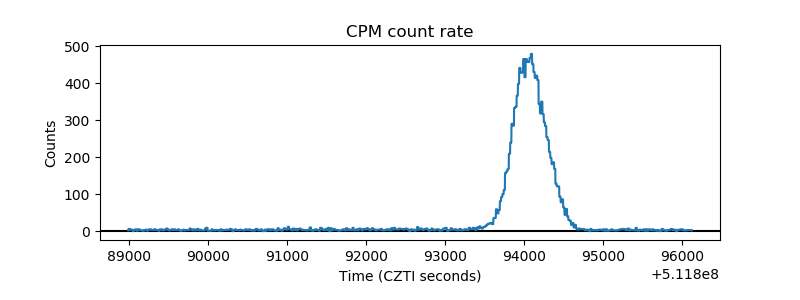 |
| CZT Counter | 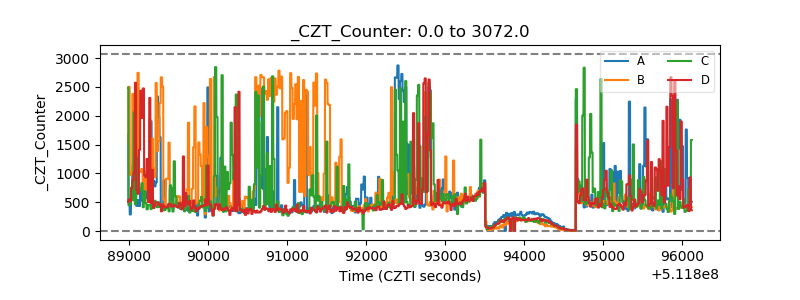 |
| +2.5 Volts monitor |  |
| +5 Volts monitor |  |
| _ROLL_ROT | 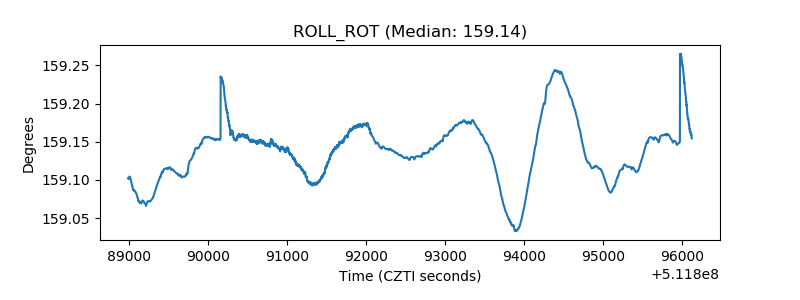 |
| _Roll_DEC | 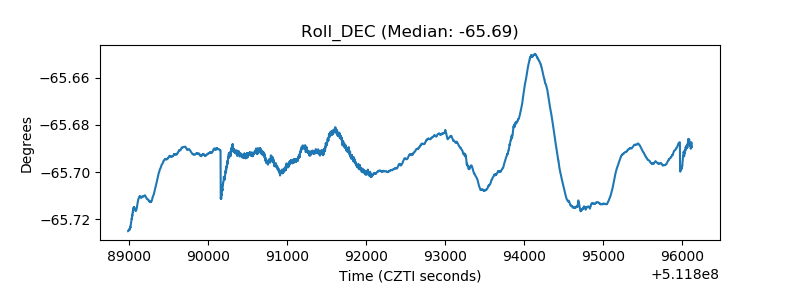 |
| _Roll_RA | 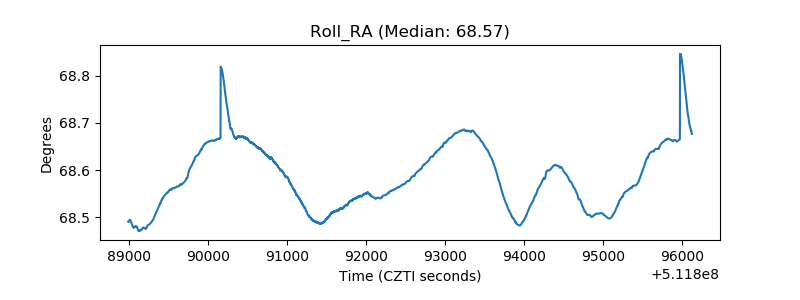 |
| Veto Counter | 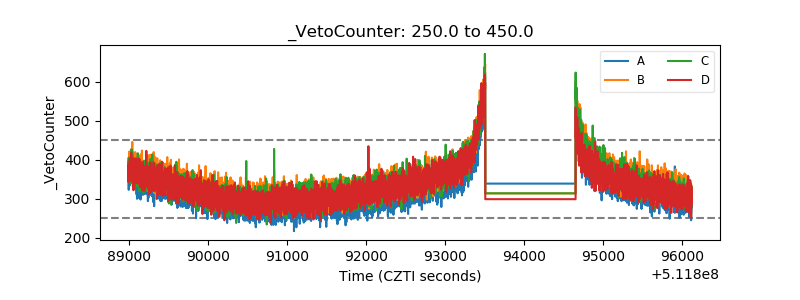 |