| Param | Original file | Final file |
|---|---|---|
| Filename | modeM0/AS1A14_083T06_9000006558_56713cztM0_level2.fits | modeM0/AS1A14_083T06_9000006558_56713cztM0_level2_quad_clean.evt |
| Size (bytes) | 509,886,720 | 103,184,640 |
| Size | 486.3 MB | 98.4 MB |
| Events in quadrant A | 5,072,425 | 655,149 |
| Events in quadrant B | 3,282,488 | 739,560 |
| Events in quadrant C | 6,224,124 | 605,642 |
| Events in quadrant D | 3,749,161 | 634,271 |
| Mode SS | |||
|---|---|---|---|
| Quadrant | BADHDUFLAG | Total packets | Discarded packets |
| A | 0 | 144 | 0 |
| B | 0 | 144 | 0 |
| C | 0 | 144 | 0 |
| D | 0 | 144 | 0 |
| Mode M9 | |||
|---|---|---|---|
| Quadrant | BADHDUFLAG | Total packets | Discarded packets |
| A | 0 | 10 | 0 |
| B | 0 | 10 | 0 |
| C | 0 | 11 | 0 |
| D | 0 | 11 | 0 |
| Mode M0 | |||
|---|---|---|---|
| Quadrant | BADHDUFLAG | Total packets | Discarded packets |
| A | 0 | 20176 | 2 |
| B | 0 | 15049 | 2 |
| C | 0 | 23549 | 2 |
| D | 0 | 16362 | 3 |
| Quadrant | Total seconds | Saturated seconds | Saturation percentage |
|---|---|---|---|
| A | 7027 | 578 | 8.225416% |
| B | 7027 | 92 | 1.309236% |
| C | 7027 | 846 | 12.039277% |
| D | 7026 | 120 | 1.707942% |
Noise dominated data is calculated using 1-second bins in cleaned event files. If a bin has >2000 counts, and if more than 50% of those come from <1% of pixels, then it is considered to be noise-dominated and hence unusable.
| Quadrant | # 1 sec bins | Bins with >0 counts | Bins with >2000 counts | High rate bins dominated by noise | Noise dominated (total time) | Noise dominated (detector-on time) | Marked lightcurve |
|---|---|---|---|---|---|---|---|
| A | 7727 | 7028 | 465 | 465 | 6.02% | 6.62% | 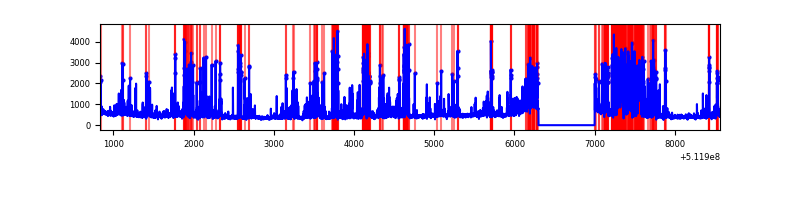 |
| B | 7727 | 7028 | 23 | 23 | 0.30% | 0.33% | 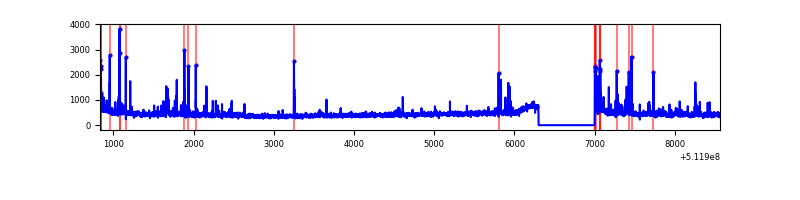 |
| C | 7727 | 7028 | 742 | 742 | 9.60% | 10.56% | 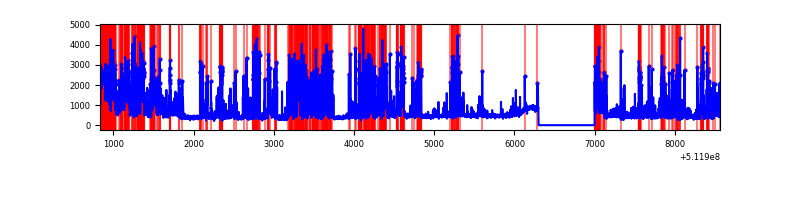 |
| D | 7726 | 7027 | 106 | 106 | 1.37% | 1.51% | 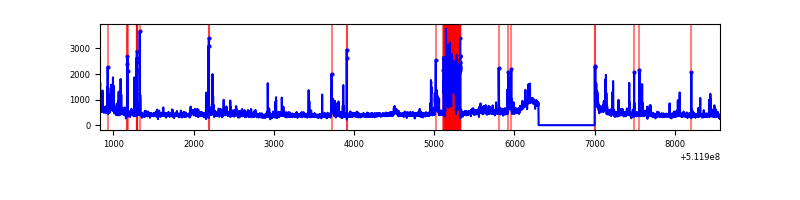 |
Top three noisy pixels from each quadrant. If the there are fewer than three noisy pixels in the level2.evt file, extra rows are filled as -1
| Pixel properties | Quadrant properties | ||||||
|---|---|---|---|---|---|---|---|
| Quadrant | DetID | PixID | Counts | Sigma | Mean | Median | Sigma |
| A | 3 | 62 | 1685932 | 9237.26 | 726 | 709 | 182.4 |
| A | 10 | 251 | 362708 | 1984.24 | 726 | 709 | 182.4 |
| A | 8 | 26 | 109383 | 595.68 | 726 | 709 | 182.4 |
| B | 10 | 247 | 94554 | 585.66 | 741 | 712 | 160.2 |
| B | 0 | 213 | 68410 | 422.5 | 741 | 712 | 160.2 |
| B | 10 | 16 | 52232 | 321.53 | 741 | 712 | 160.2 |
| C | 13 | 3 | 2112389 | 11104.38 | 685 | 679 | 190.2 |
| C | 15 | 230 | 1011949 | 5317.74 | 685 | 679 | 190.2 |
| C | 14 | 96 | 183817 | 963.03 | 685 | 679 | 190.2 |
| D | 14 | 49 | 375794 | 1819.87 | 722 | 688 | 206.1 |
| D | 2 | 249 | 139488 | 673.4 | 722 | 688 | 206.1 |
| D | 8 | 240 | 135268 | 652.93 | 722 | 688 | 206.1 |
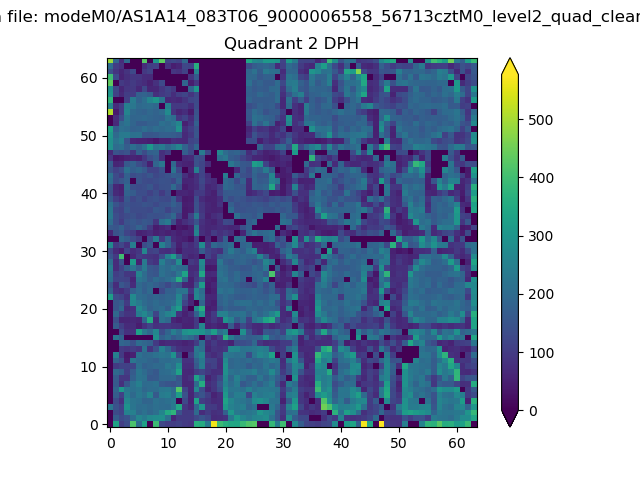
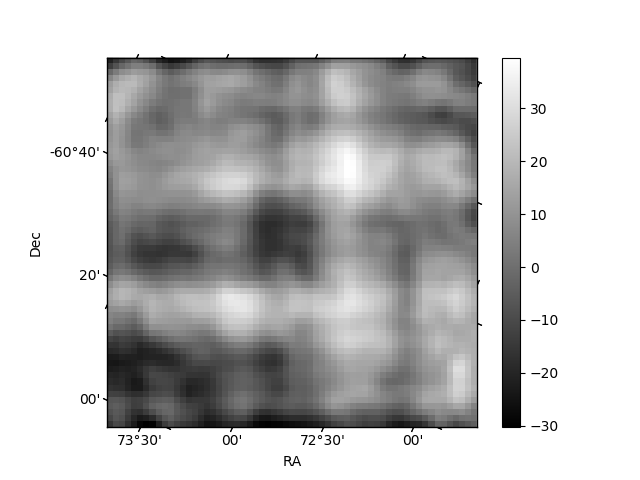
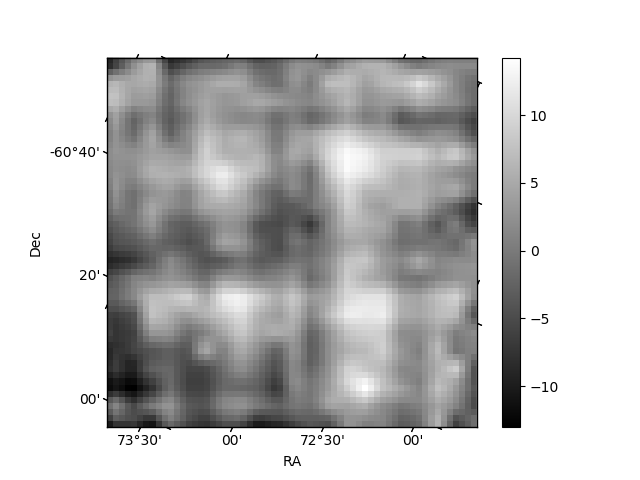
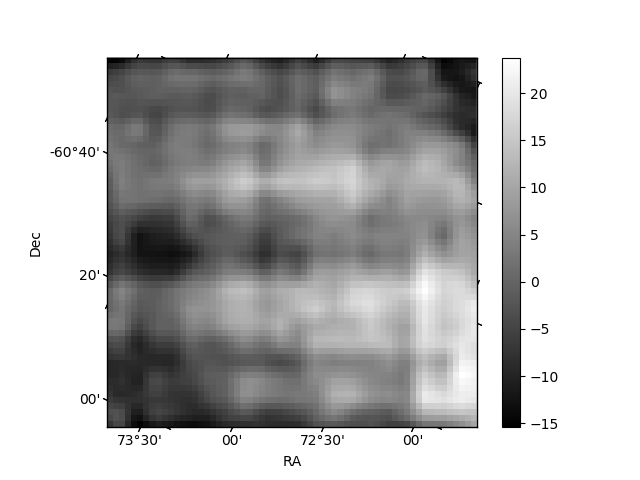
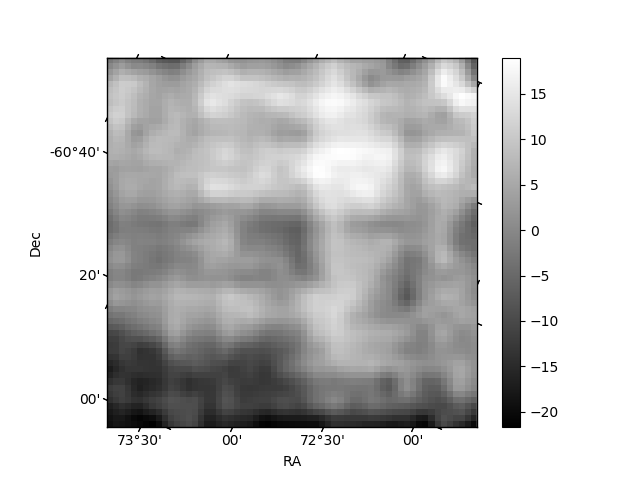
Histogram calculated using DETX and DETY for each event in the final _common_clean file
| Quadrant A | 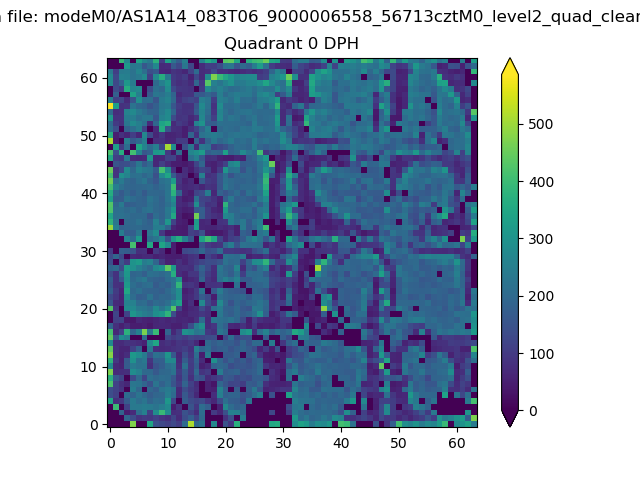 |
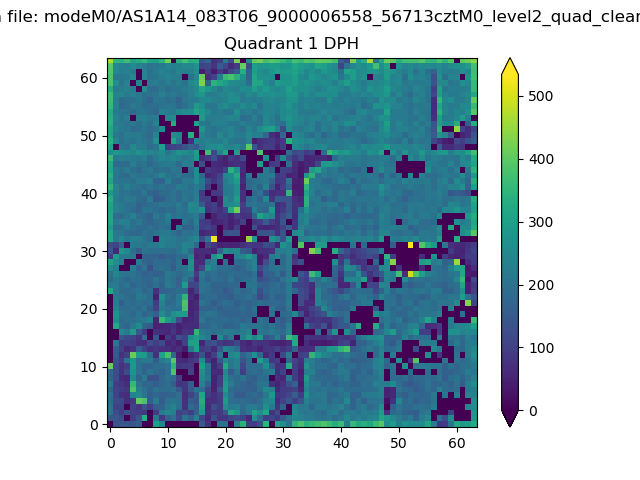 |
Quadrant B |
|---|---|---|---|
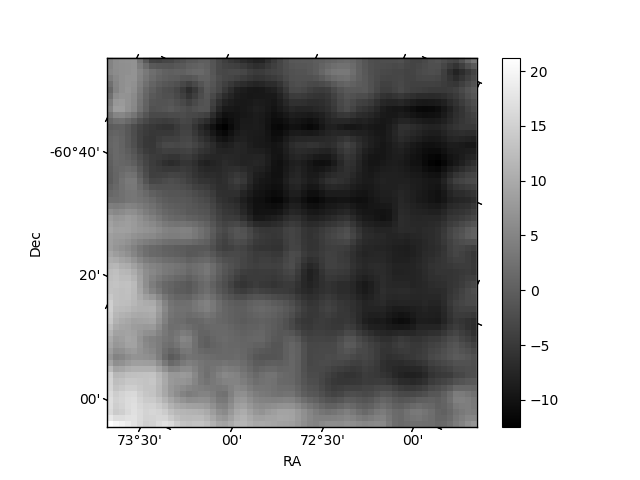
| Quadrant D | 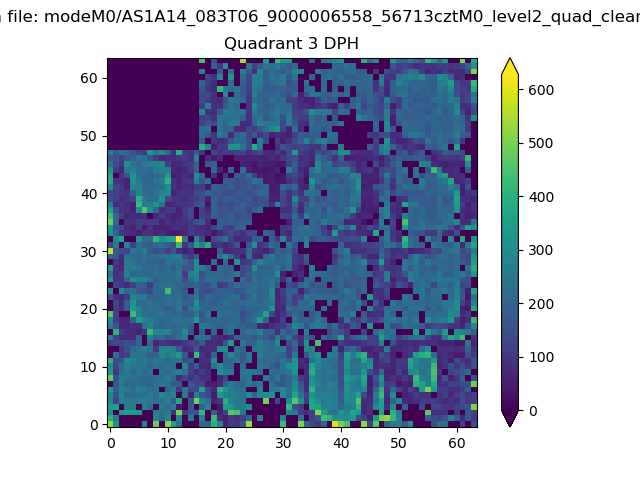 |
 |
Quadrant C |
| Plot type | Count rate plots | Images |
|---|---|---|
| Comparison with Poisson distribution Blue bars denote a histogram of data divided into 1 sec bins. Red curve is a Poisson curve with rate = median count rate of data. |
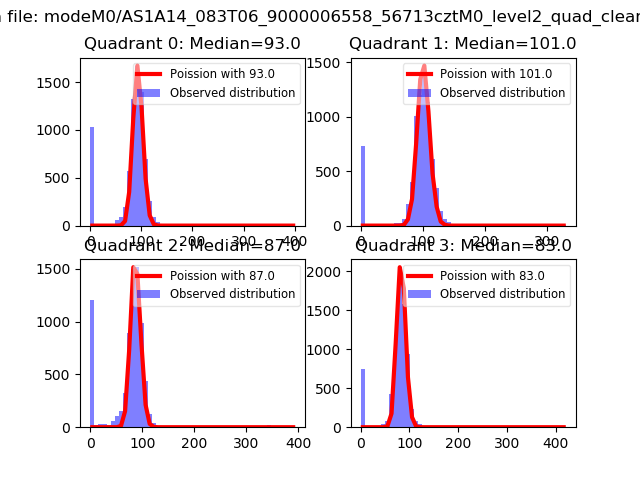 |
 |
| Quadrant-wise count rates Data is divided into 100 sec bins |
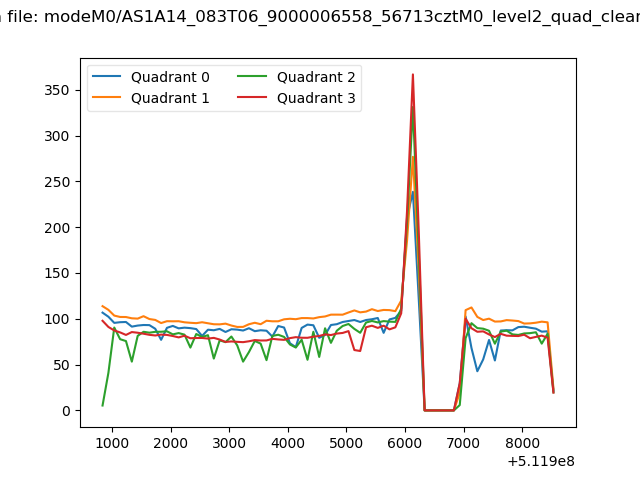 |
|
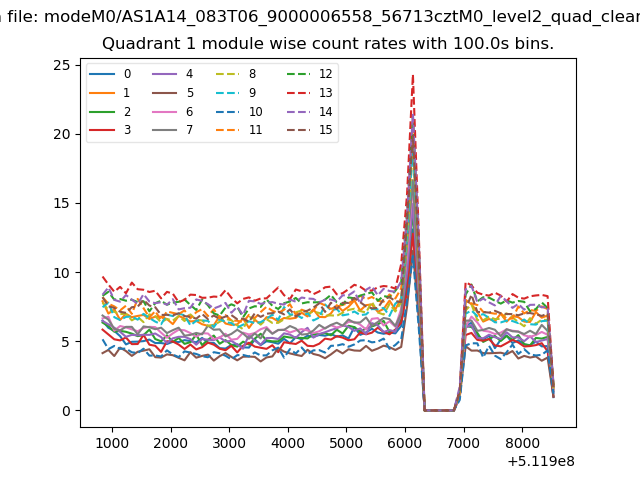
| Module-wise count rates for Quadrant A Data is divided into 100 sec bins |
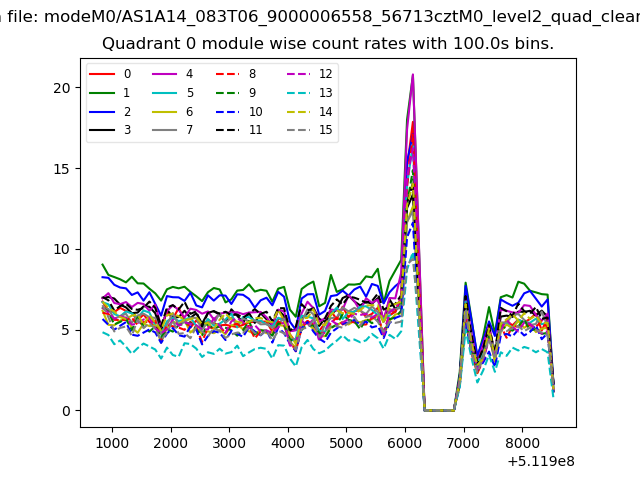 |
 |
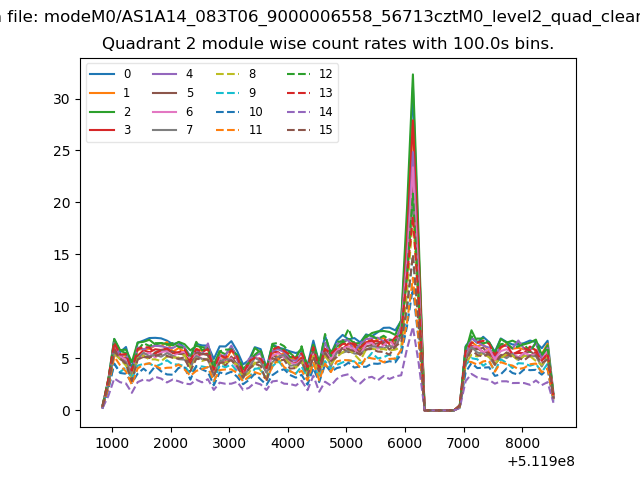
| Module-wise count rates for Quadrant B Data is divided into 100 sec bins |
 |
 |
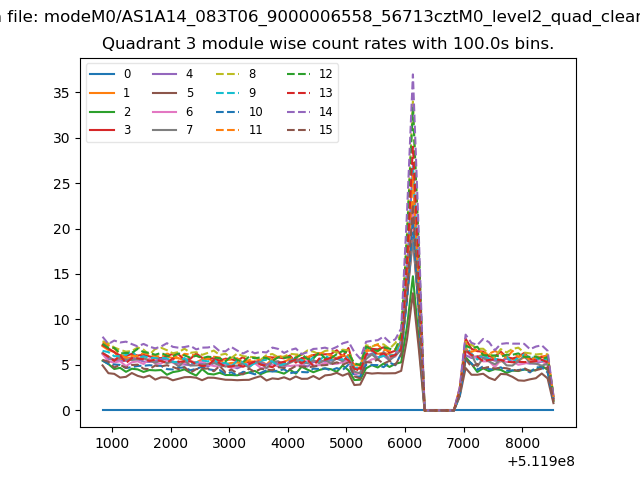
| Module-wise count rates for Quadrant C Data is divided into 100 sec bins |
 |
 |
| Module-wise count rates for Quadrant D Data is divided into 100 sec bins |
 |
 |
| Parameter | Plot |
|---|---|
| CZT HV Monitor | 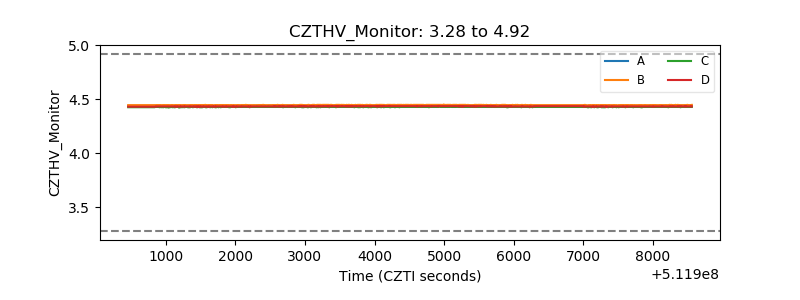 |
| D_VDD | 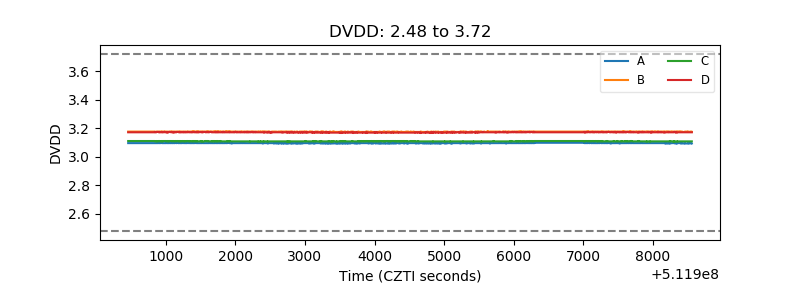 |
| Temperature 1 | 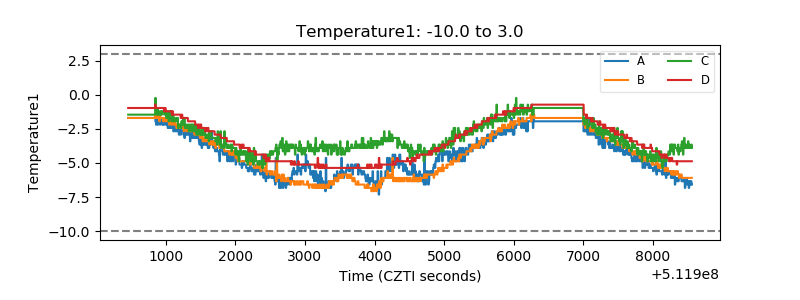 |
| Veto HV Monitor | 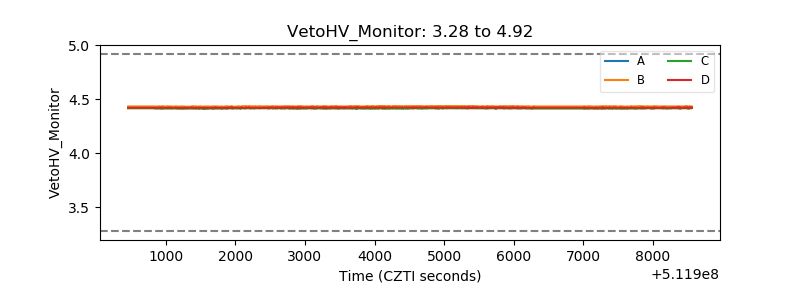 |
| Veto LLD | 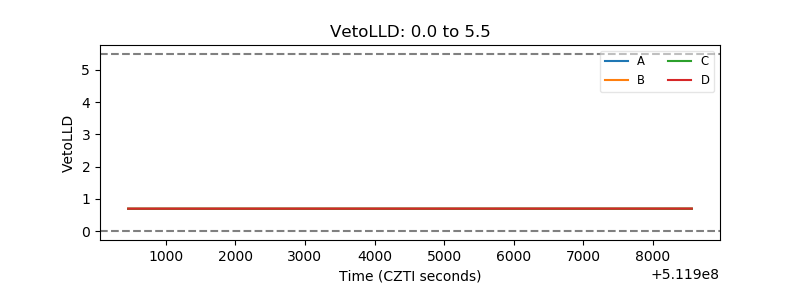 |
| Alpha Counter | 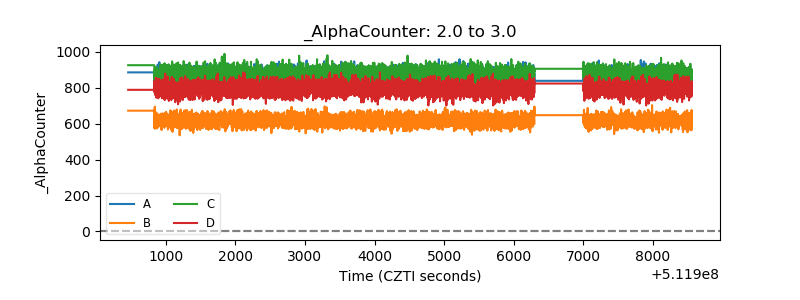 |
| _CPM_Rate | 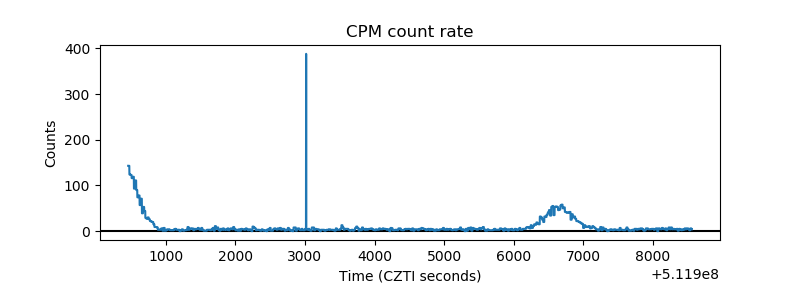 |
| CZT Counter | 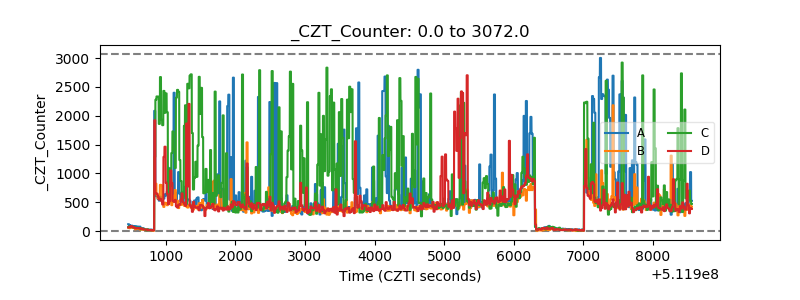 |
| +2.5 Volts monitor |  |
| +5 Volts monitor | 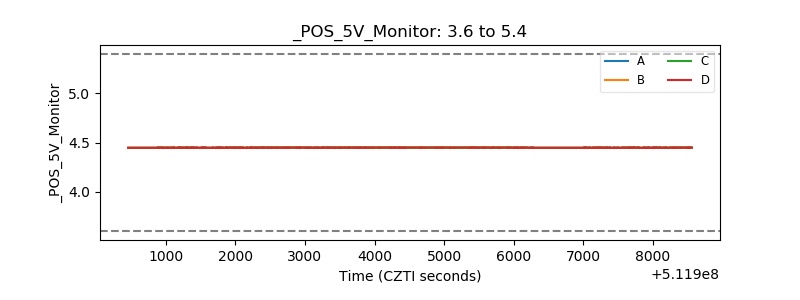 |
| _ROLL_ROT | 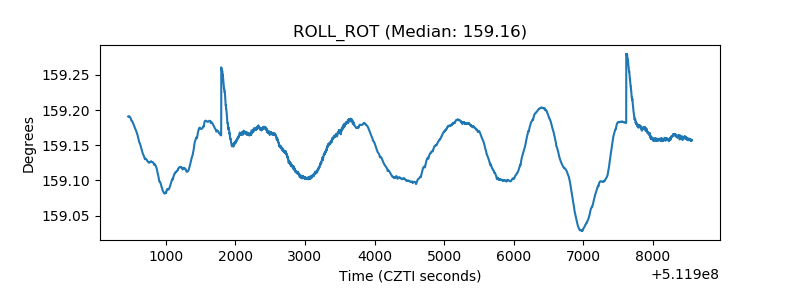 |
| _Roll_DEC | 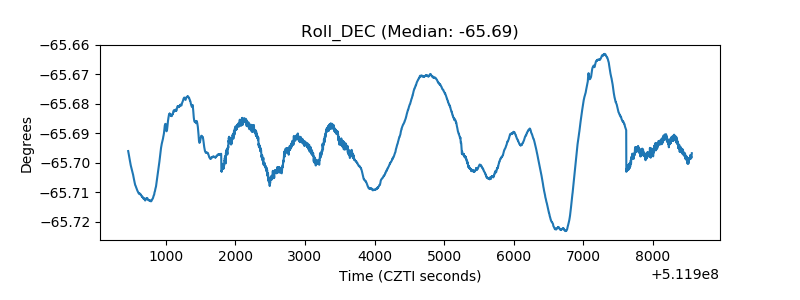 |
| _Roll_RA | 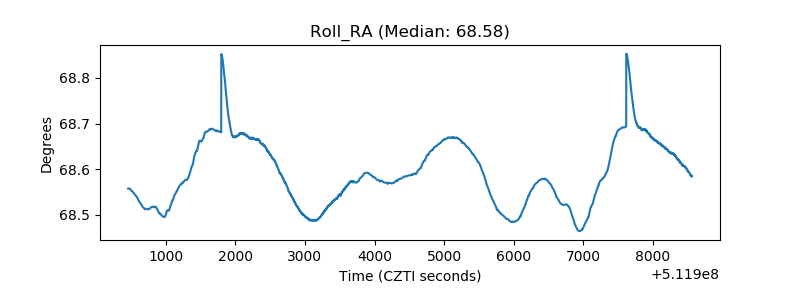 |
| Veto Counter | 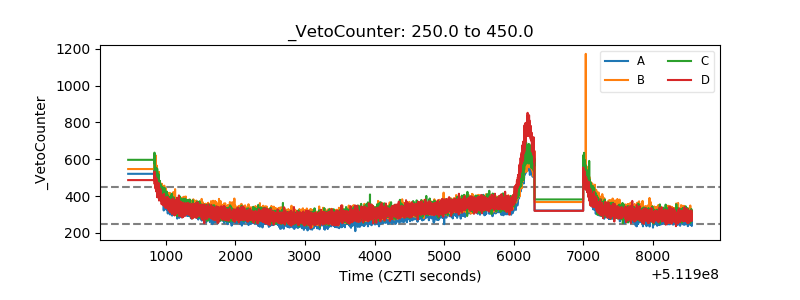 |