| Param | Original file | Final file |
|---|---|---|
| Filename | modeM0/AS1A14_083T06_9000006558_56714cztM0_level2.fits | modeM0/AS1A14_083T06_9000006558_56714cztM0_level2_quad_clean.evt |
| Size (bytes) | 524,131,200 | 112,052,160 |
| Size | 499.9 MB | 106.9 MB |
| Events in quadrant A | 5,578,692 | 714,807 |
| Events in quadrant B | 3,771,114 | 790,819 |
| Events in quadrant C | 5,364,454 | 678,316 |
| Events in quadrant D | 4,088,182 | 672,253 |
| Mode SS | |||
|---|---|---|---|
| Quadrant | BADHDUFLAG | Total packets | Discarded packets |
| A | 0 | 158 | 0 |
| B | 0 | 158 | 0 |
| C | 0 | 158 | 0 |
| D | 0 | 158 | 0 |
| Mode M9 | |||
|---|---|---|---|
| Quadrant | BADHDUFLAG | Total packets | Discarded packets |
| A | 0 | 6 | 0 |
| B | 0 | 6 | 0 |
| C | 0 | 7 | 0 |
| D | 0 | 7 | 0 |
| Mode M0 | |||
|---|---|---|---|
| Quadrant | BADHDUFLAG | Total packets | Discarded packets |
| A | 0 | 22213 | 2 |
| B | 0 | 16888 | 2 |
| C | 0 | 21616 | 2 |
| D | 0 | 18129 | 2 |
| Quadrant | Total seconds | Saturated seconds | Saturation percentage |
|---|---|---|---|
| A | 7710 | 619 | 8.028534% |
| B | 7710 | 154 | 1.997406% |
| C | 7710 | 474 | 6.147860% |
| D | 7710 | 168 | 2.178988% |
Noise dominated data is calculated using 1-second bins in cleaned event files. If a bin has >2000 counts, and if more than 50% of those come from <1% of pixels, then it is considered to be noise-dominated and hence unusable.
| Quadrant | # 1 sec bins | Bins with >0 counts | Bins with >2000 counts | High rate bins dominated by noise | Noise dominated (total time) | Noise dominated (detector-on time) | Marked lightcurve |
|---|---|---|---|---|---|---|---|
| A | 7870 | 7711 | 444 | 444 | 5.64% | 5.76% | 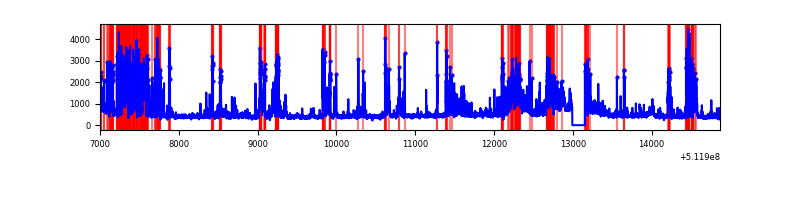 |
| B | 7870 | 7711 | 45 | 45 | 0.57% | 0.58% | 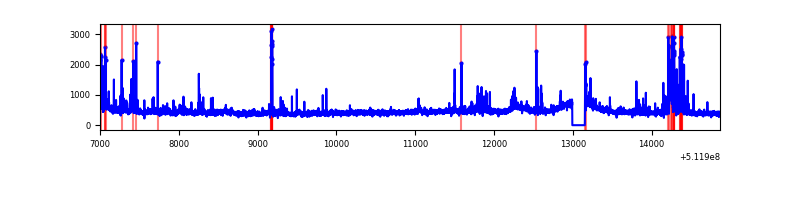 |
| C | 7870 | 7711 | 364 | 364 | 4.63% | 4.72% | 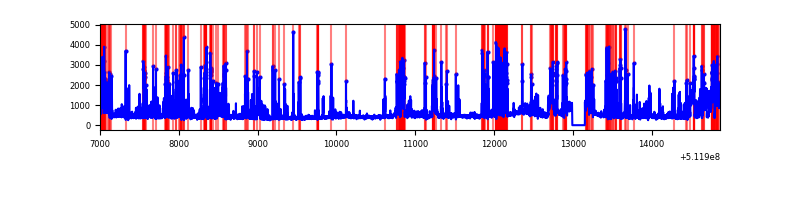 |
| D | 7870 | 7711 | 121 | 121 | 1.54% | 1.57% | 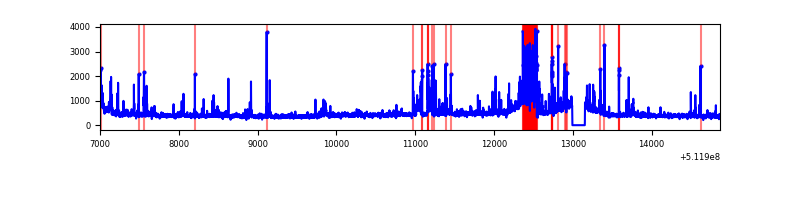 |
Top three noisy pixels from each quadrant. If the there are fewer than three noisy pixels in the level2.evt file, extra rows are filled as -1
| Pixel properties | Quadrant properties | ||||||
|---|---|---|---|---|---|---|---|
| Quadrant | DetID | PixID | Counts | Sigma | Mean | Median | Sigma |
| A | 3 | 62 | 1044595 | 5136.82 | 812 | 790 | 203.2 |
| A | 8 | 26 | 871807 | 4286.49 | 812 | 790 | 203.2 |
| A | 10 | 251 | 393299 | 1931.63 | 812 | 790 | 203.2 |
| B | 0 | 213 | 197920 | 1127.57 | 819 | 788 | 174.8 |
| B | 10 | 247 | 86112 | 488.04 | 819 | 788 | 174.8 |
| B | 0 | 63 | 75174 | 425.48 | 819 | 788 | 174.8 |
| C | 13 | 3 | 1684268 | 7752.31 | 781 | 771 | 217.2 |
| C | 12 | 249 | 158892 | 728.13 | 781 | 771 | 217.2 |
| C | 14 | 96 | 123391 | 564.65 | 781 | 771 | 217.2 |
| D | 2 | 249 | 667711 | 2919.61 | 798 | 763 | 228.4 |
| D | 13 | 153 | 65739 | 284.44 | 798 | 763 | 228.4 |
| D | 5 | 173 | 62234 | 269.09 | 798 | 763 | 228.4 |
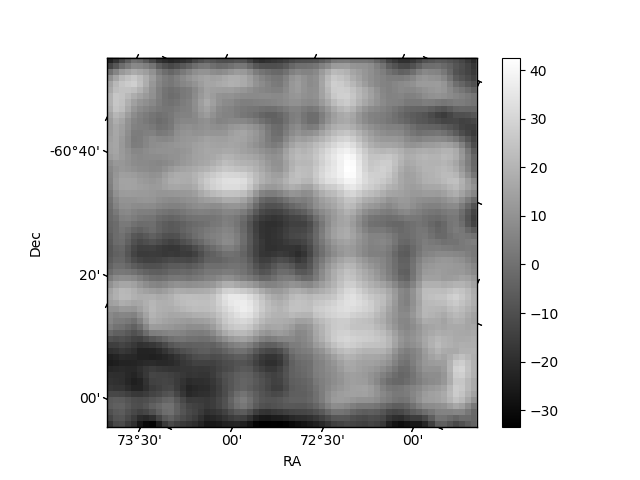
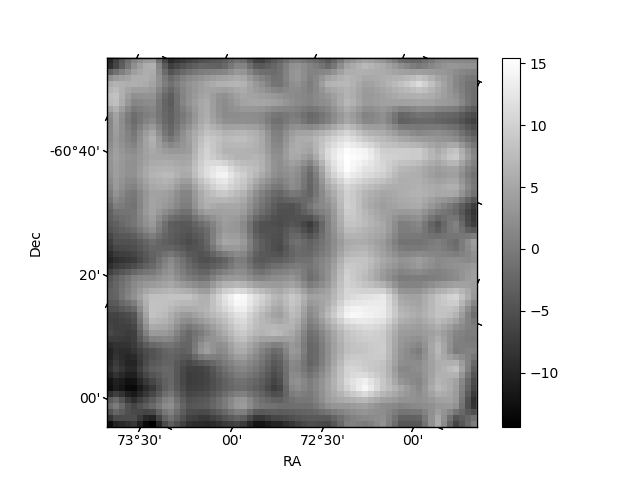
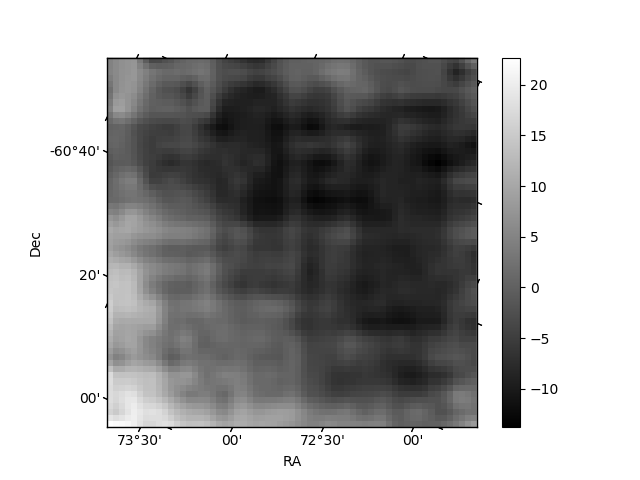
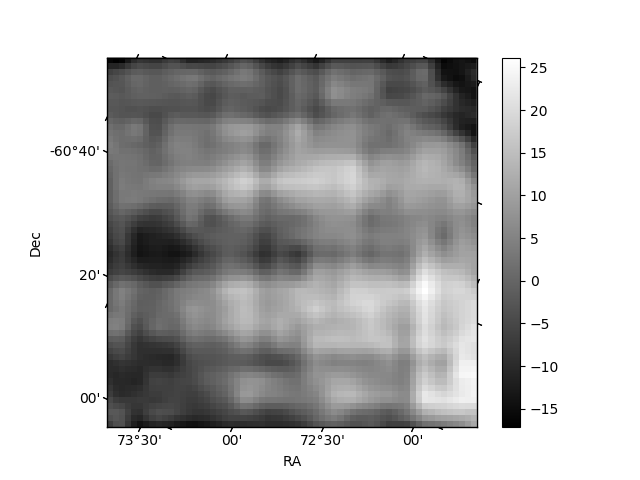
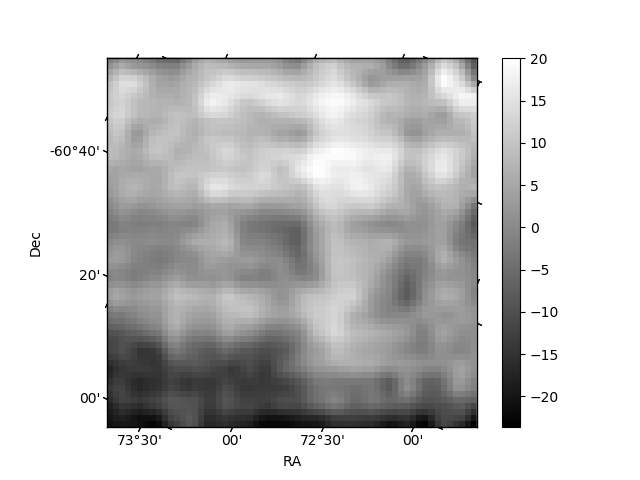
Histogram calculated using DETX and DETY for each event in the final _common_clean file
| Quadrant A | 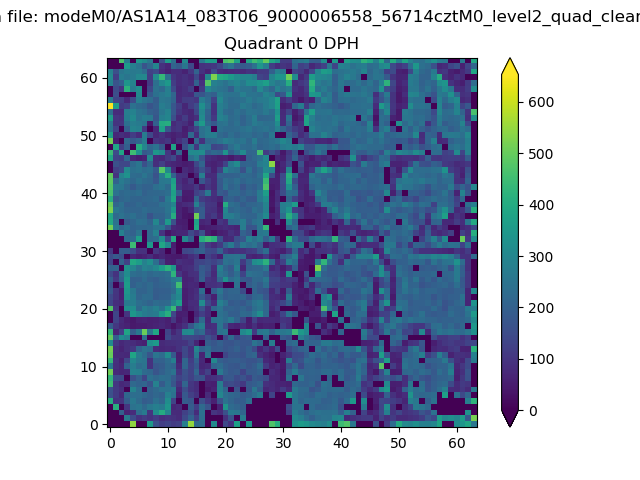 |
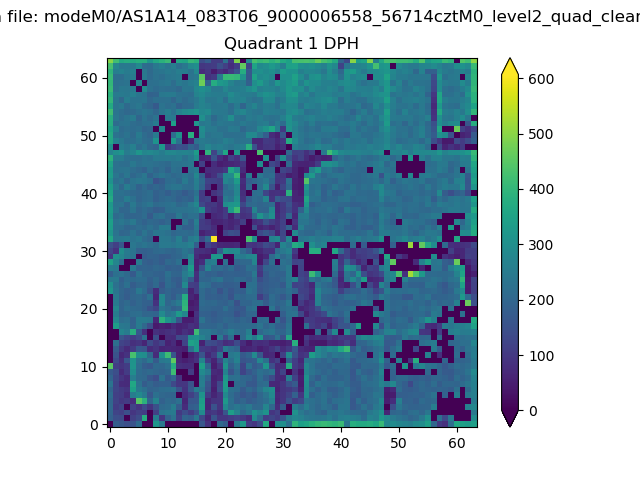 |
Quadrant B |
|---|---|---|---|
| Quadrant D | 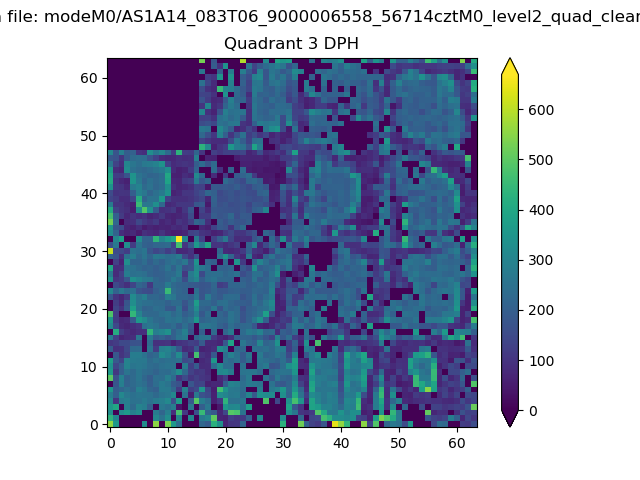 |
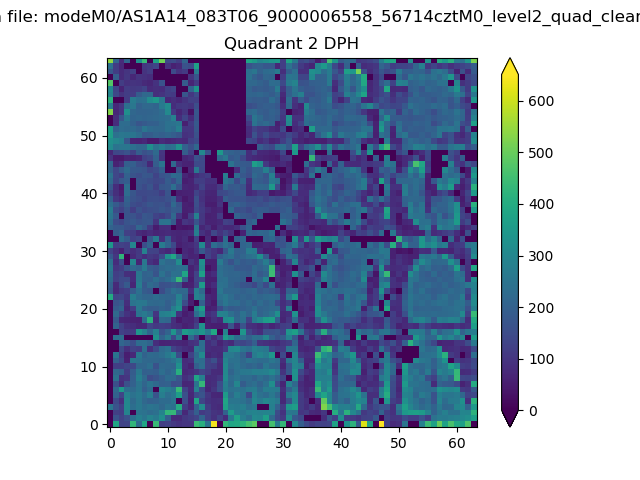 |
Quadrant C |
| Plot type | Count rate plots | Images |
|---|---|---|
| Comparison with Poisson distribution Blue bars denote a histogram of data divided into 1 sec bins. Red curve is a Poisson curve with rate = median count rate of data. |
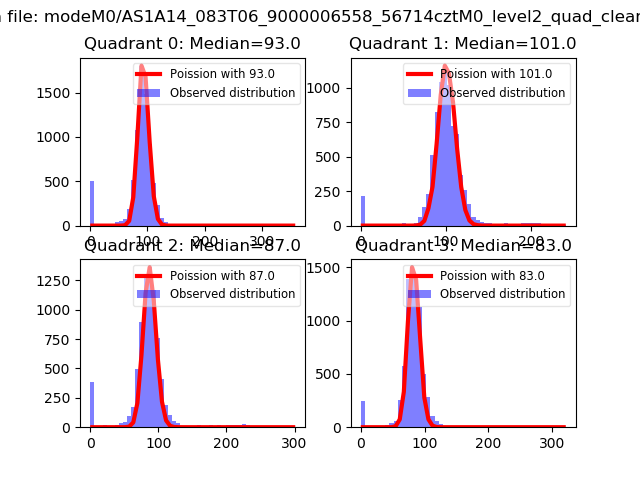 |
 |
| Quadrant-wise count rates Data is divided into 100 sec bins |
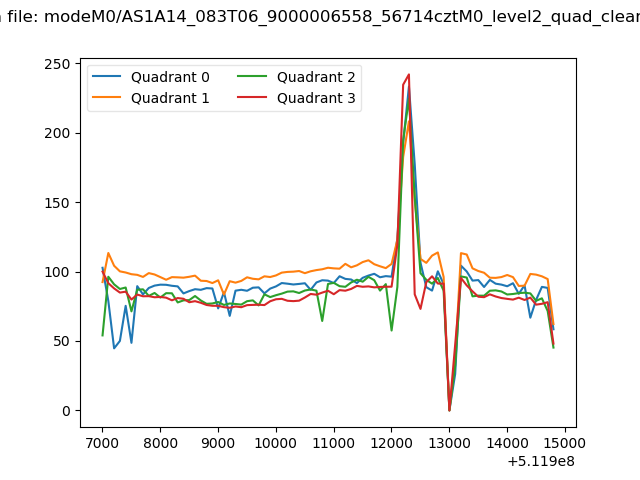 |
|
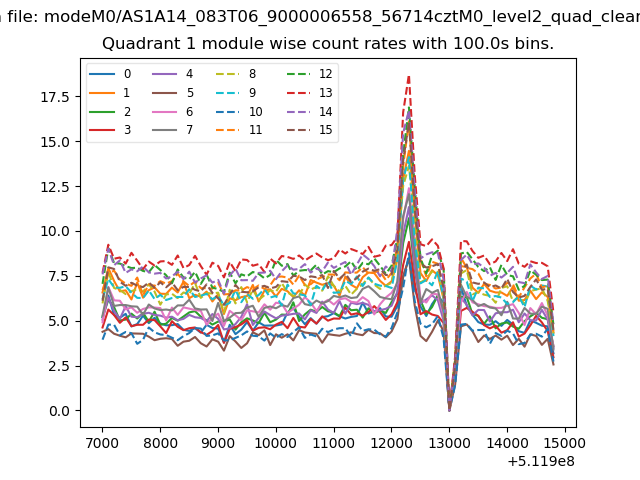
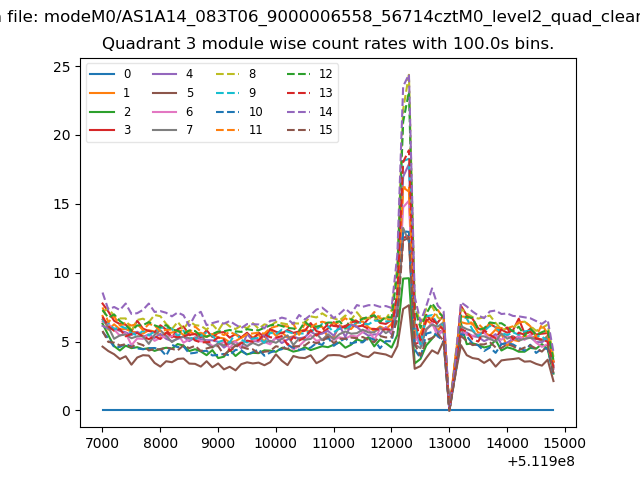
| Module-wise count rates for Quadrant A Data is divided into 100 sec bins |
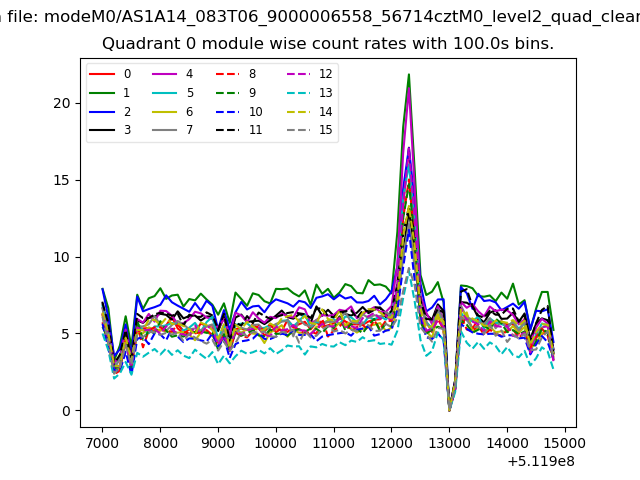 |
 |
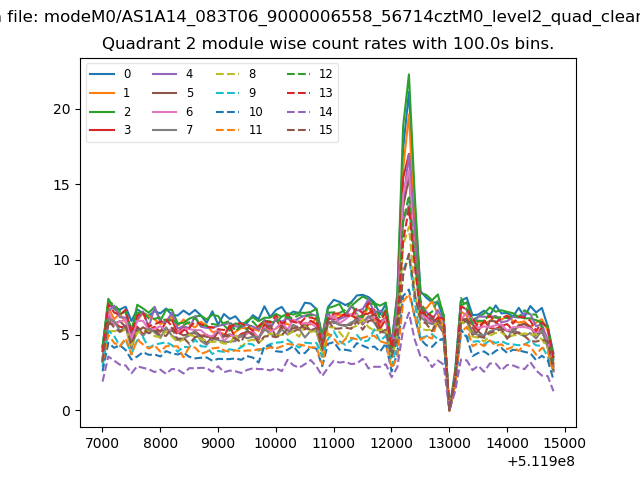
| Module-wise count rates for Quadrant B Data is divided into 100 sec bins |
 |
 |
| Module-wise count rates for Quadrant C Data is divided into 100 sec bins |
 |
 |
| Module-wise count rates for Quadrant D Data is divided into 100 sec bins |
 |
 |
| Parameter | Plot |
|---|---|
| CZT HV Monitor | 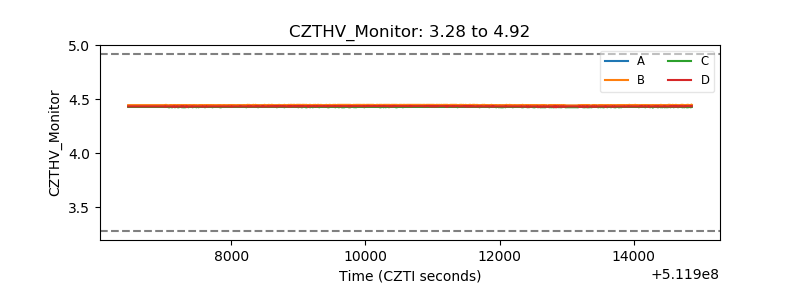 |
| D_VDD | 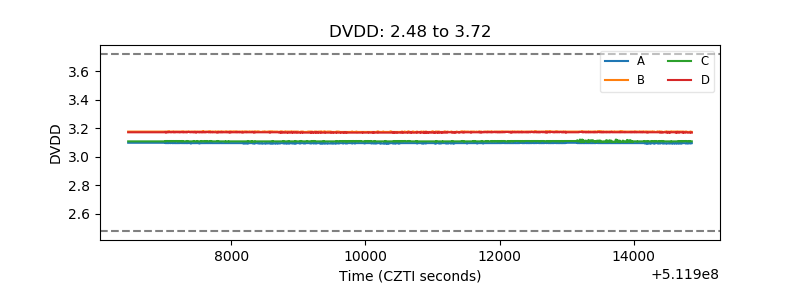 |
| Temperature 1 | 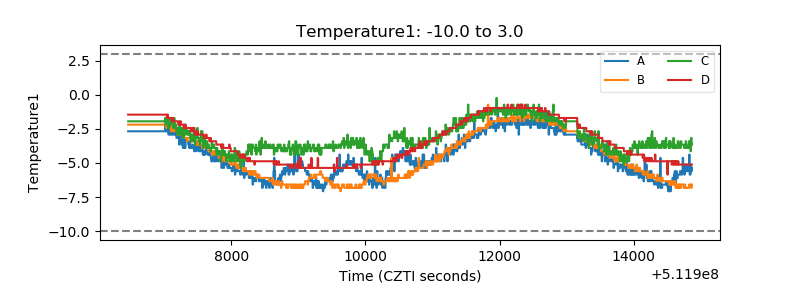 |
| Veto HV Monitor |  |
| Veto LLD | 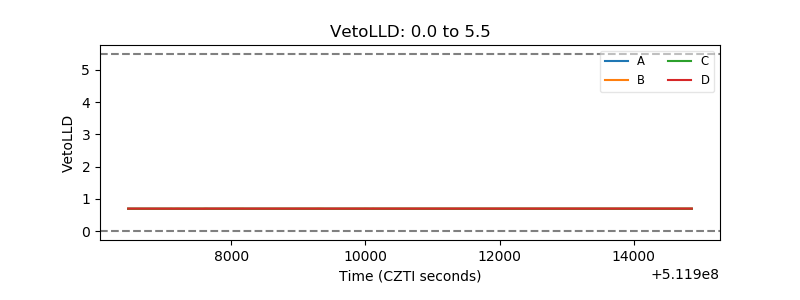 |
| Alpha Counter | 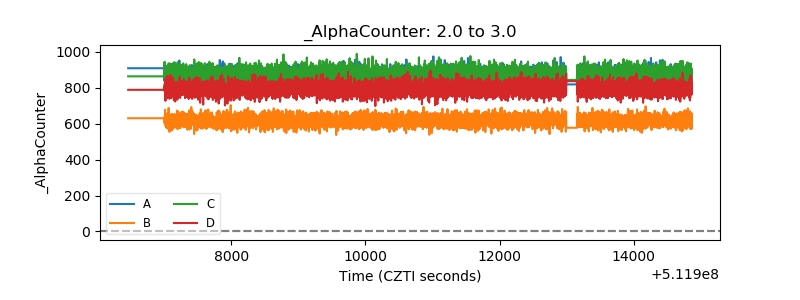 |
| _CPM_Rate | 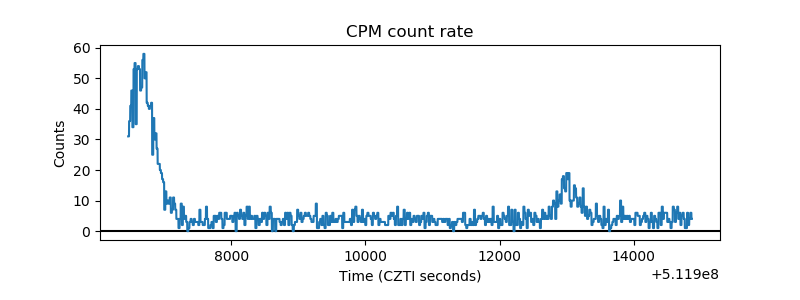 |
| CZT Counter | 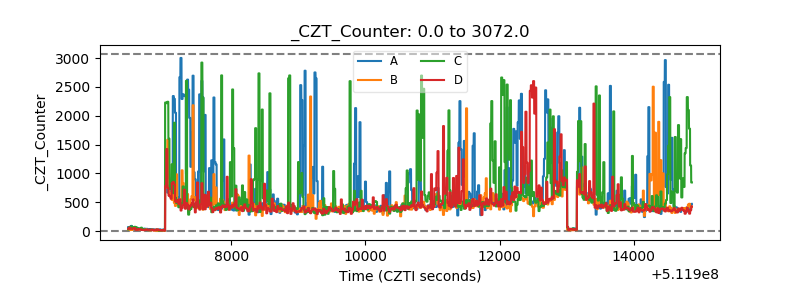 |
| +2.5 Volts monitor |  |
| +5 Volts monitor |  |
| _ROLL_ROT | 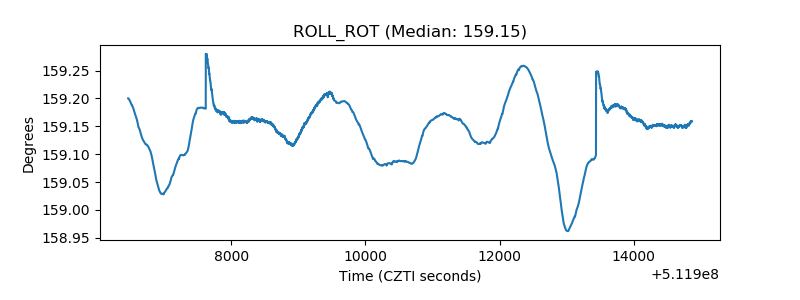 |
| _Roll_DEC | 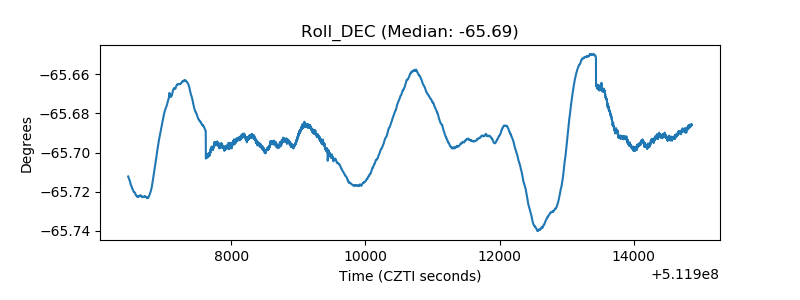 |
| _Roll_RA | 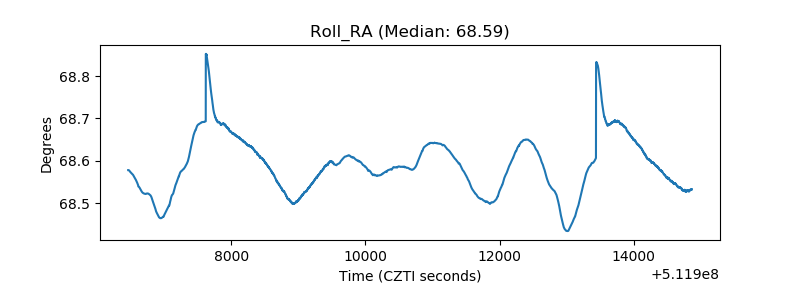 |
| Veto Counter | 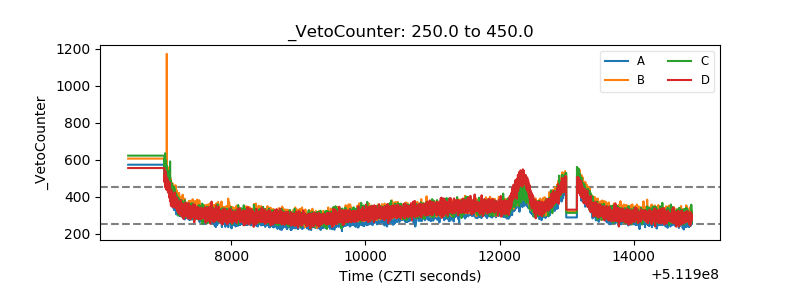 |