| Param | Original file | Final file |
|---|---|---|
| Filename | modeM0/AS1A14_083T06_9000006558_56722cztM0_level2.fits | modeM0/AS1A14_083T06_9000006558_56722cztM0_level2_quad_clean.evt |
| Size (bytes) | 828,204,480 | 165,015,360 |
| Size | 789.8 MB | 157.4 MB |
| Events in quadrant A | 7,709,019 | 1,084,892 |
| Events in quadrant B | 5,440,690 | 1,180,429 |
| Events in quadrant C | 10,314,557 | 924,256 |
| Events in quadrant D | 6,266,025 | 979,993 |
| Mode SS | |||
|---|---|---|---|
| Quadrant | BADHDUFLAG | Total packets | Discarded packets |
| A | 0 | 238 | 0 |
| B | 0 | 238 | 0 |
| C | 0 | 238 | 0 |
| D | 0 | 238 | 0 |
| Mode M0 | |||
|---|---|---|---|
| Quadrant | BADHDUFLAG | Total packets | Discarded packets |
| A | 0 | 31070 | 6 |
| B | 0 | 25319 | 2 |
| C | 0 | 39204 | 4 |
| D | 0 | 27461 | 2 |
| Quadrant | Total seconds | Saturated seconds | Saturation percentage |
|---|---|---|---|
| A | 11951 | 622 | 5.204585% |
| B | 11952 | 307 | 2.568608% |
| C | 11951 | 1783 | 14.919254% |
| D | 11952 | 352 | 2.945114% |
Noise dominated data is calculated using 1-second bins in cleaned event files. If a bin has >2000 counts, and if more than 50% of those come from <1% of pixels, then it is considered to be noise-dominated and hence unusable.
| Quadrant | # 1 sec bins | Bins with >0 counts | Bins with >2000 counts | High rate bins dominated by noise | Noise dominated (total time) | Noise dominated (detector-on time) | Marked lightcurve |
|---|---|---|---|---|---|---|---|
| A | 11982 | 11954 | 294 | 294 | 2.45% | 2.46% | 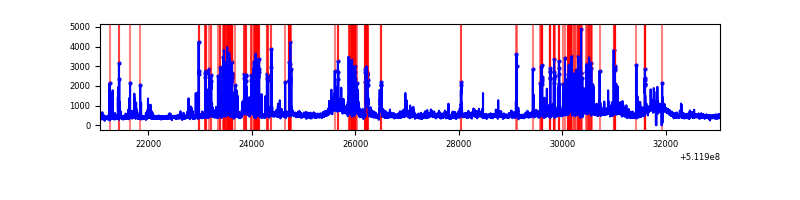 |
| B | 11982 | 11954 | 27 | 27 | 0.23% | 0.23% | 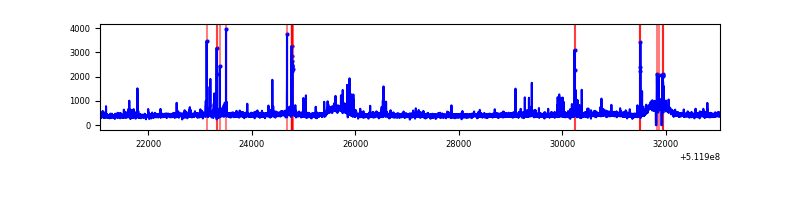 |
| C | 11981 | 11952 | 1397 | 1397 | 11.66% | 11.69% | 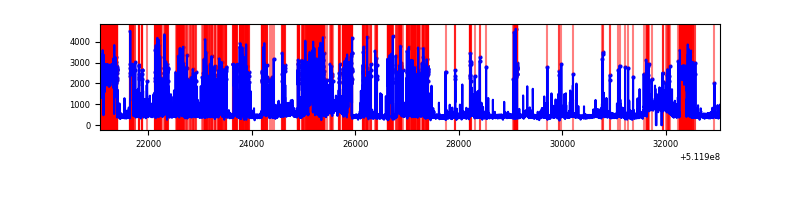 |
| D | 11982 | 11953 | 174 | 174 | 1.45% | 1.46% | 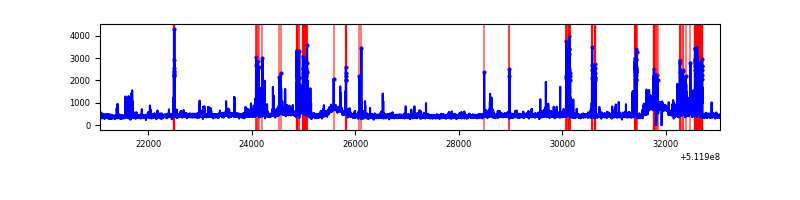 |
Top three noisy pixels from each quadrant. If the there are fewer than three noisy pixels in the level2.evt file, extra rows are filled as -1
| Pixel properties | Quadrant properties | ||||||
|---|---|---|---|---|---|---|---|
| Quadrant | DetID | PixID | Counts | Sigma | Mean | Median | Sigma |
| A | 3 | 14 | 875370 | 2754.03 | 1284 | 1248 | 317.4 |
| A | 3 | 62 | 818904 | 2576.12 | 1284 | 1248 | 317.4 |
| A | 8 | 26 | 535552 | 1683.39 | 1284 | 1248 | 317.4 |
| B | 10 | 247 | 165548 | 594.44 | 1282 | 1231 | 276.4 |
| B | 10 | 16 | 77483 | 275.85 | 1282 | 1231 | 276.4 |
| B | 12 | 111 | 33893 | 118.16 | 1282 | 1231 | 276.4 |
| C | 13 | 3 | 3639846 | 11357.96 | 1189 | 1179 | 320.4 |
| C | 9 | 38 | 935176 | 2915.44 | 1189 | 1179 | 320.4 |
| C | 14 | 96 | 392255 | 1220.73 | 1189 | 1179 | 320.4 |
| D | 2 | 249 | 444138 | 1277.3 | 1254 | 1198 | 346.8 |
| D | 11 | 247 | 295891 | 849.8 | 1254 | 1198 | 346.8 |
| D | 3 | 12 | 112130 | 319.89 | 1254 | 1198 | 346.8 |
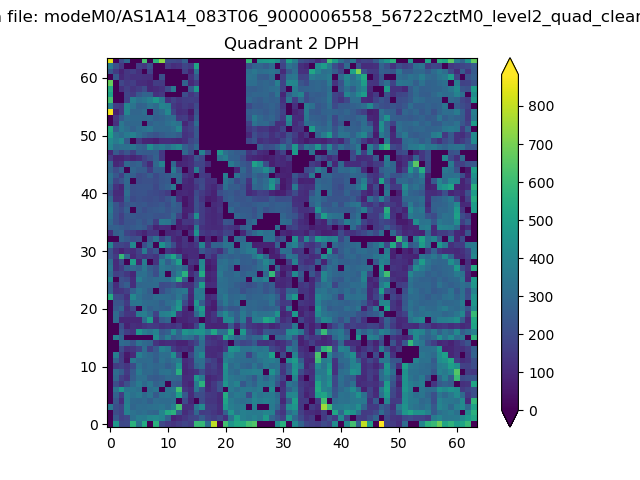
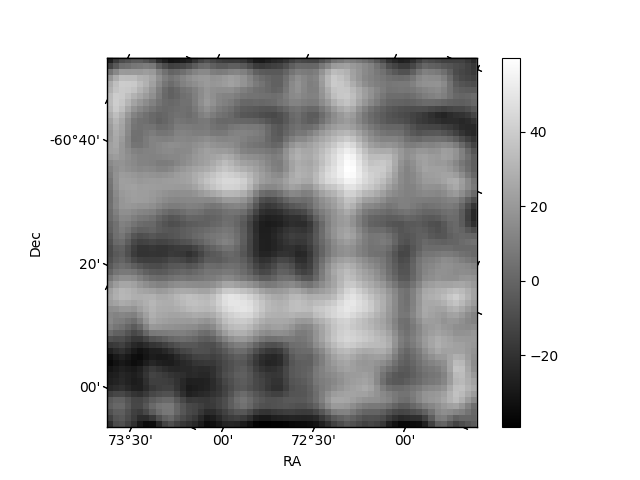
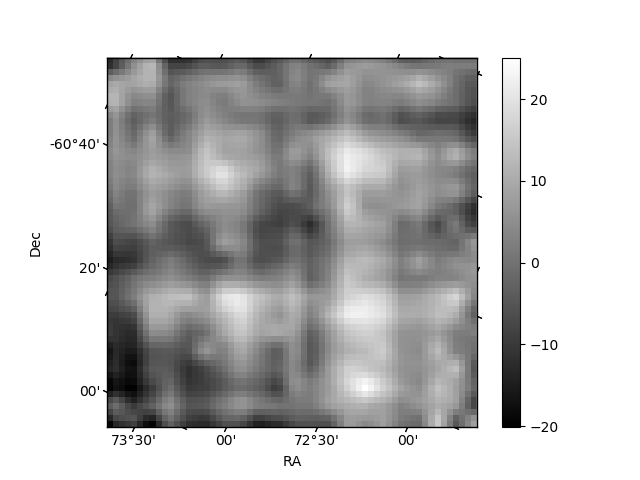
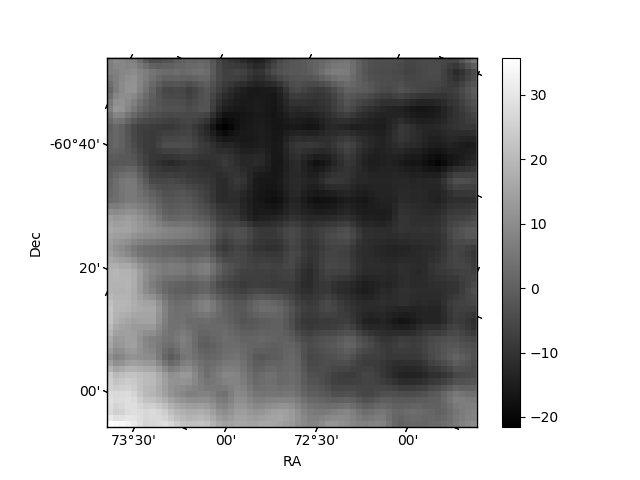
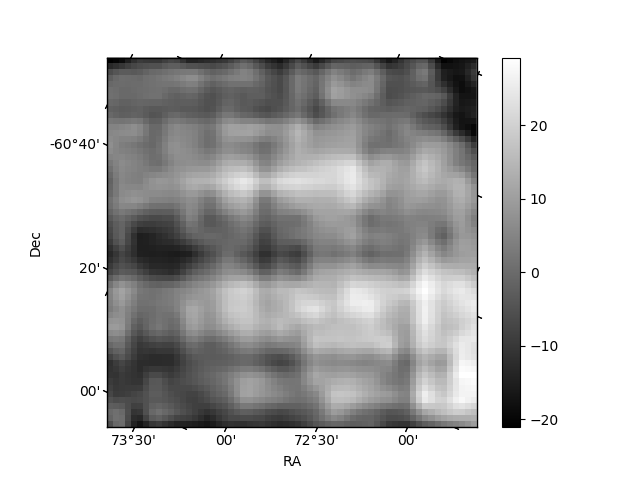
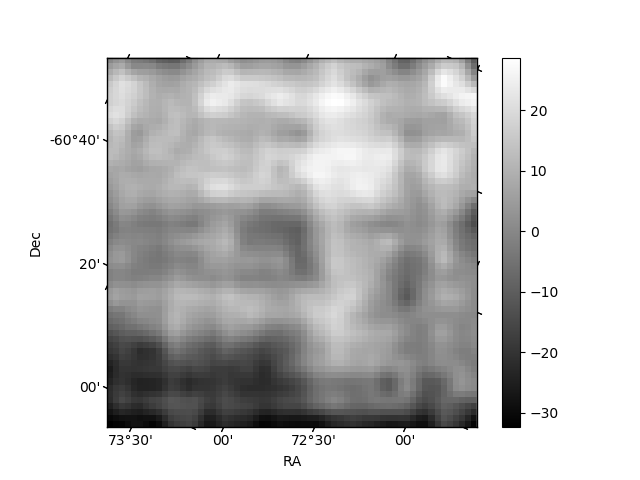
Histogram calculated using DETX and DETY for each event in the final _common_clean file
| Quadrant A | 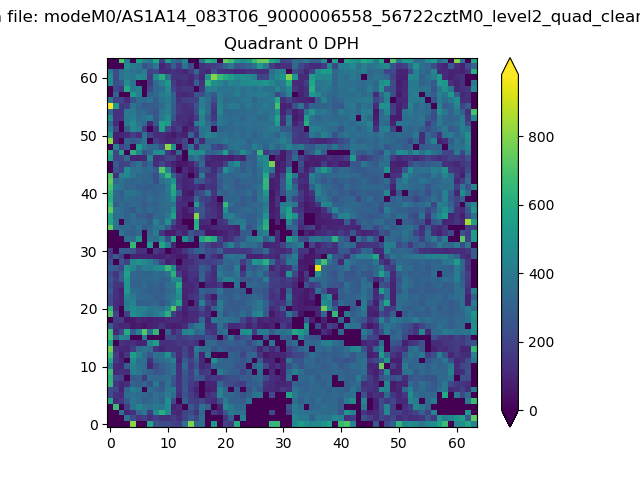 |
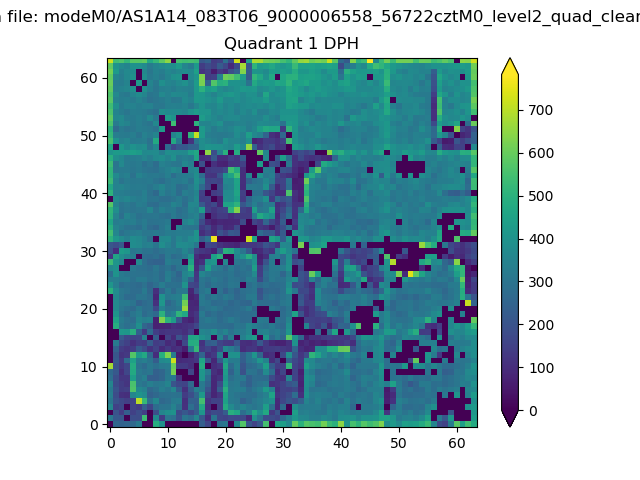 |
Quadrant B |
|---|---|---|---|
| Quadrant D | 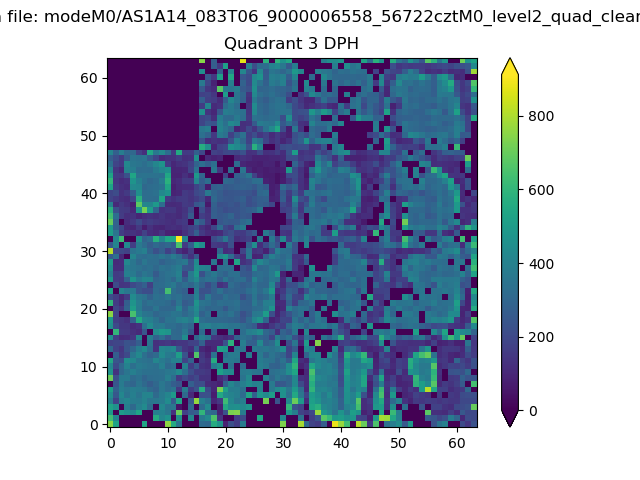 |
 |
Quadrant C |
| Plot type | Count rate plots | Images |
|---|---|---|
| Comparison with Poisson distribution Blue bars denote a histogram of data divided into 1 sec bins. Red curve is a Poisson curve with rate = median count rate of data. |
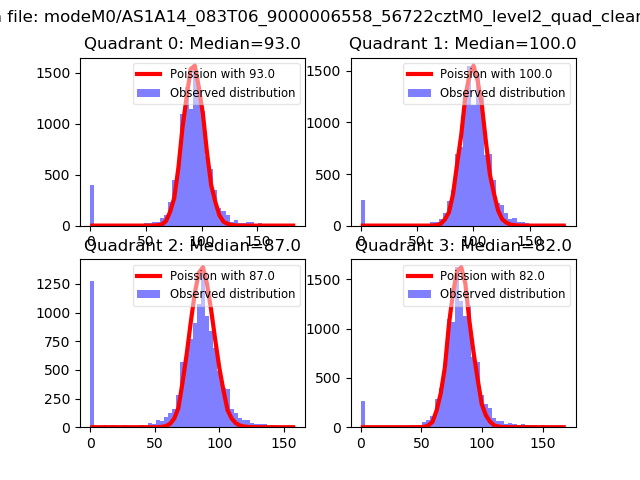 |
 |
| Quadrant-wise count rates Data is divided into 100 sec bins |
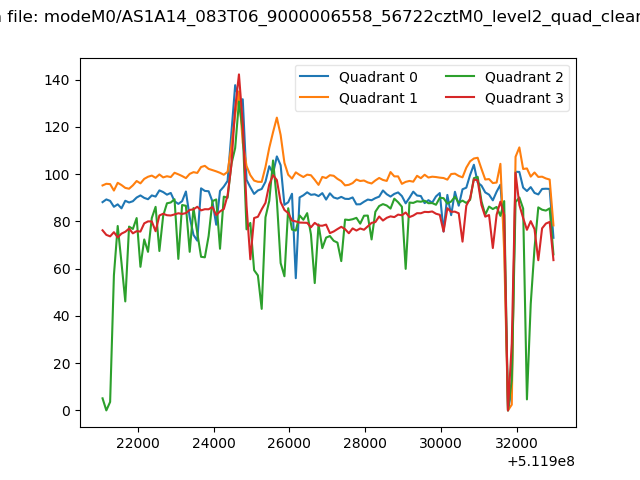 |
|
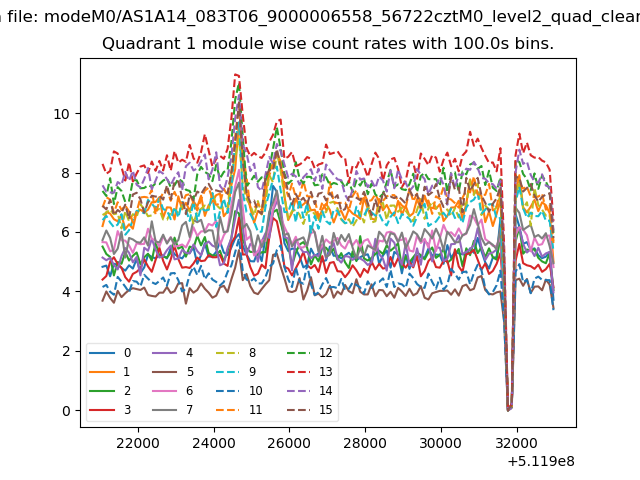
| Module-wise count rates for Quadrant A Data is divided into 100 sec bins |
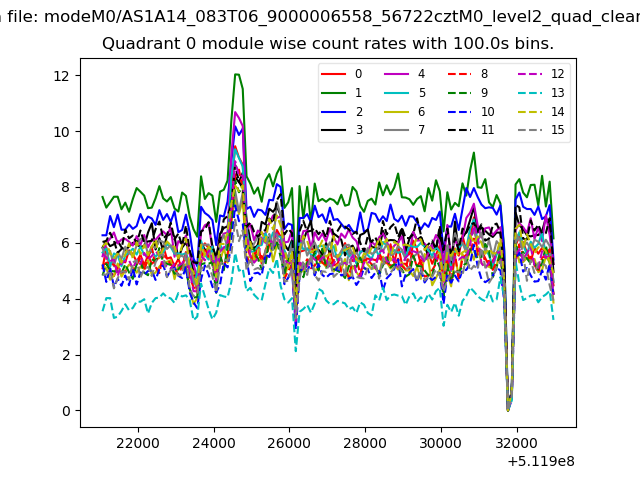 |
 |
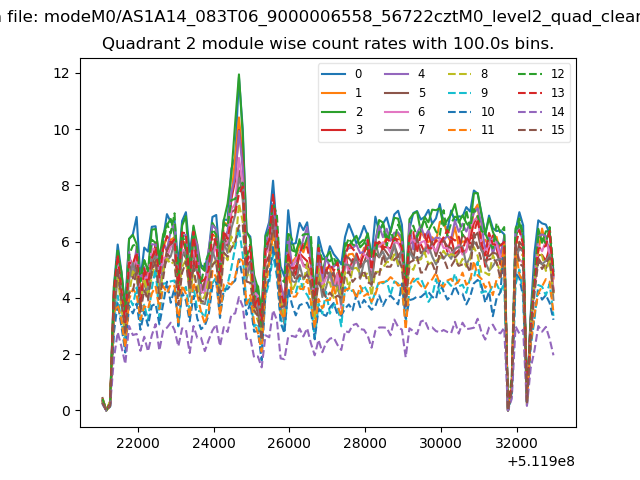
| Module-wise count rates for Quadrant B Data is divided into 100 sec bins |
 |
 |
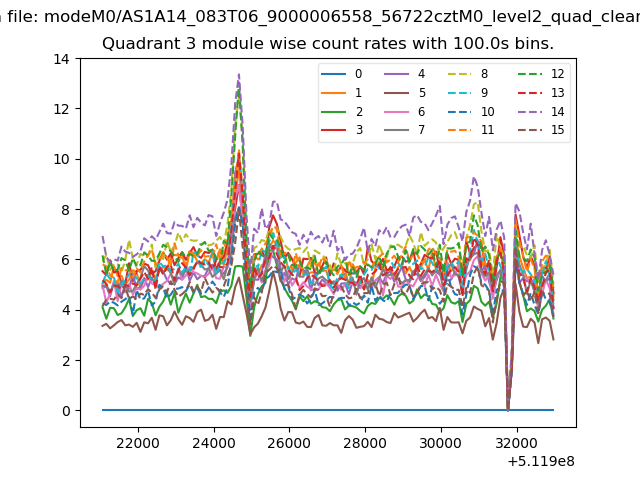
| Module-wise count rates for Quadrant C Data is divided into 100 sec bins |
 |
 |
| Module-wise count rates for Quadrant D Data is divided into 100 sec bins |
 |
 |
| Parameter | Plot |
|---|---|
| CZT HV Monitor | 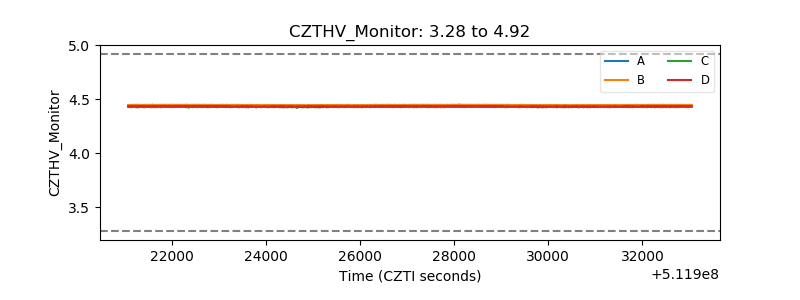 |
| D_VDD | 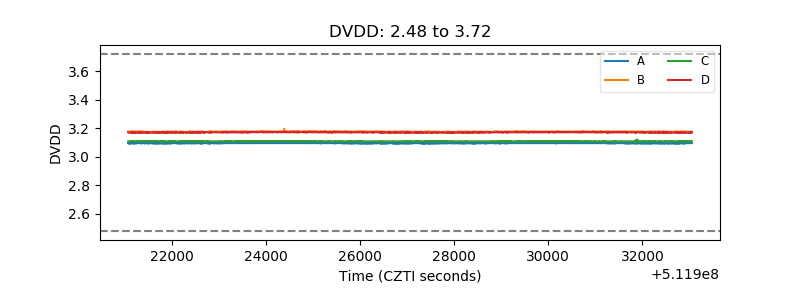 |
| Temperature 1 | 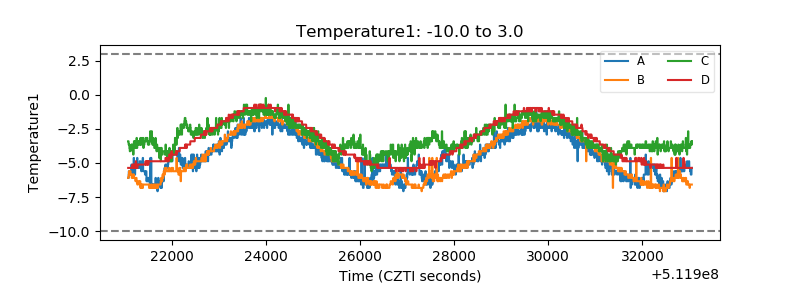 |
| Veto HV Monitor | 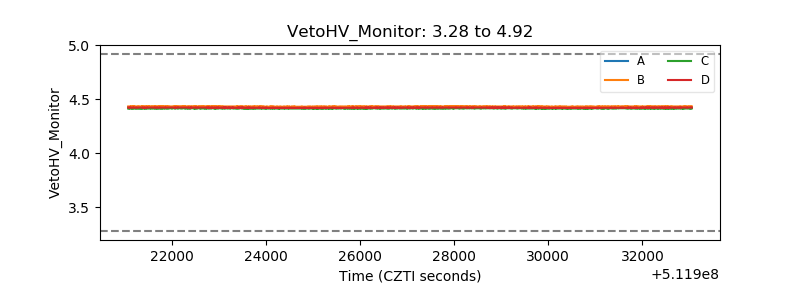 |
| Veto LLD | 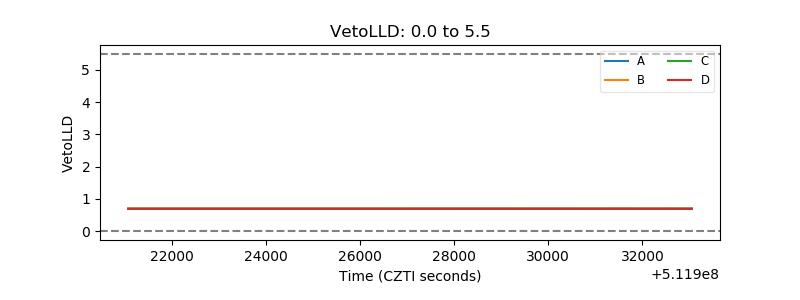 |
| Alpha Counter | 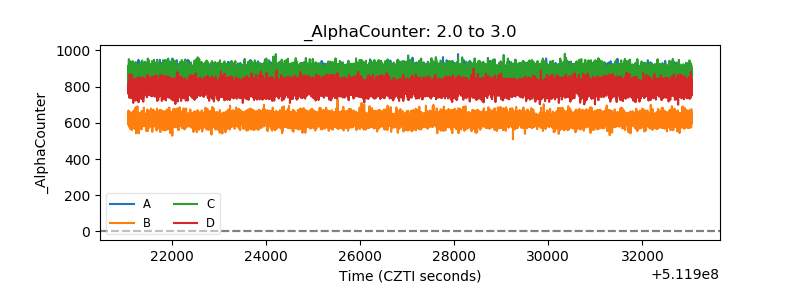 |
| _CPM_Rate | 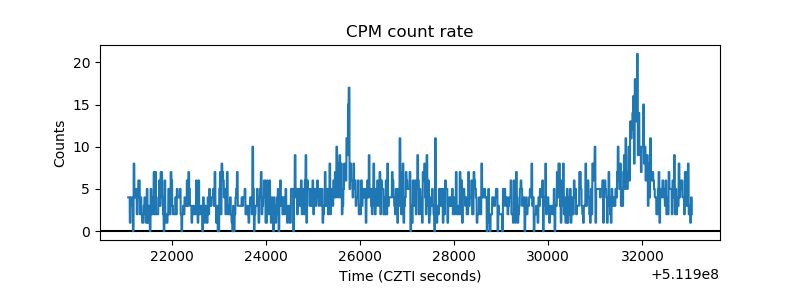 |
| CZT Counter | 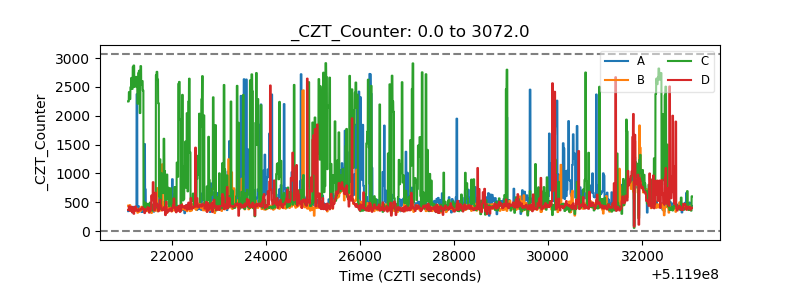 |
| +2.5 Volts monitor |  |
| +5 Volts monitor |  |
| _ROLL_ROT | 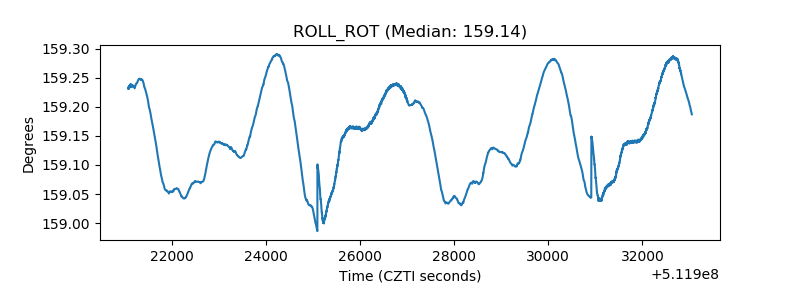 |
| _Roll_DEC | 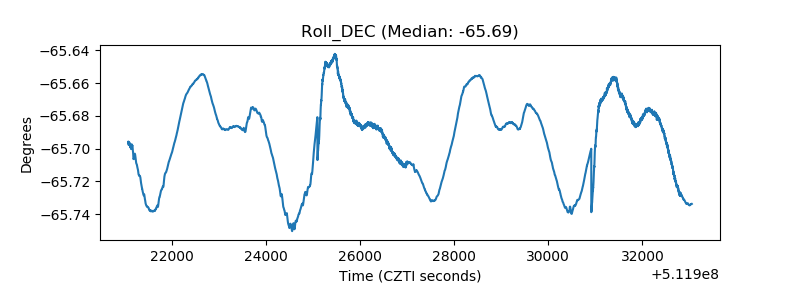 |
| _Roll_RA | 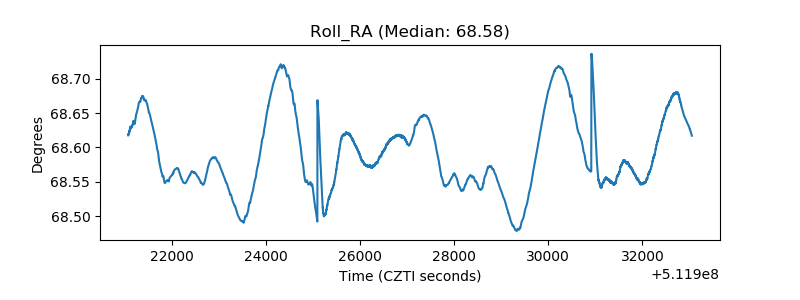 |
| Veto Counter | 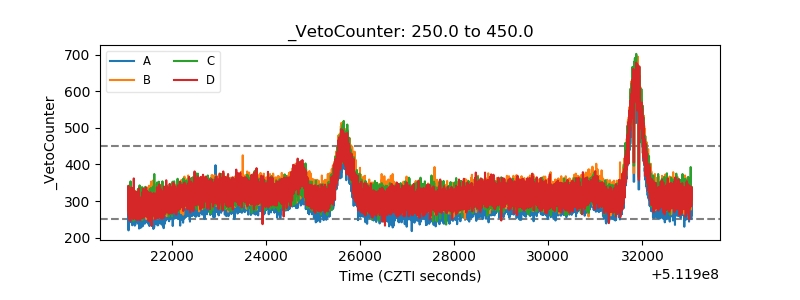 |