| Param | Original file | Final file |
|---|---|---|
| Filename | modeM0/AS1A14_083T05_9000006560_56722cztM0_level2.fits | modeM0/AS1A14_083T05_9000006560_56722cztM0_level2_quad_clean.evt |
| Size (bytes) | 412,545,600 | 97,182,720 |
| Size | 393.4 MB | 92.7 MB |
| Events in quadrant A | 4,016,796 | 625,732 |
| Events in quadrant B | 3,155,889 | 685,156 |
| Events in quadrant C | 4,410,231 | 593,144 |
| Events in quadrant D | 3,176,383 | 579,834 |
| Mode SS | |||
|---|---|---|---|
| Quadrant | BADHDUFLAG | Total packets | Discarded packets |
| A | 0 | 134 | 0 |
| B | 0 | 134 | 0 |
| C | 0 | 134 | 0 |
| D | 0 | 134 | 0 |
| Mode M0 | |||
|---|---|---|---|
| Quadrant | BADHDUFLAG | Total packets | Discarded packets |
| A | 0 | 16370 | 1 |
| B | 0 | 14046 | 1 |
| C | 0 | 17835 | 1 |
| D | 0 | 14060 | 1 |
| Mode M9 | |||
|---|---|---|---|
| Quadrant | BADHDUFLAG | Total packets | Discarded packets |
| A | 0 | 9 | 0 |
| B | 0 | 9 | 0 |
| C | 0 | 9 | 0 |
| D | 0 | 9 | 0 |
| Quadrant | Total seconds | Saturated seconds | Saturation percentage |
|---|---|---|---|
| A | 6578 | 254 | 3.861356% |
| B | 6578 | 92 | 1.398601% |
| C | 6579 | 306 | 4.651163% |
| D | 6579 | 66 | 1.003192% |
Noise dominated data is calculated using 1-second bins in cleaned event files. If a bin has >2000 counts, and if more than 50% of those come from <1% of pixels, then it is considered to be noise-dominated and hence unusable.
| Quadrant | # 1 sec bins | Bins with >0 counts | Bins with >2000 counts | High rate bins dominated by noise | Noise dominated (total time) | Noise dominated (detector-on time) | Marked lightcurve |
|---|---|---|---|---|---|---|---|
| A | 7518 | 6578 | 175 | 175 | 2.33% | 2.66% | 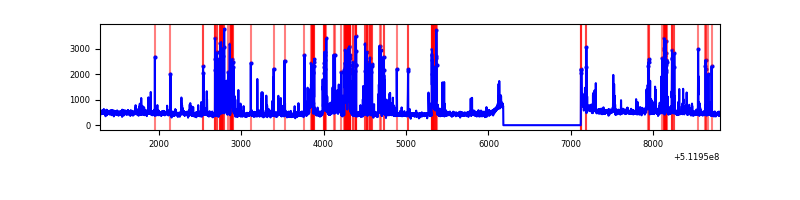 |
| B | 7518 | 6578 | 25 | 25 | 0.33% | 0.38% | 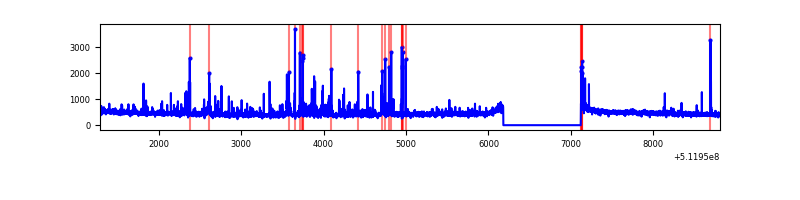 |
| C | 7519 | 6579 | 281 | 281 | 3.74% | 4.27% | 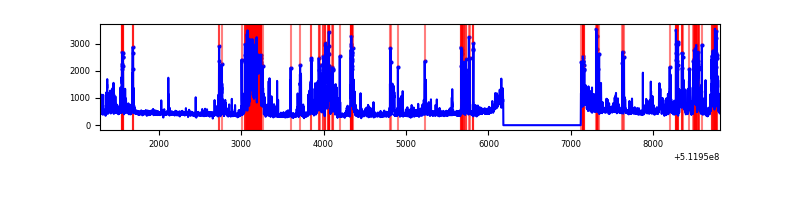 |
| D | 7519 | 6579 | 15 | 15 | 0.20% | 0.23% | 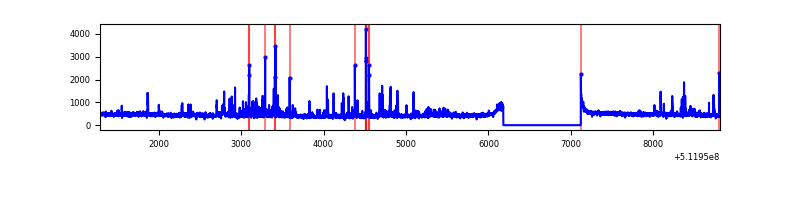 |
Top three noisy pixels from each quadrant. If the there are fewer than three noisy pixels in the level2.evt file, extra rows are filled as -1
| Pixel properties | Quadrant properties | ||||||
|---|---|---|---|---|---|---|---|
| Quadrant | DetID | PixID | Counts | Sigma | Mean | Median | Sigma |
| A | 10 | 251 | 764417 | 4315.12 | 714 | 696 | 177.0 |
| A | 3 | 62 | 280564 | 1581.29 | 714 | 696 | 177.0 |
| A | 3 | 14 | 156519 | 880.42 | 714 | 696 | 177.0 |
| B | 2 | 249 | 97807 | 640.25 | 706 | 682 | 151.7 |
| B | 10 | 247 | 50698 | 329.71 | 706 | 682 | 151.7 |
| B | 0 | 245 | 44367 | 287.97 | 706 | 682 | 151.7 |
| C | 15 | 230 | 1208665 | 6359.9 | 686 | 680 | 189.9 |
| C | 13 | 3 | 290868 | 1527.81 | 686 | 680 | 189.9 |
| C | 12 | 252 | 55639 | 289.35 | 686 | 680 | 189.9 |
| D | 2 | 249 | 116236 | 581.46 | 701 | 670 | 198.8 |
| D | 2 | 252 | 91989 | 459.46 | 701 | 670 | 198.8 |
| D | 2 | 207 | 59752 | 297.26 | 701 | 670 | 198.8 |
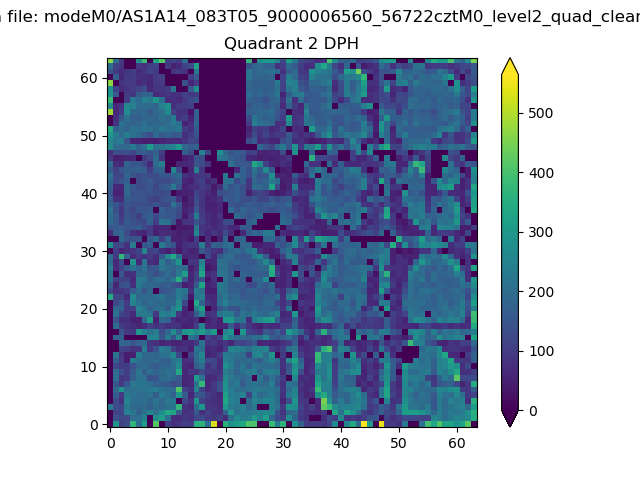
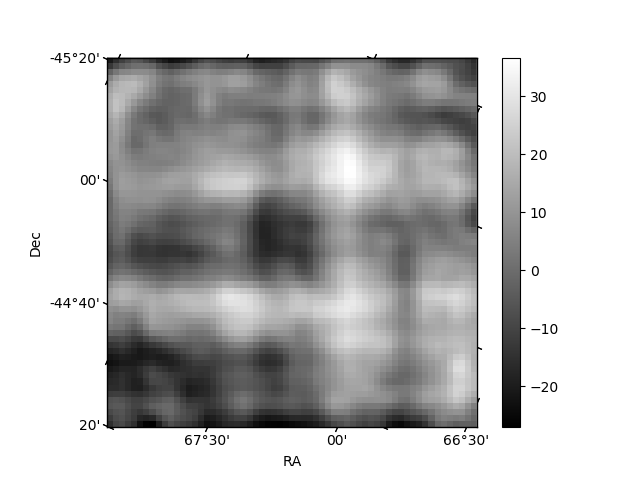
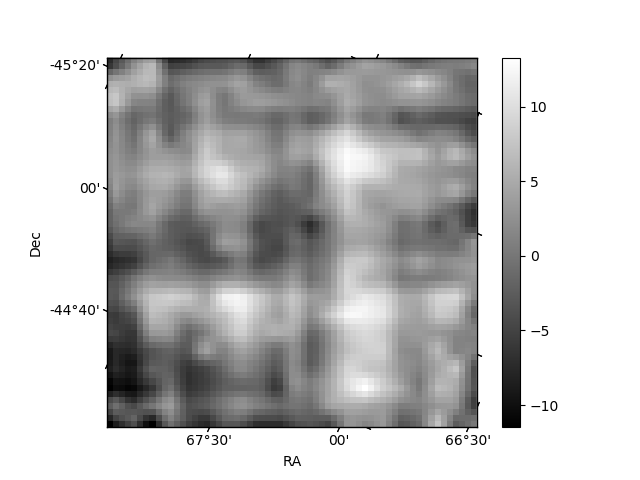
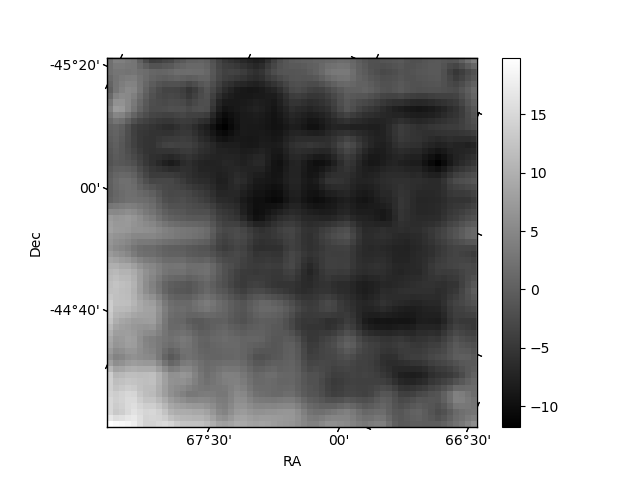
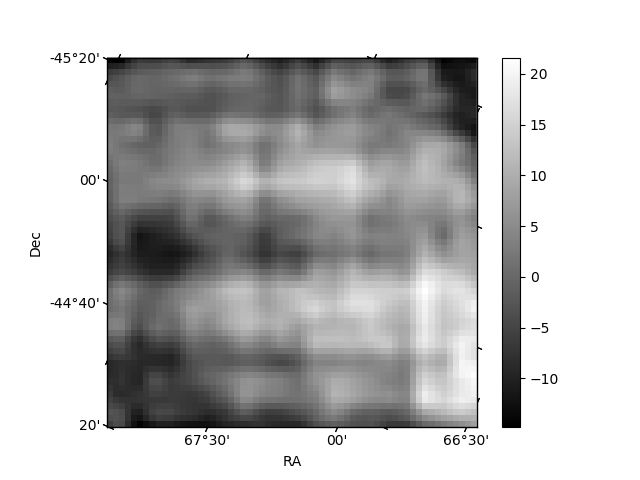
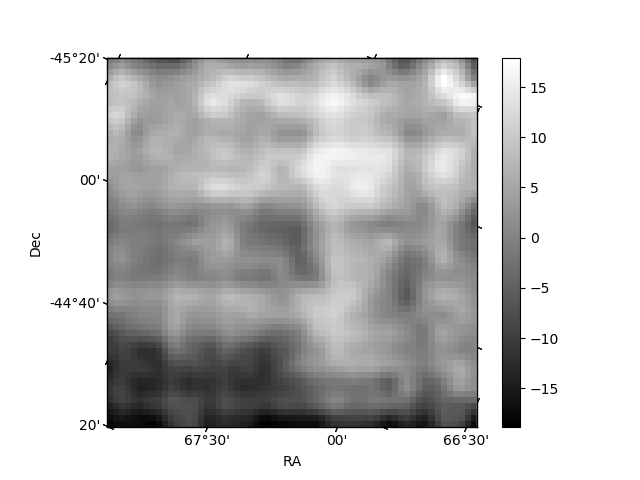
Histogram calculated using DETX and DETY for each event in the final _common_clean file
| Quadrant A | 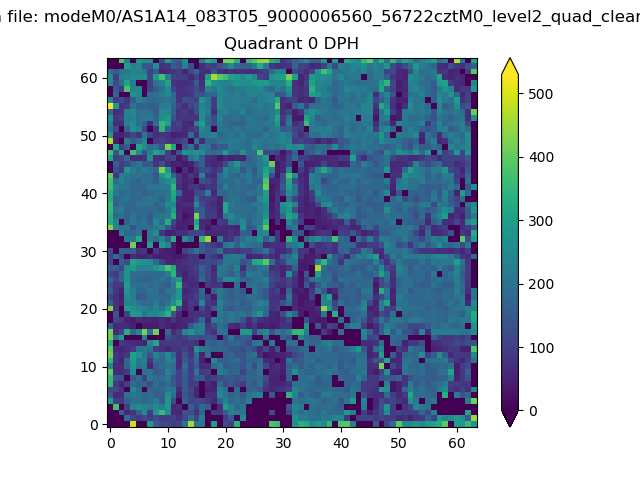 |
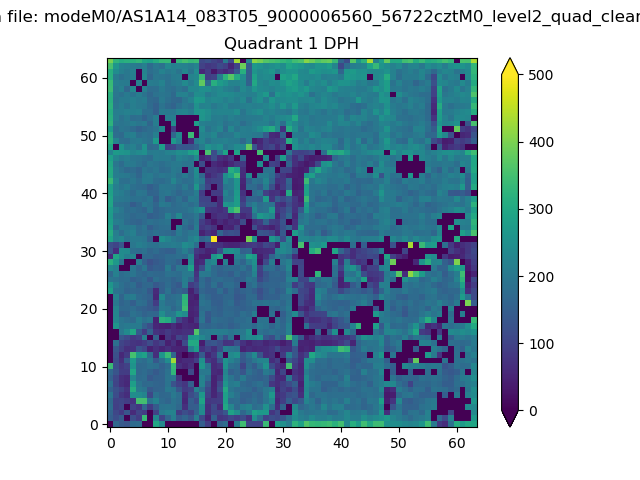 |
Quadrant B |
|---|---|---|---|
| Quadrant D | 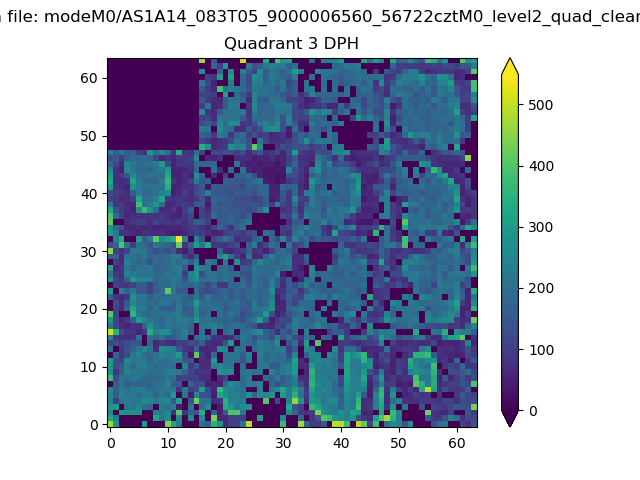 |
 |
Quadrant C |
| Plot type | Count rate plots | Images |
|---|---|---|
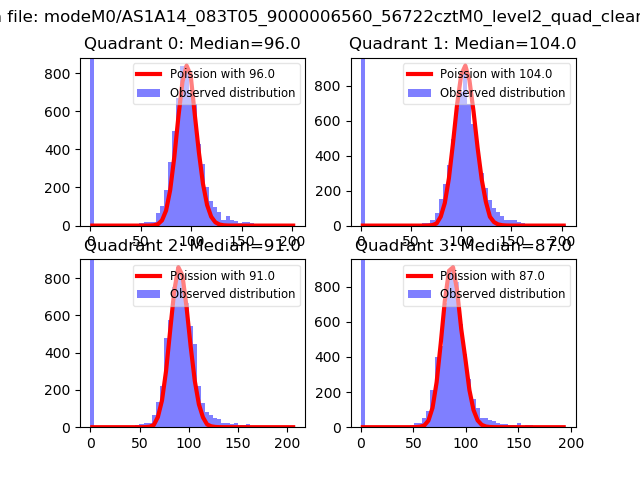
| Comparison with Poisson distribution Blue bars denote a histogram of data divided into 1 sec bins. Red curve is a Poisson curve with rate = median count rate of data. |
 |
 |
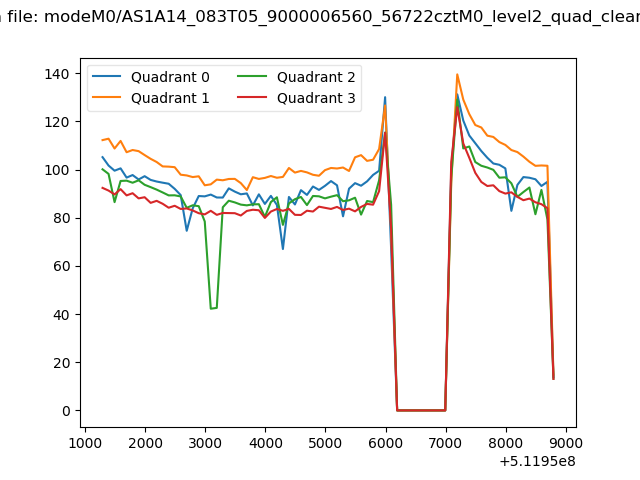
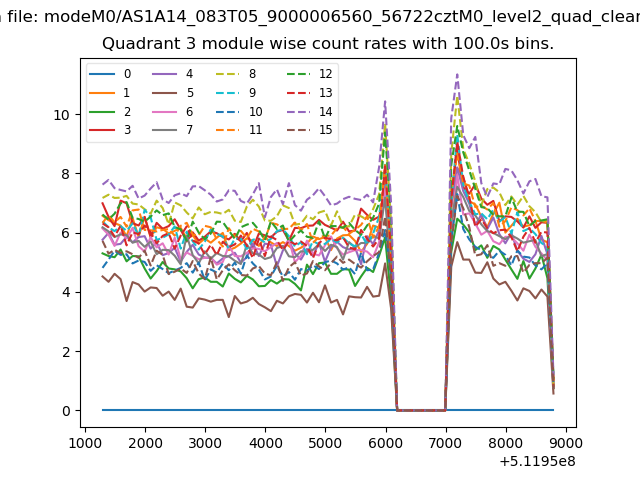
| Quadrant-wise count rates Data is divided into 100 sec bins |
 |
|
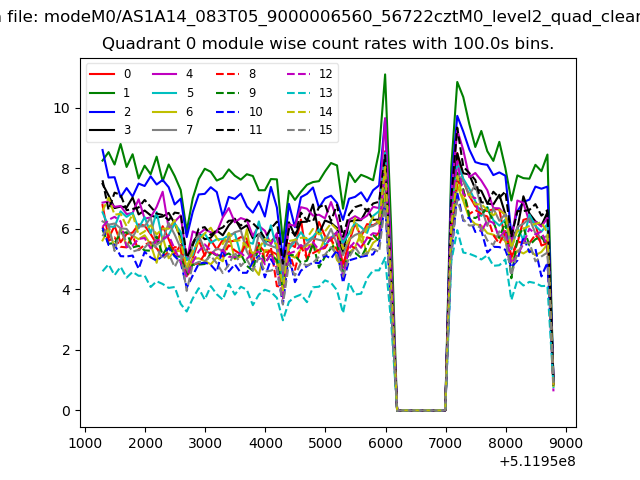
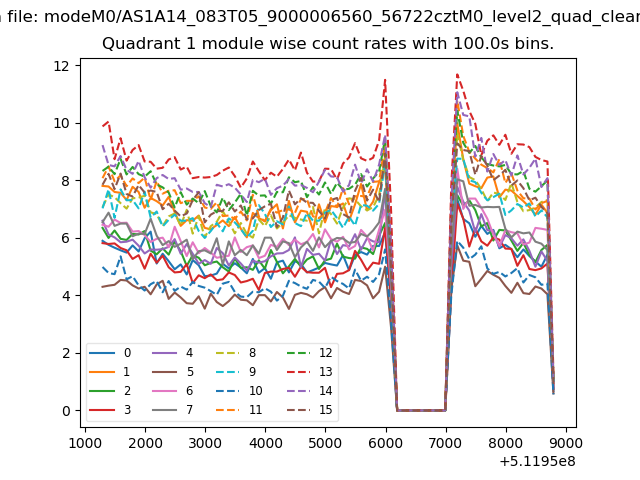
| Module-wise count rates for Quadrant A Data is divided into 100 sec bins |
 |
 |
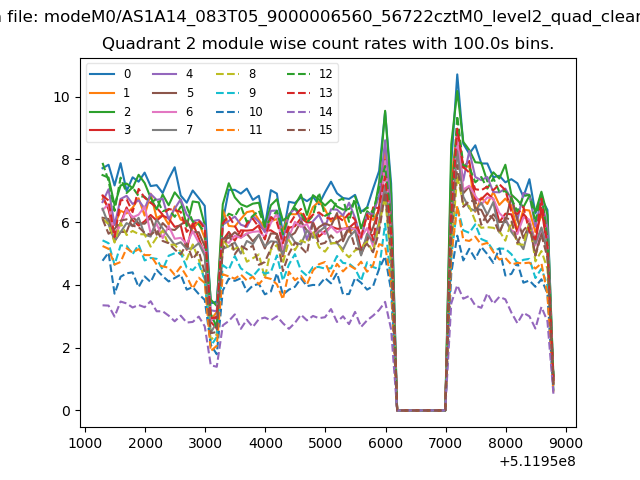
| Module-wise count rates for Quadrant B Data is divided into 100 sec bins |
 |
 |
| Module-wise count rates for Quadrant C Data is divided into 100 sec bins |
 |
 |
| Module-wise count rates for Quadrant D Data is divided into 100 sec bins |
 |
 |
| Parameter | Plot |
|---|---|
| CZT HV Monitor |  |
| D_VDD | 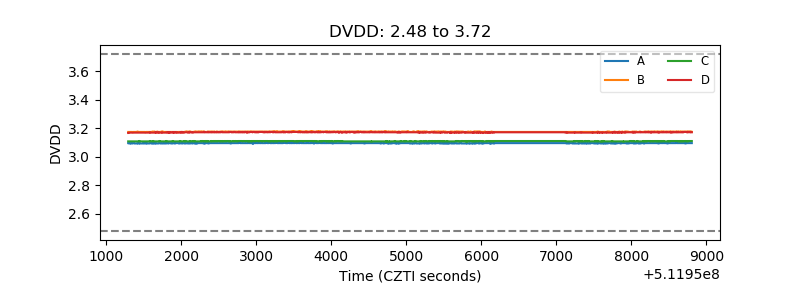 |
| Temperature 1 | 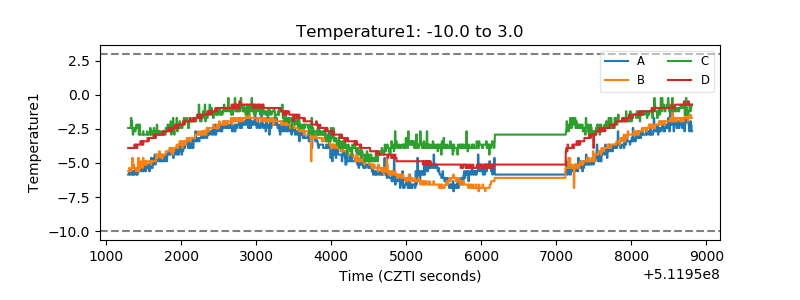 |
| Veto HV Monitor | 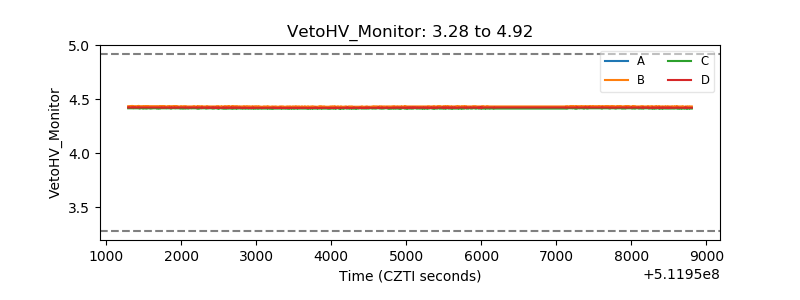 |
| Veto LLD | 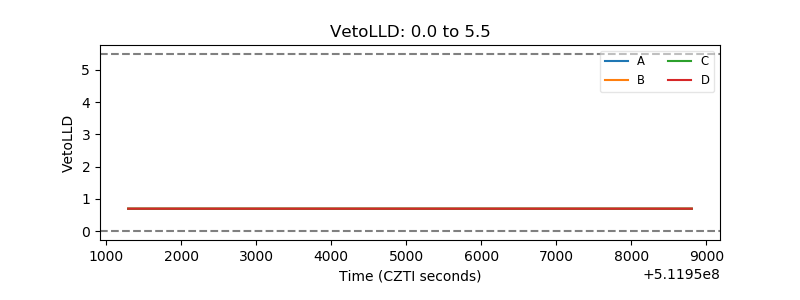 |
| Alpha Counter | 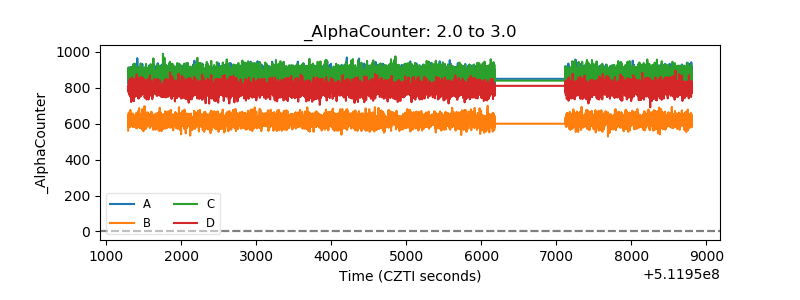 |
| _CPM_Rate | 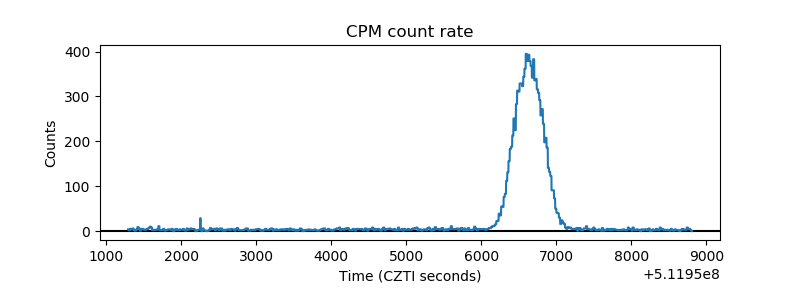 |
| CZT Counter | 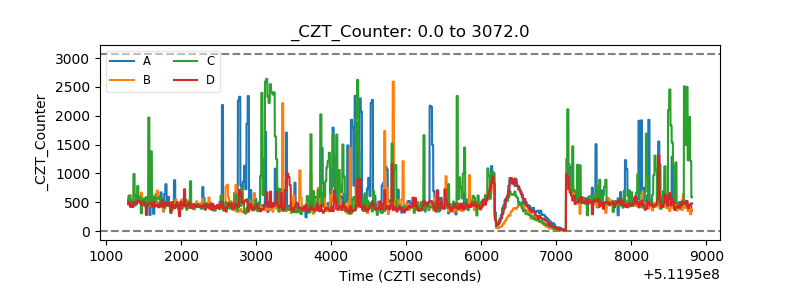 |
| +2.5 Volts monitor |  |
| +5 Volts monitor |  |
| _ROLL_ROT | 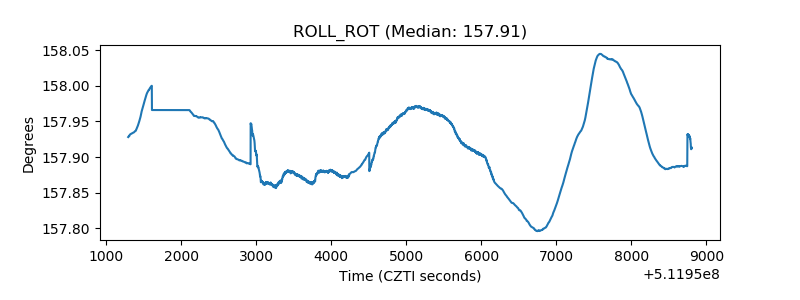 |
| _Roll_DEC | 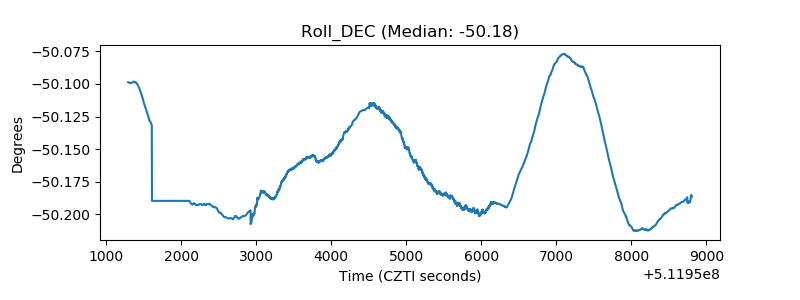 |
| _Roll_RA | 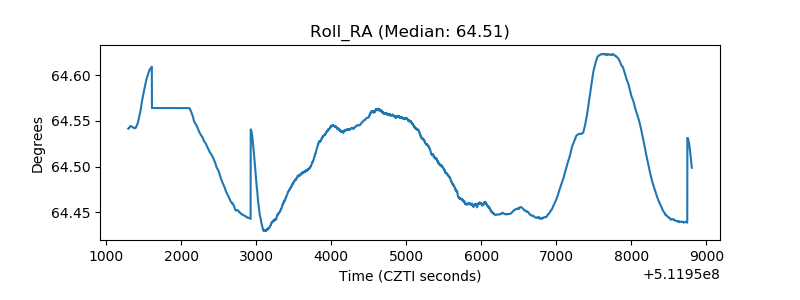 |
| Veto Counter | 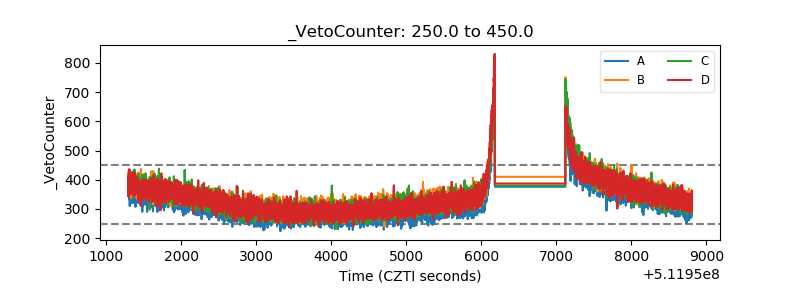 |