| Param | Original file | Final file |
|---|---|---|
| Filename | modeM0/AS1A14_083T05_9000006560_56726cztM0_level2.fits | modeM0/AS1A14_083T05_9000006560_56726cztM0_level2_quad_clean.evt |
| Size (bytes) | 611,910,720 | 85,700,160 |
| Size | 583.6 MB | 81.7 MB |
| Events in quadrant A | 8,776,039 | 459,029 |
| Events in quadrant B | 3,728,755 | 661,839 |
| Events in quadrant C | 6,280,043 | 477,576 |
| Events in quadrant D | 3,368,917 | 549,964 |
| Mode SS | |||
|---|---|---|---|
| Quadrant | BADHDUFLAG | Total packets | Discarded packets |
| A | 0 | 128 | 0 |
| B | 0 | 128 | 0 |
| C | 0 | 128 | 0 |
| D | 0 | 128 | 0 |
| Mode M0 | |||
|---|---|---|---|
| Quadrant | BADHDUFLAG | Total packets | Discarded packets |
| A | 0 | 30542 | 1 |
| B | 0 | 15751 | 1 |
| C | 0 | 23226 | 1 |
| D | 0 | 14720 | 2 |
| Mode M9 | |||
|---|---|---|---|
| Quadrant | BADHDUFLAG | Total packets | Discarded packets |
| A | 0 | 11 | 0 |
| B | 0 | 11 | 0 |
| C | 0 | 11 | 0 |
| D | 0 | 11 | 0 |
| Quadrant | Total seconds | Saturated seconds | Saturation percentage |
|---|---|---|---|
| A | 6402 | 1949 | 30.443611% |
| B | 6403 | 151 | 2.358270% |
| C | 6403 | 1241 | 19.381540% |
| D | 6402 | 84 | 1.312090% |
Noise dominated data is calculated using 1-second bins in cleaned event files. If a bin has >2000 counts, and if more than 50% of those come from <1% of pixels, then it is considered to be noise-dominated and hence unusable.
| Quadrant | # 1 sec bins | Bins with >0 counts | Bins with >2000 counts | High rate bins dominated by noise | Noise dominated (total time) | Noise dominated (detector-on time) | Marked lightcurve |
|---|---|---|---|---|---|---|---|
| A | 7482 | 6403 | 1811 | 1811 | 24.20% | 28.28% | 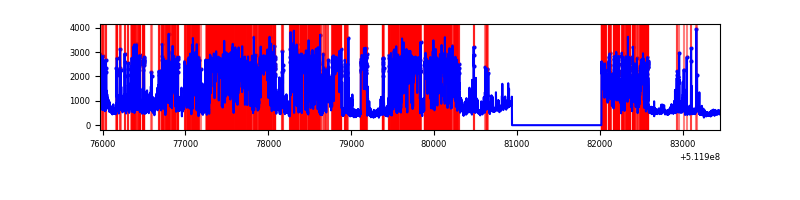 |
| B | 7483 | 6404 | 66 | 66 | 0.88% | 1.03% | 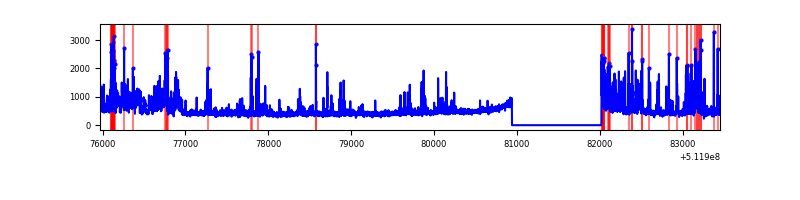 |
| C | 7483 | 6404 | 1195 | 1195 | 15.97% | 18.66% | 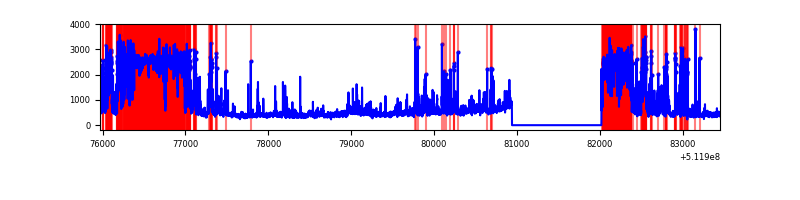 |
| D | 7482 | 6403 | 87 | 87 | 1.16% | 1.36% | 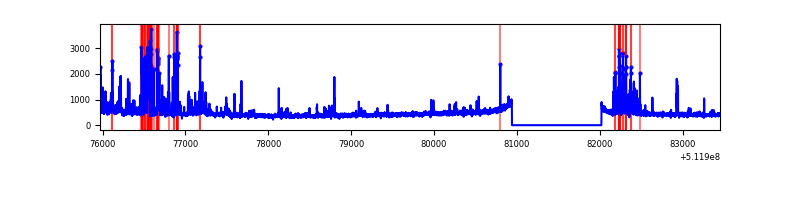 |
Top three noisy pixels from each quadrant. If the there are fewer than three noisy pixels in the level2.evt file, extra rows are filled as -1
| Pixel properties | Quadrant properties | ||||||
|---|---|---|---|---|---|---|---|
| Quadrant | DetID | PixID | Counts | Sigma | Mean | Median | Sigma |
| A | 10 | 251 | 5303420 | 35535.5 | 599 | 584 | 149.2 |
| A | 3 | 14 | 645620 | 4322.53 | 599 | 584 | 149.2 |
| A | 3 | 62 | 472839 | 3164.69 | 599 | 584 | 149.2 |
| B | 5 | 185 | 344508 | 2348.54 | 680 | 654 | 146.4 |
| B | 10 | 247 | 271451 | 1849.56 | 680 | 654 | 146.4 |
| B | 4 | 206 | 221876 | 1510.96 | 680 | 654 | 146.4 |
| C | 15 | 230 | 3116174 | 19045.25 | 597 | 590 | 163.6 |
| C | 13 | 3 | 391730 | 2391.0 | 597 | 590 | 163.6 |
| C | 12 | 249 | 150511 | 916.45 | 597 | 590 | 163.6 |
| D | 2 | 249 | 408799 | 2179.1 | 655 | 625 | 187.3 |
| D | 2 | 207 | 144937 | 770.43 | 655 | 625 | 187.3 |
| D | 5 | 113 | 62273 | 329.12 | 655 | 625 | 187.3 |
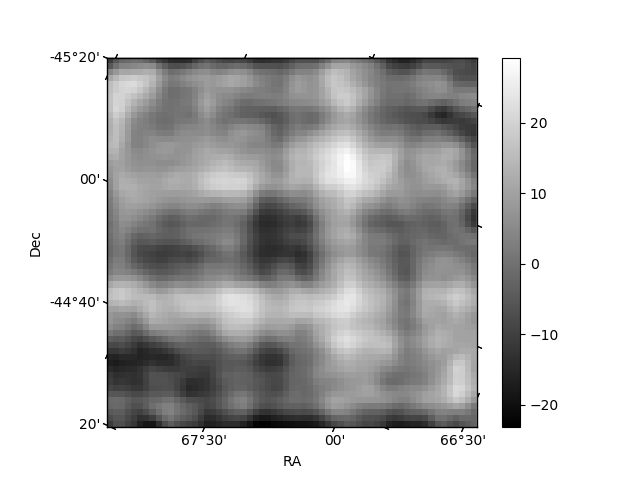
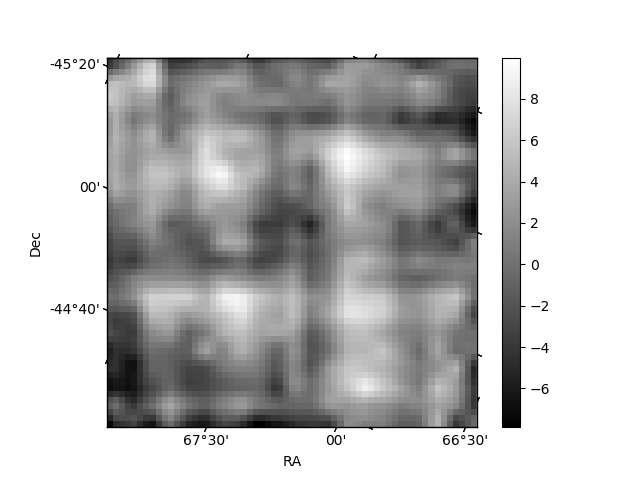
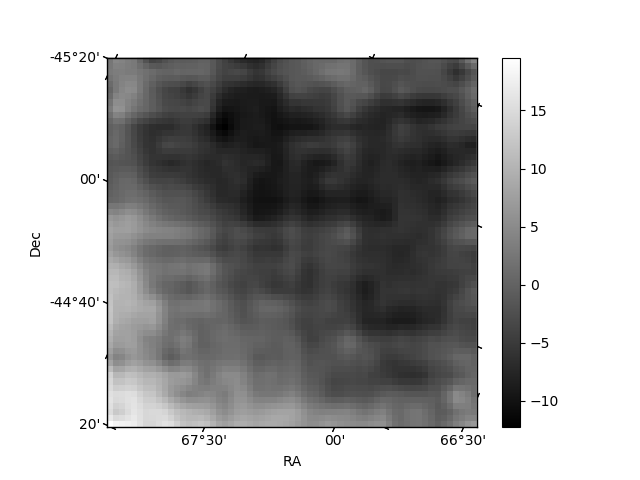
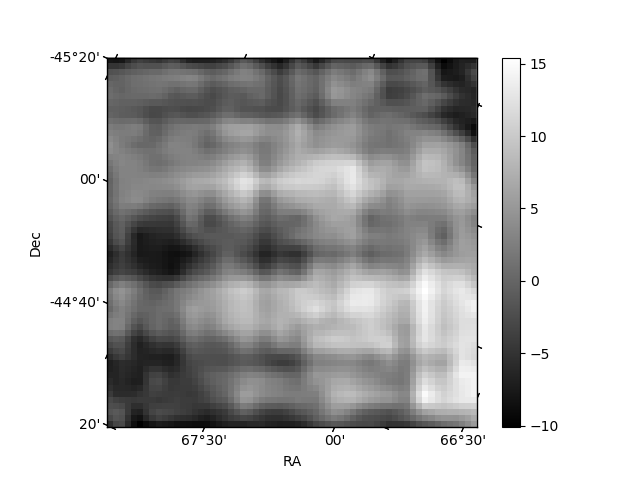
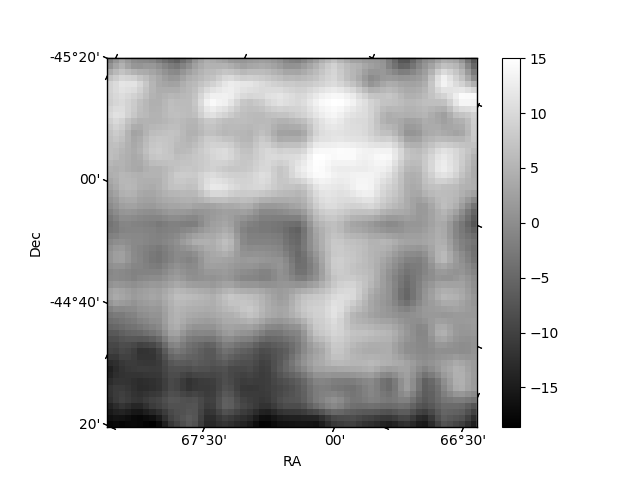
Histogram calculated using DETX and DETY for each event in the final _common_clean file
| Quadrant A | 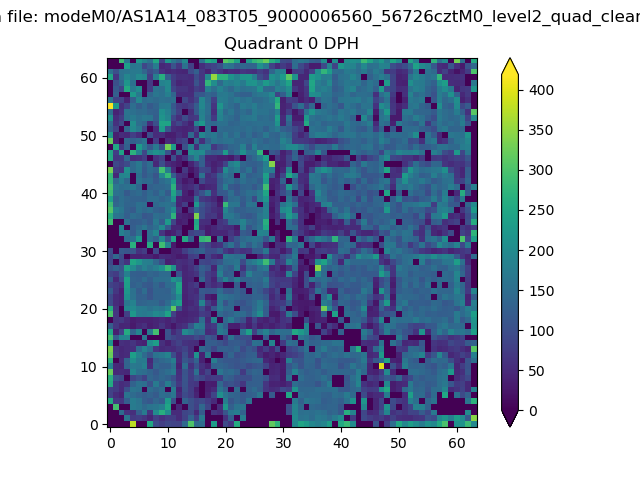 |
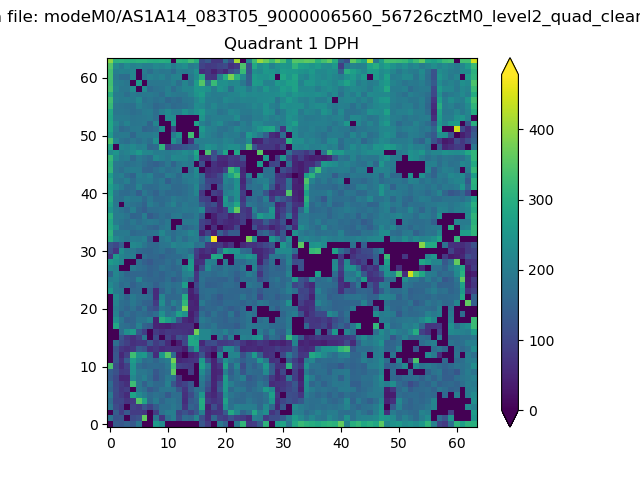 |
Quadrant B |
|---|---|---|---|
| Quadrant D | 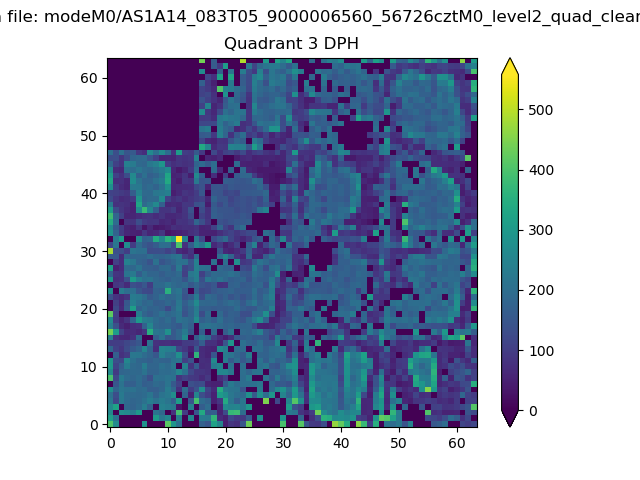 |
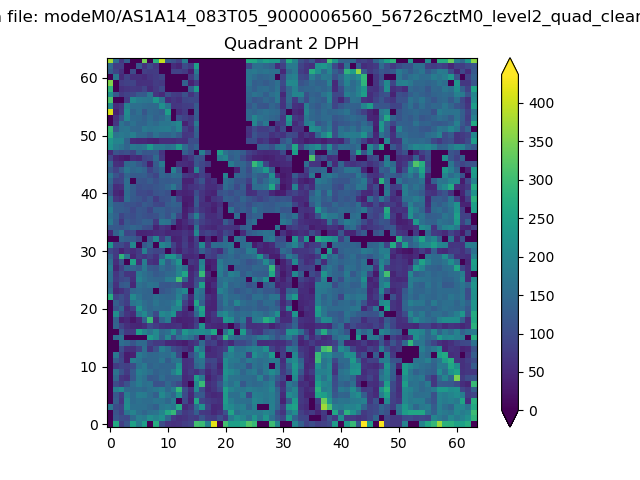 |
Quadrant C |
| Plot type | Count rate plots | Images |
|---|---|---|
| Comparison with Poisson distribution Blue bars denote a histogram of data divided into 1 sec bins. Red curve is a Poisson curve with rate = median count rate of data. |
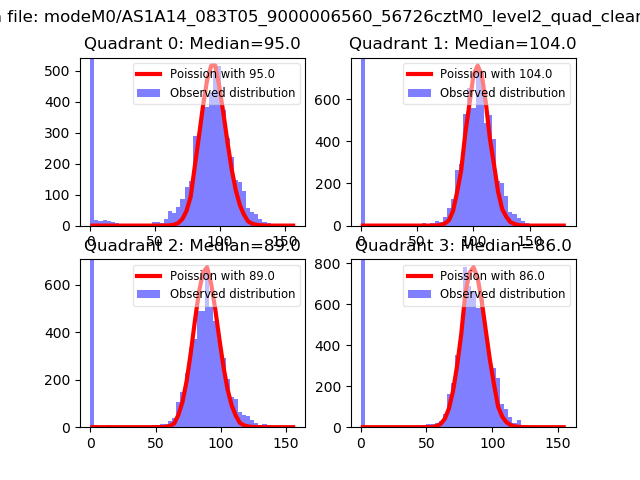 |
 |
| Quadrant-wise count rates Data is divided into 100 sec bins |
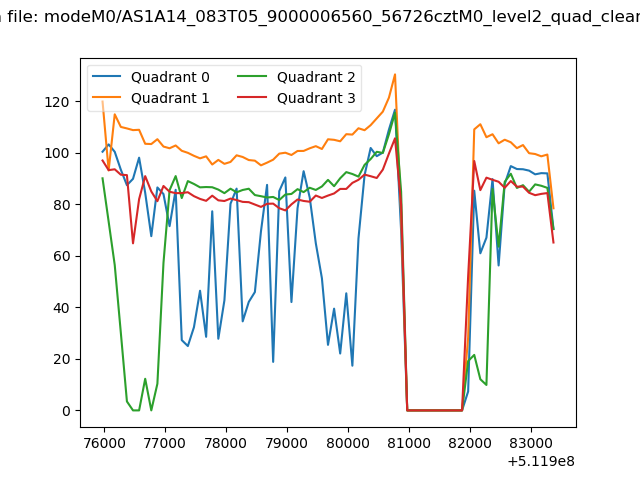 |
|
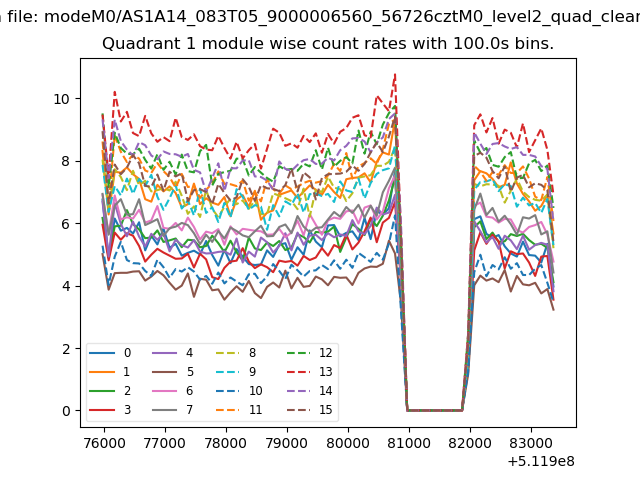
| Module-wise count rates for Quadrant A Data is divided into 100 sec bins |
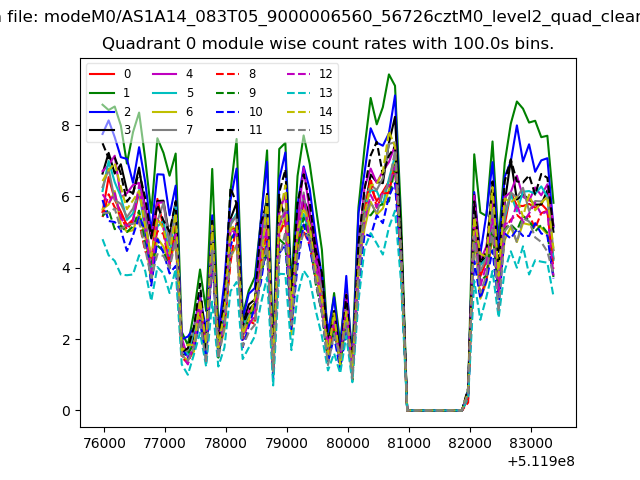 |
 |
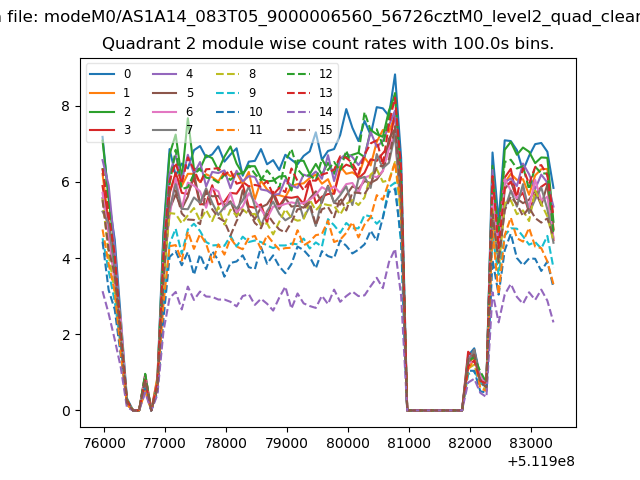
| Module-wise count rates for Quadrant B Data is divided into 100 sec bins |
 |
 |
| Module-wise count rates for Quadrant C Data is divided into 100 sec bins |
 |
 |
| Module-wise count rates for Quadrant D Data is divided into 100 sec bins |
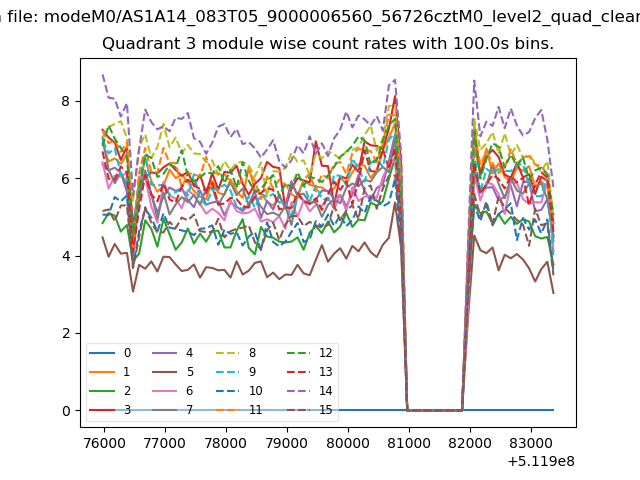 |
 |
| Parameter | Plot |
|---|---|
| CZT HV Monitor | 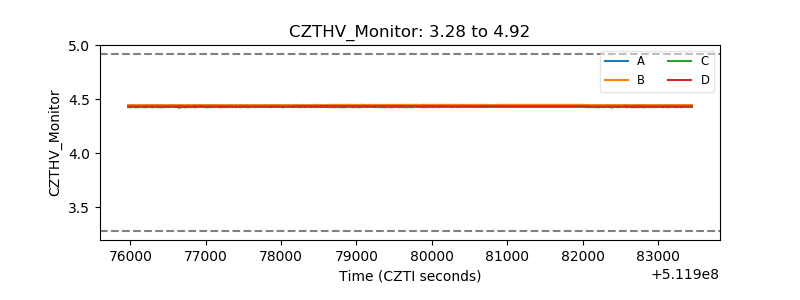 |
| D_VDD | 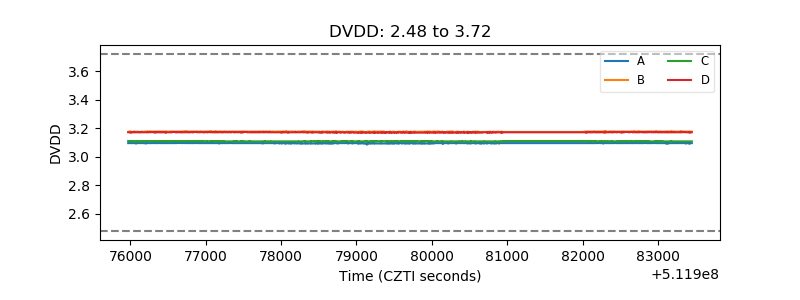 |
| Temperature 1 | 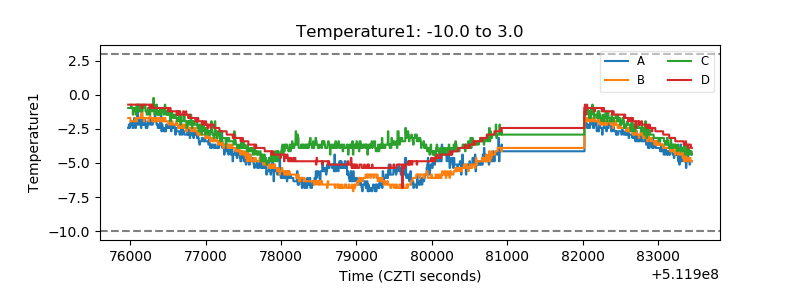 |
| Veto HV Monitor | 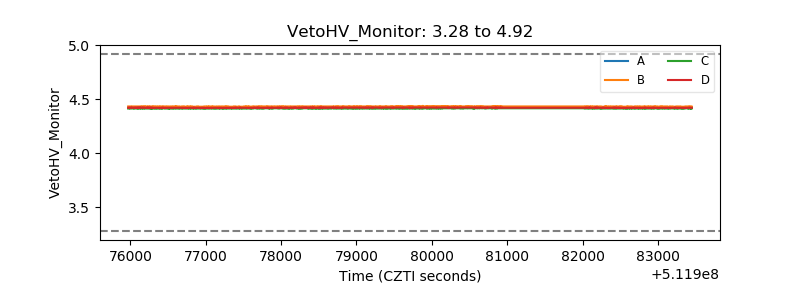 |
| Veto LLD | 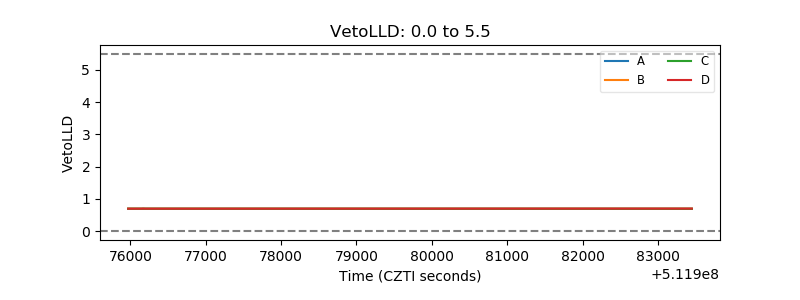 |
| Alpha Counter | 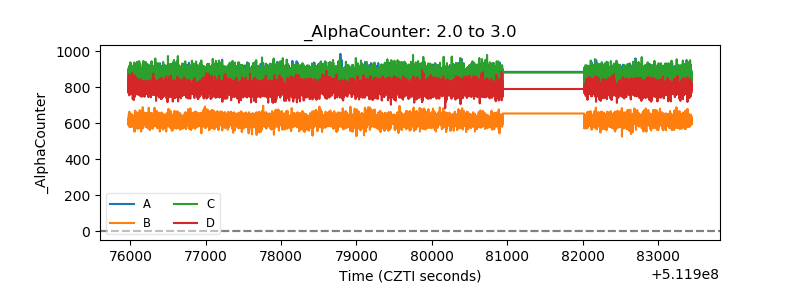 |
| _CPM_Rate | 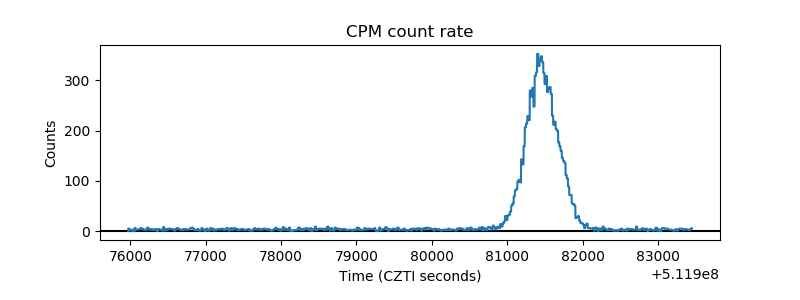 |
| CZT Counter | 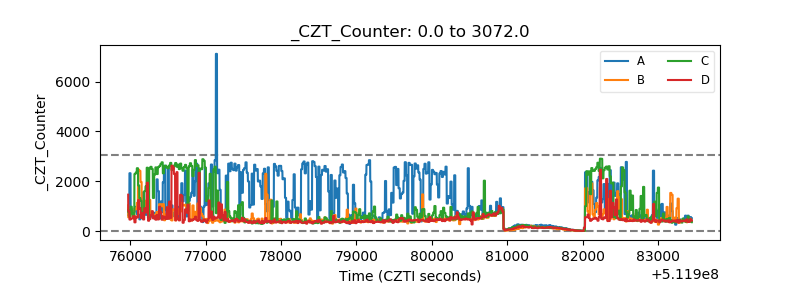 |
| +2.5 Volts monitor |  |
| +5 Volts monitor |  |
| _ROLL_ROT | 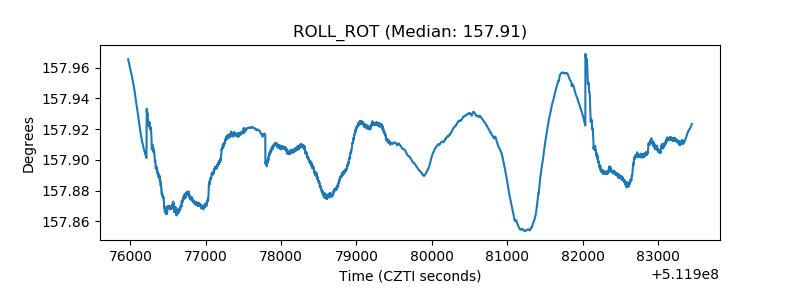 |
| _Roll_DEC | 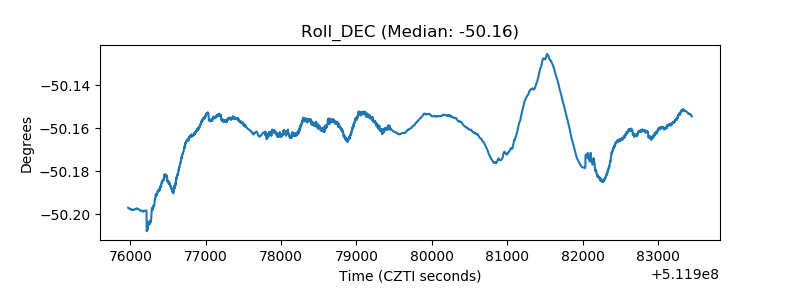 |
| _Roll_RA | 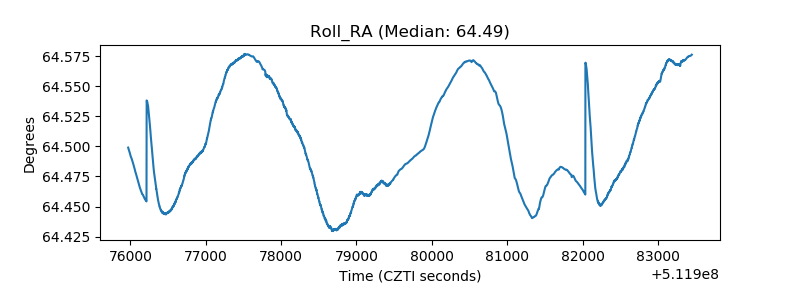 |
| Veto Counter | 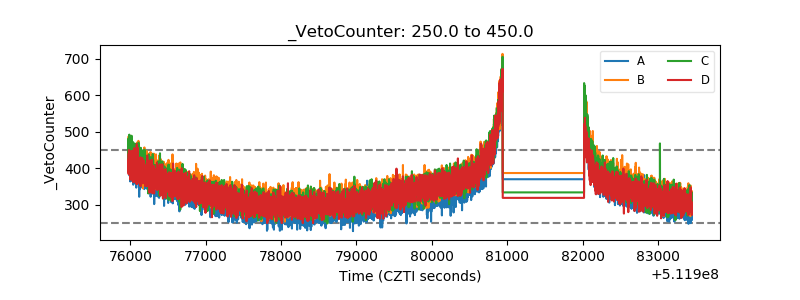 |