| Param | Original file | Final file |
|---|---|---|
| Filename | modeM0/AS1A14_083T05_9000006560_56727cztM0_level2.fits | modeM0/AS1A14_083T05_9000006560_56727cztM0_level2_quad_clean.evt |
| Size (bytes) | 1,282,121,280 | 221,762,880 |
| Size | 1.2 GB | 211.5 MB |
| Events in quadrant A | 14,630,350 | 1,321,133 |
| Events in quadrant B | 8,594,870 | 1,650,194 |
| Events in quadrant C | 14,480,193 | 1,256,550 |
| Events in quadrant D | 8,501,447 | 1,369,251 |
| Mode SS | |||
|---|---|---|---|
| Quadrant | BADHDUFLAG | Total packets | Discarded packets |
| A | 0 | 330 | 0 |
| B | 0 | 330 | 0 |
| C | 0 | 330 | 0 |
| D | 0 | 330 | 0 |
| Mode M0 | |||
|---|---|---|---|
| Quadrant | BADHDUFLAG | Total packets | Discarded packets |
| A | 0 | 54356 | 10 |
| B | 0 | 37493 | 3 |
| C | 0 | 54850 | 3 |
| D | 0 | 37191 | 3 |
| Mode M9 | |||
|---|---|---|---|
| Quadrant | BADHDUFLAG | Total packets | Discarded packets |
| A | 0 | 31 | 0 |
| B | 0 | 31 | 0 |
| C | 0 | 31 | 0 |
| D | 0 | 31 | 0 |
| Quadrant | Total seconds | Saturated seconds | Saturation percentage |
|---|---|---|---|
| A | 16196 | 2177 | 13.441591% |
| B | 16199 | 352 | 2.172974% |
| C | 16199 | 2287 | 14.118155% |
| D | 16198 | 215 | 1.327324% |
Noise dominated data is calculated using 1-second bins in cleaned event files. If a bin has >2000 counts, and if more than 50% of those come from <1% of pixels, then it is considered to be noise-dominated and hence unusable.
| Quadrant | # 1 sec bins | Bins with >0 counts | Bins with >2000 counts | High rate bins dominated by noise | Noise dominated (total time) | Noise dominated (detector-on time) | Marked lightcurve |
|---|---|---|---|---|---|---|---|
| A | 19313 | 16200 | 1955 | 1955 | 10.12% | 12.07% | 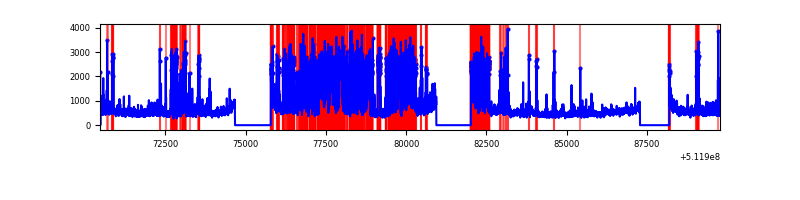 |
| B | 19314 | 16202 | 146 | 146 | 0.76% | 0.90% | 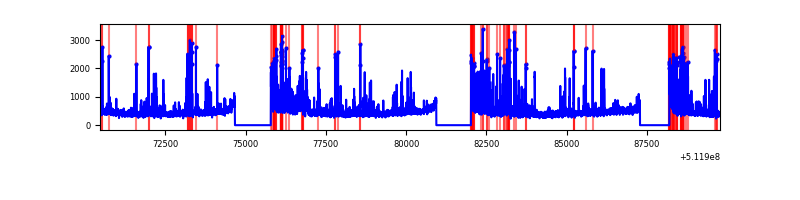 |
| C | 19314 | 16201 | 2162 | 2162 | 11.19% | 13.34% | 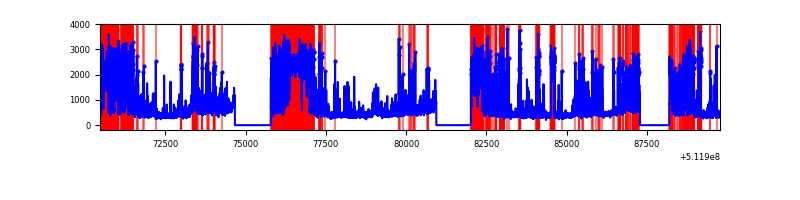 |
| D | 19313 | 16201 | 200 | 200 | 1.04% | 1.23% | 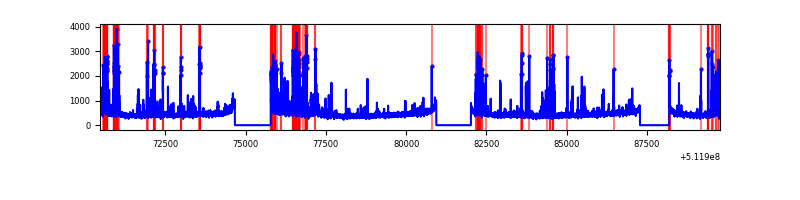 |
Top three noisy pixels from each quadrant. If the there are fewer than three noisy pixels in the level2.evt file, extra rows are filled as -1
| Pixel properties | Quadrant properties | ||||||
|---|---|---|---|---|---|---|---|
| Quadrant | DetID | PixID | Counts | Sigma | Mean | Median | Sigma |
| A | 10 | 251 | 5711945 | 14079.71 | 1635 | 1595 | 405.6 |
| A | 3 | 14 | 1658283 | 4084.81 | 1635 | 1595 | 405.6 |
| A | 3 | 62 | 822130 | 2023.15 | 1635 | 1595 | 405.6 |
| B | 5 | 185 | 506159 | 1382.99 | 1716 | 1654 | 364.8 |
| B | 10 | 247 | 478300 | 1306.62 | 1716 | 1654 | 364.8 |
| B | 4 | 206 | 292946 | 798.51 | 1716 | 1654 | 364.8 |
| C | 15 | 230 | 5673339 | 13318.66 | 1555 | 1541 | 425.9 |
| C | 13 | 3 | 1347417 | 3160.42 | 1555 | 1541 | 425.9 |
| C | 12 | 249 | 454291 | 1063.16 | 1555 | 1541 | 425.9 |
| D | 2 | 249 | 785260 | 1668.82 | 1654 | 1574 | 469.6 |
| D | 2 | 252 | 255264 | 540.22 | 1654 | 1574 | 469.6 |
| D | 2 | 207 | 239417 | 506.47 | 1654 | 1574 | 469.6 |
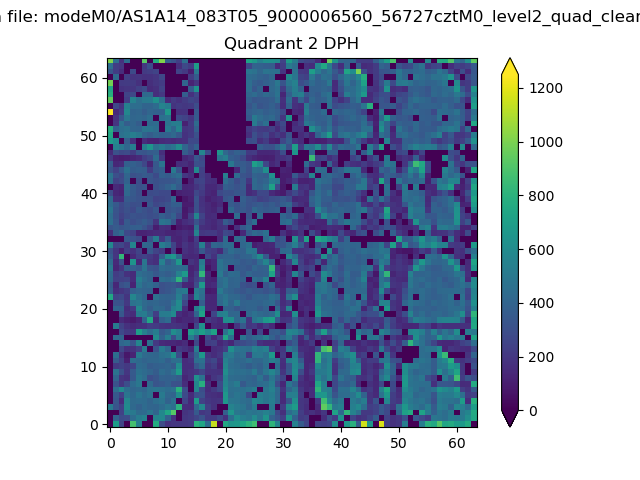
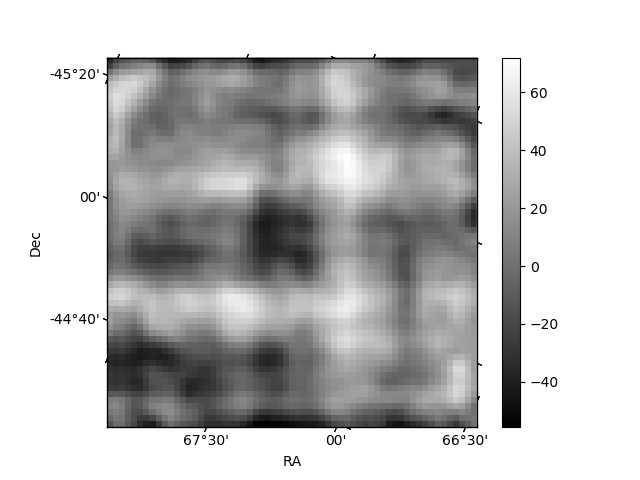
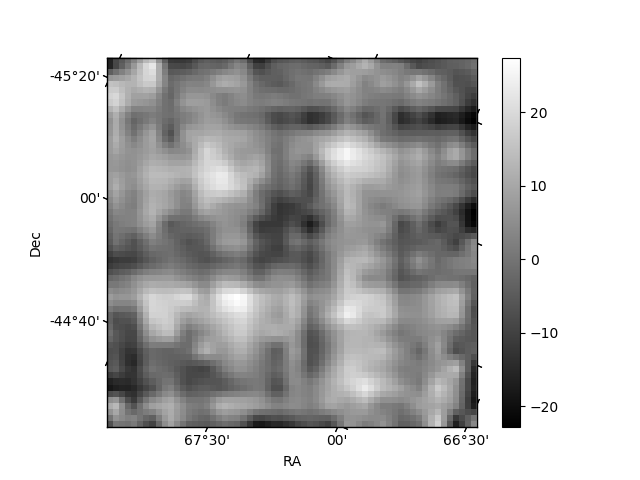
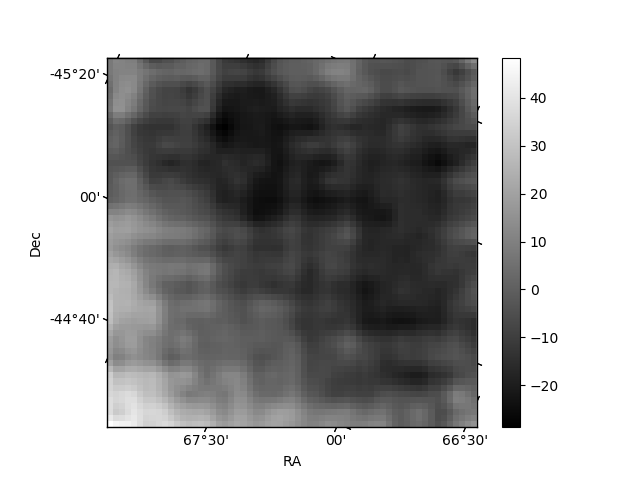
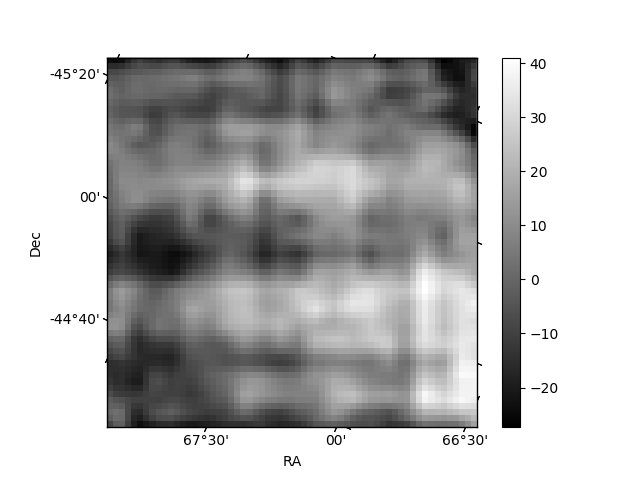
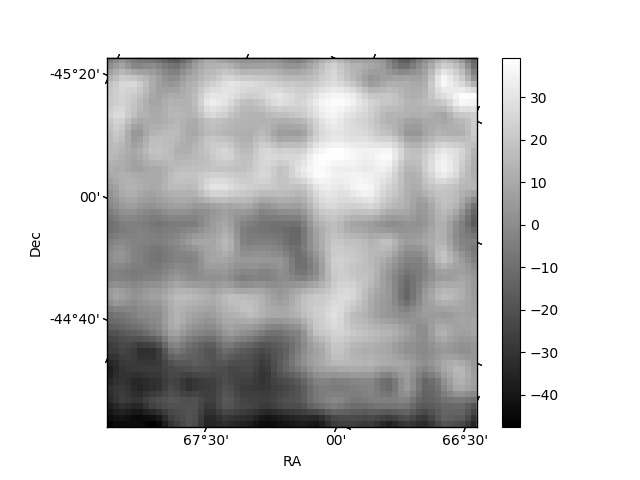
Histogram calculated using DETX and DETY for each event in the final _common_clean file
| Quadrant A | 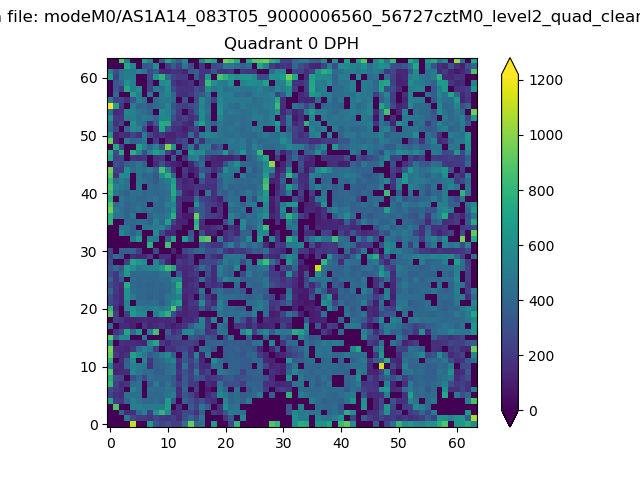 |
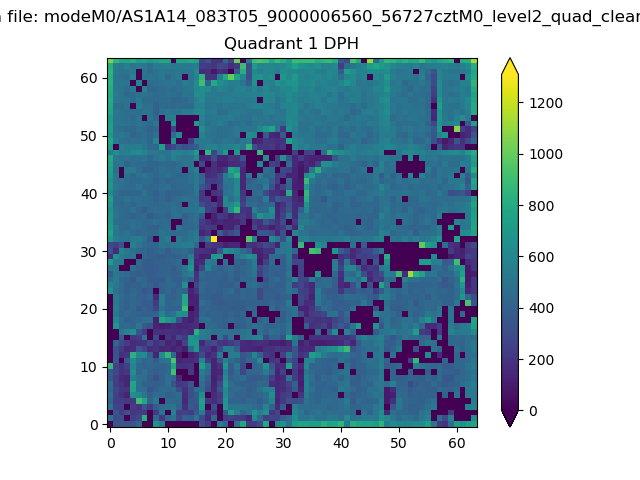 |
Quadrant B |
|---|---|---|---|
| Quadrant D | 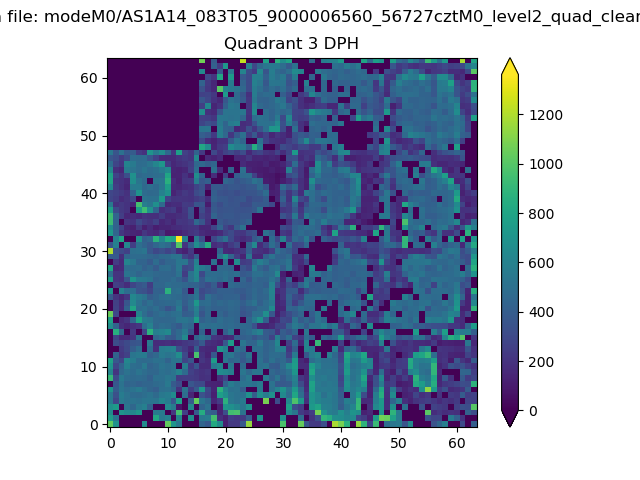 |
 |
Quadrant C |
| Plot type | Count rate plots | Images |
|---|---|---|
| Comparison with Poisson distribution Blue bars denote a histogram of data divided into 1 sec bins. Red curve is a Poisson curve with rate = median count rate of data. |
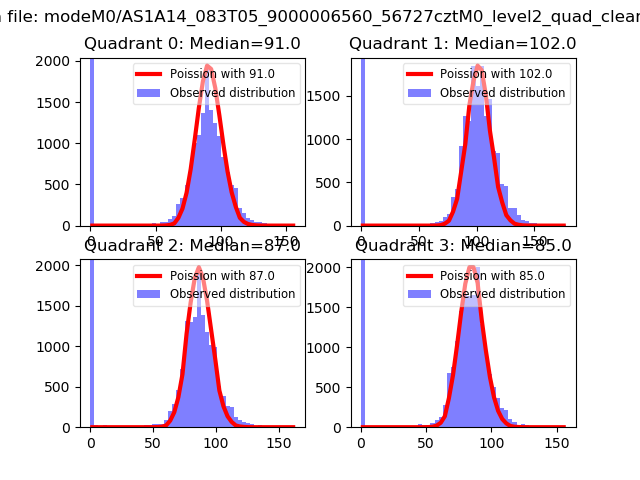 |
 |
| Quadrant-wise count rates Data is divided into 100 sec bins |
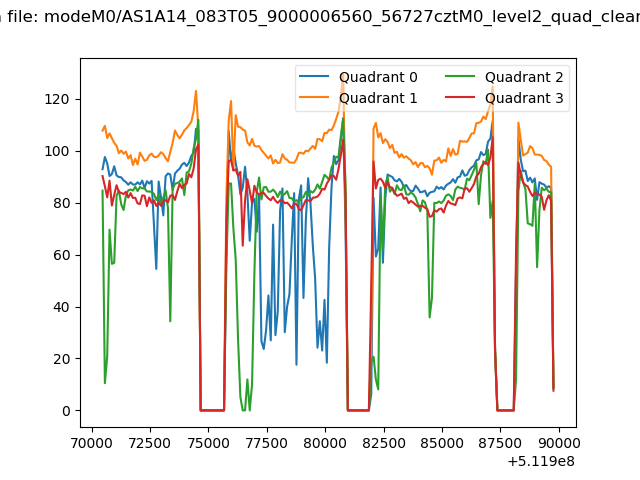 |
|
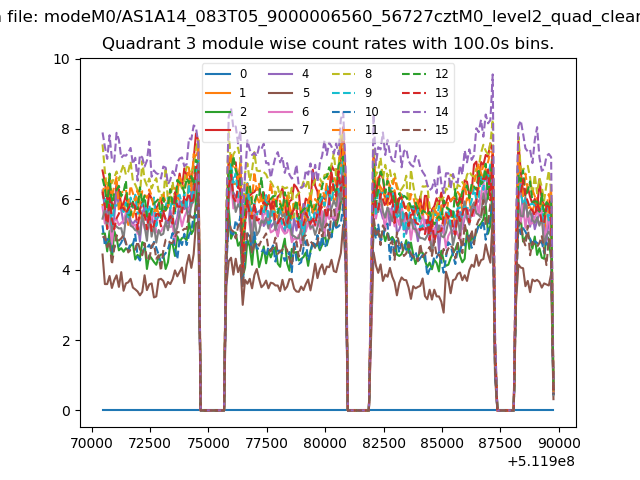
| Module-wise count rates for Quadrant A Data is divided into 100 sec bins |
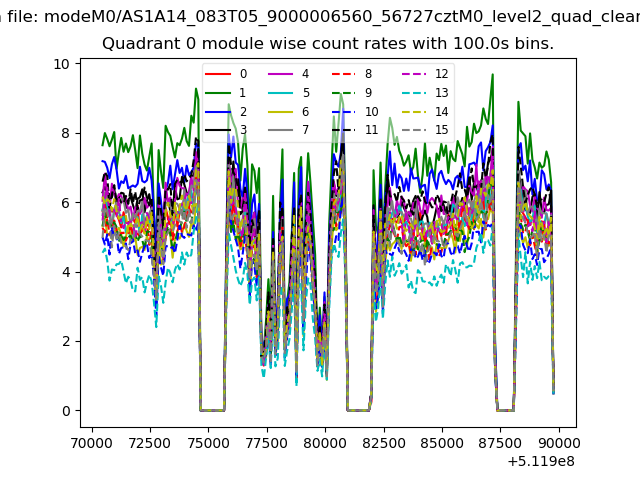 |
 |
| Module-wise count rates for Quadrant B Data is divided into 100 sec bins |
 |
 |
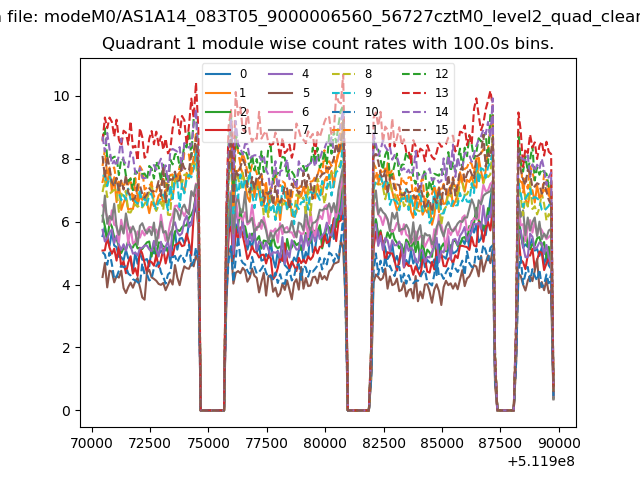
| Module-wise count rates for Quadrant C Data is divided into 100 sec bins |
 |
 |
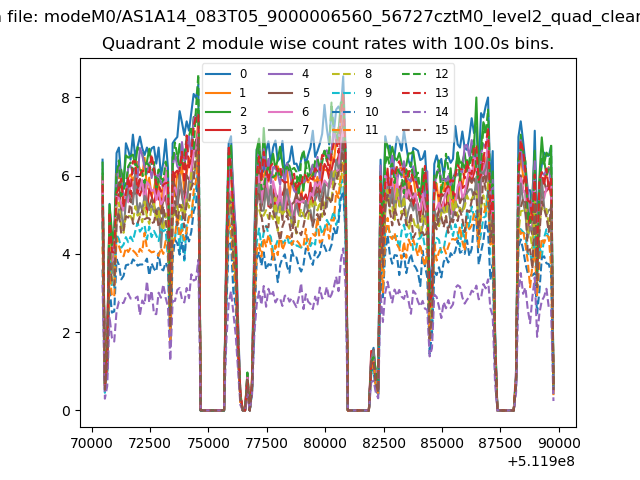
| Module-wise count rates for Quadrant D Data is divided into 100 sec bins |
 |
 |
| Parameter | Plot |
|---|---|
| CZT HV Monitor | 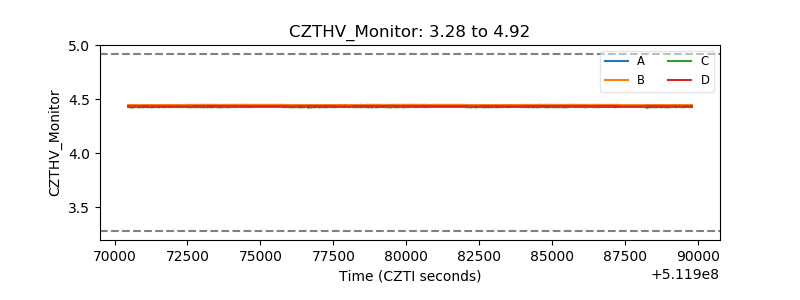 |
| D_VDD | 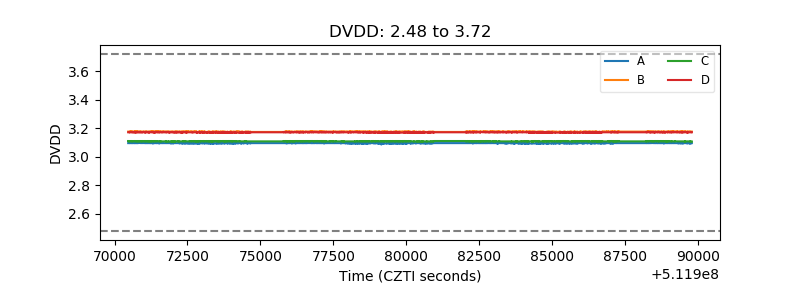 |
| Temperature 1 | 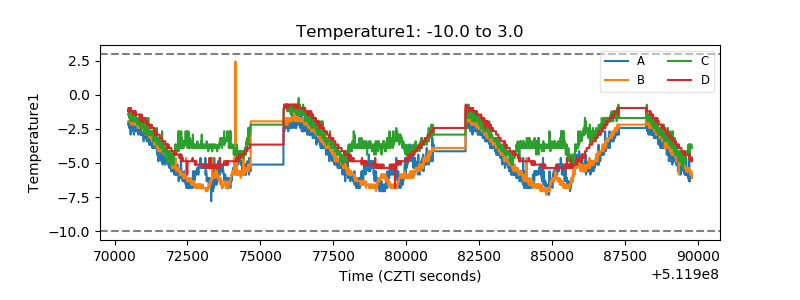 |
| Veto HV Monitor | 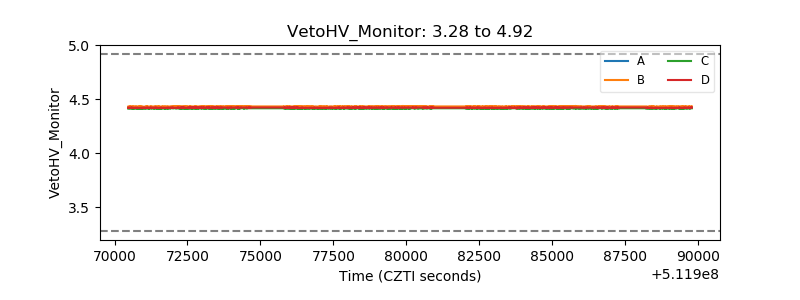 |
| Veto LLD | 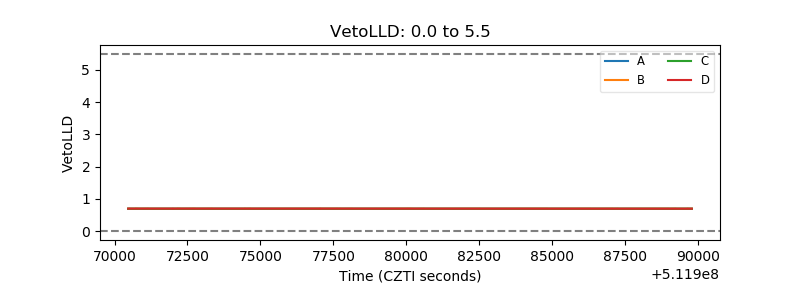 |
| Alpha Counter | 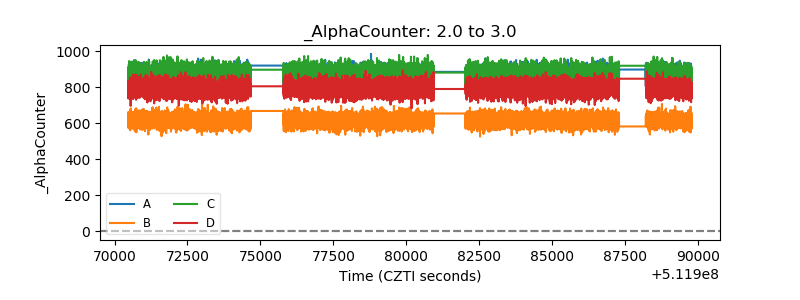 |
| _CPM_Rate | 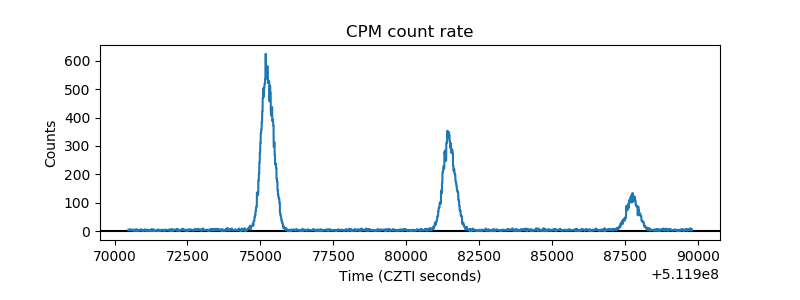 |
| CZT Counter | 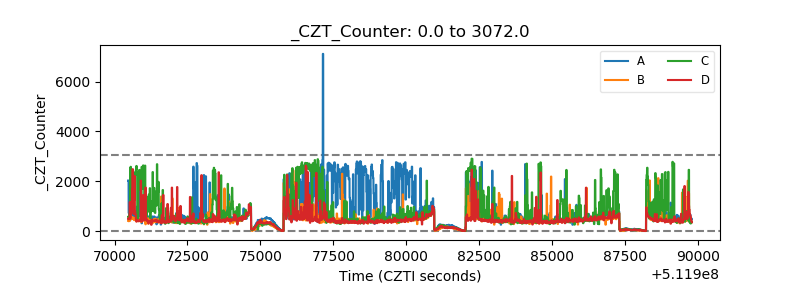 |
| +2.5 Volts monitor |  |
| +5 Volts monitor |  |
| _ROLL_ROT | 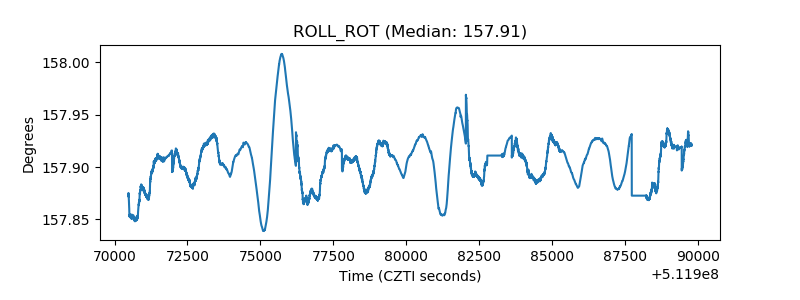 |
| _Roll_DEC | 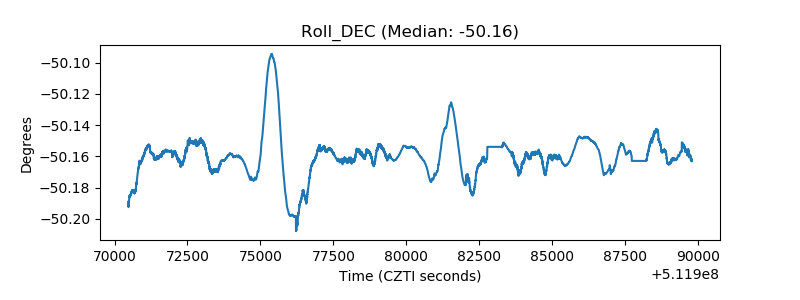 |
| _Roll_RA | 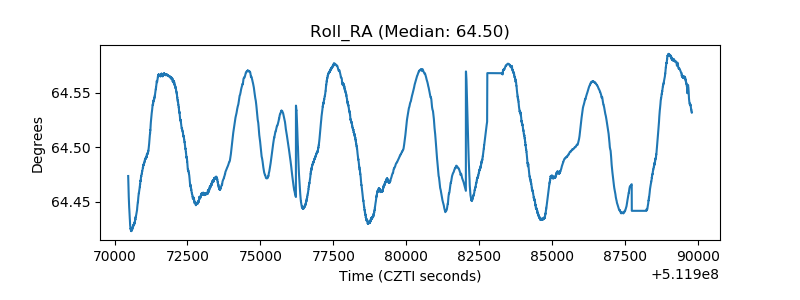 |
| Veto Counter | 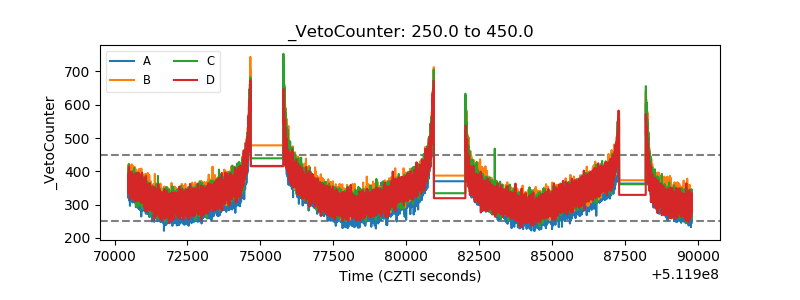 |