| Param | Original file | Final file |
|---|---|---|
| Filename | modeM0/AS1A14_083T05_9000006560_56728cztM0_level2.fits | modeM0/AS1A14_083T05_9000006560_56728cztM0_level2_quad_clean.evt |
| Size (bytes) | 477,181,440 | 102,723,840 |
| Size | 455.1 MB | 98.0 MB |
| Events in quadrant A | 4,832,906 | 667,327 |
| Events in quadrant B | 3,441,367 | 727,163 |
| Events in quadrant C | 5,211,831 | 603,720 |
| Events in quadrant D | 3,623,901 | 615,623 |
| Mode SS | |||
|---|---|---|---|
| Quadrant | BADHDUFLAG | Total packets | Discarded packets |
| A | 0 | 146 | 0 |
| B | 0 | 146 | 0 |
| C | 0 | 146 | 0 |
| D | 0 | 146 | 0 |
| Mode M0 | |||
|---|---|---|---|
| Quadrant | BADHDUFLAG | Total packets | Discarded packets |
| A | 0 | 19129 | 2 |
| B | 0 | 15544 | 2 |
| C | 0 | 20795 | 2 |
| D | 0 | 16128 | 2 |
| Mode M9 | |||
|---|---|---|---|
| Quadrant | BADHDUFLAG | Total packets | Discarded packets |
| A | 0 | 4 | 0 |
| B | 0 | 4 | 0 |
| C | 0 | 4 | 0 |
| D | 0 | 4 | 0 |
| Quadrant | Total seconds | Saturated seconds | Saturation percentage |
|---|---|---|---|
| A | 7123 | 304 | 4.267865% |
| B | 7123 | 127 | 1.782957% |
| C | 7123 | 613 | 8.605924% |
| D | 7123 | 52 | 0.730029% |
Noise dominated data is calculated using 1-second bins in cleaned event files. If a bin has >2000 counts, and if more than 50% of those come from <1% of pixels, then it is considered to be noise-dominated and hence unusable.
| Quadrant | # 1 sec bins | Bins with >0 counts | Bins with >2000 counts | High rate bins dominated by noise | Noise dominated (total time) | Noise dominated (detector-on time) | Marked lightcurve |
|---|---|---|---|---|---|---|---|
| A | 7604 | 7125 | 218 | 218 | 2.87% | 3.06% | 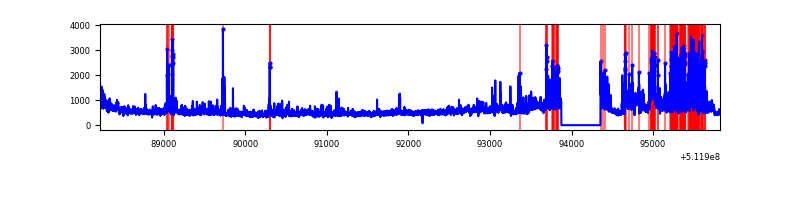 |
| B | 7604 | 7125 | 51 | 51 | 0.67% | 0.72% | 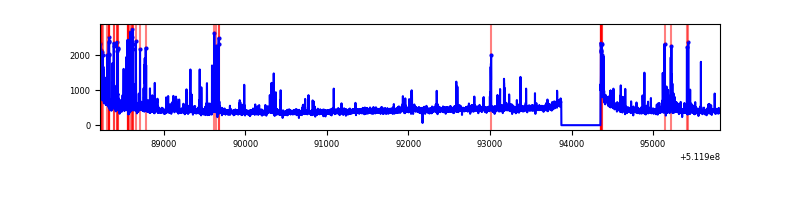 |
| C | 7604 | 7125 | 514 | 514 | 6.76% | 7.21% | 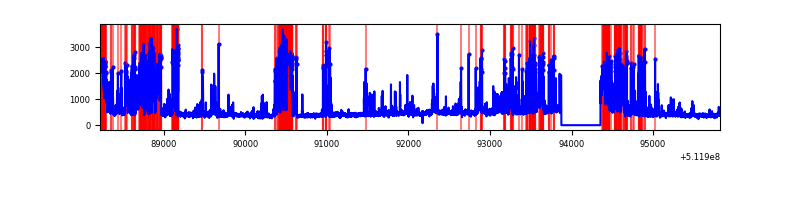 |
| D | 7604 | 7125 | 51 | 51 | 0.67% | 0.72% | 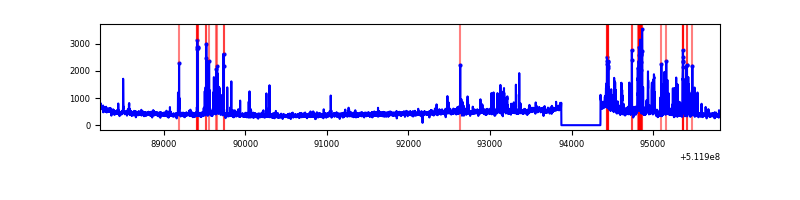 |
Top three noisy pixels from each quadrant. If the there are fewer than three noisy pixels in the level2.evt file, extra rows are filled as -1
| Pixel properties | Quadrant properties | ||||||
|---|---|---|---|---|---|---|---|
| Quadrant | DetID | PixID | Counts | Sigma | Mean | Median | Sigma |
| A | 3 | 14 | 1030285 | 5472.43 | 756 | 737 | 188.1 |
| A | 10 | 251 | 659969 | 3504.07 | 756 | 737 | 188.1 |
| A | 3 | 62 | 200222 | 1060.34 | 756 | 737 | 188.1 |
| B | 10 | 247 | 120874 | 735.09 | 757 | 729 | 163.4 |
| B | 4 | 206 | 103097 | 626.33 | 757 | 729 | 163.4 |
| B | 7 | 252 | 60603 | 366.33 | 757 | 729 | 163.4 |
| C | 15 | 230 | 874625 | 4485.94 | 710 | 699 | 194.8 |
| C | 13 | 3 | 606227 | 3108.23 | 710 | 699 | 194.8 |
| C | 1 | 12 | 424841 | 2177.16 | 710 | 699 | 194.8 |
| D | 2 | 207 | 321919 | 1535.68 | 738 | 702 | 209.2 |
| D | 2 | 252 | 146950 | 699.19 | 738 | 702 | 209.2 |
| D | 6 | 239 | 54801 | 258.64 | 738 | 702 | 209.2 |
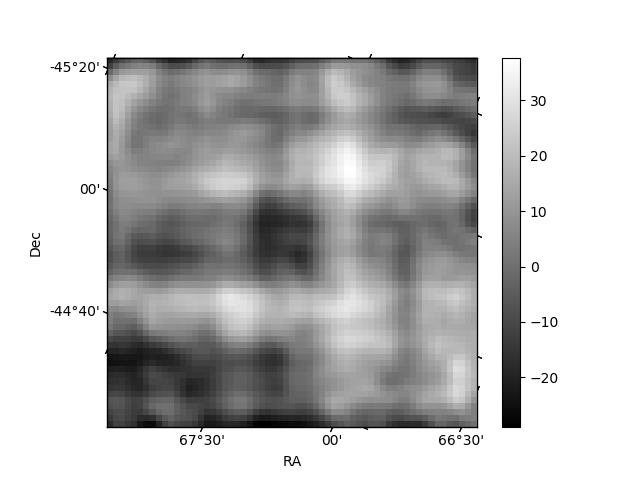
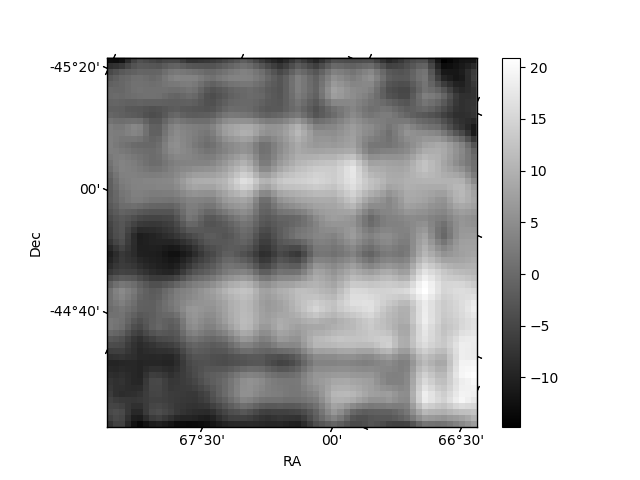
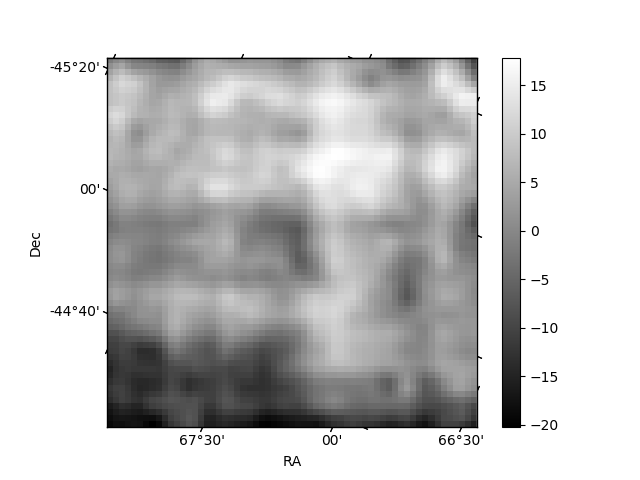
Histogram calculated using DETX and DETY for each event in the final _common_clean file
| Quadrant A | 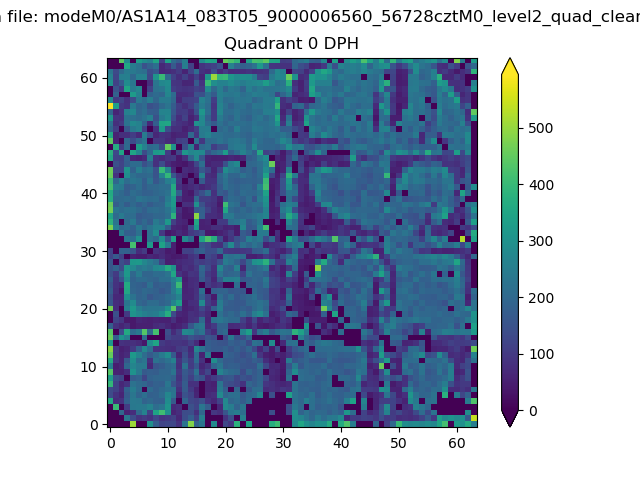 |
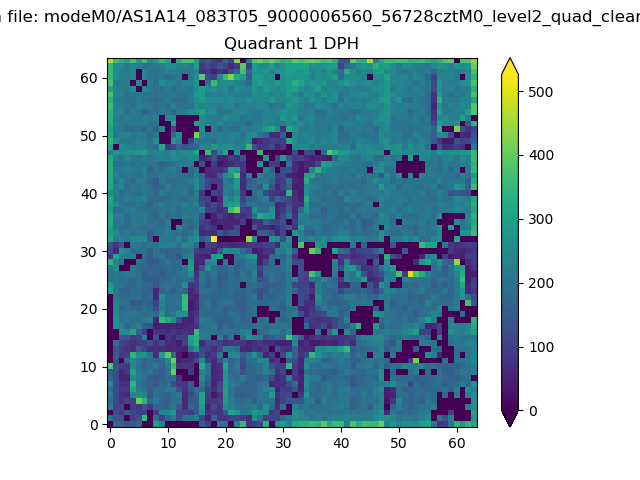 |
Quadrant B |
|---|---|---|---|
| Quadrant D | 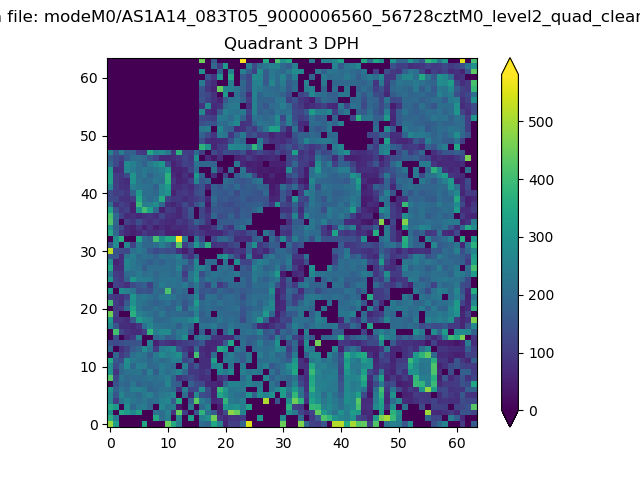 |
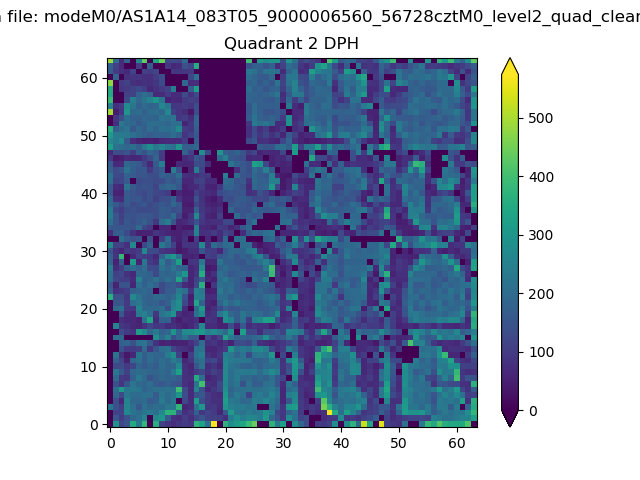 |
Quadrant C |
| Plot type | Count rate plots | Images |
|---|---|---|
| Comparison with Poisson distribution Blue bars denote a histogram of data divided into 1 sec bins. Red curve is a Poisson curve with rate = median count rate of data. |
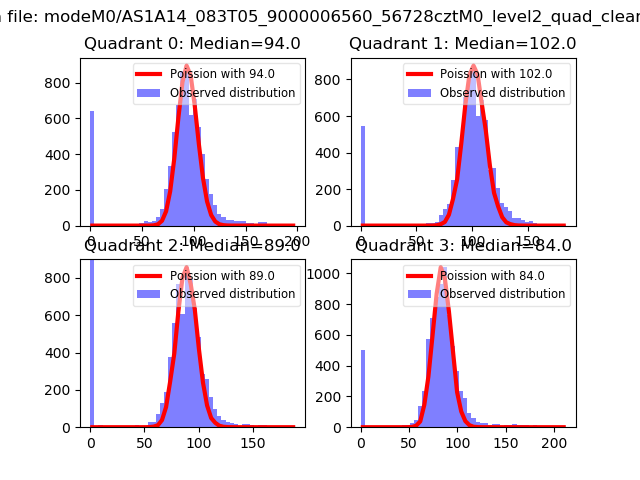 |
 |
| Quadrant-wise count rates Data is divided into 100 sec bins |
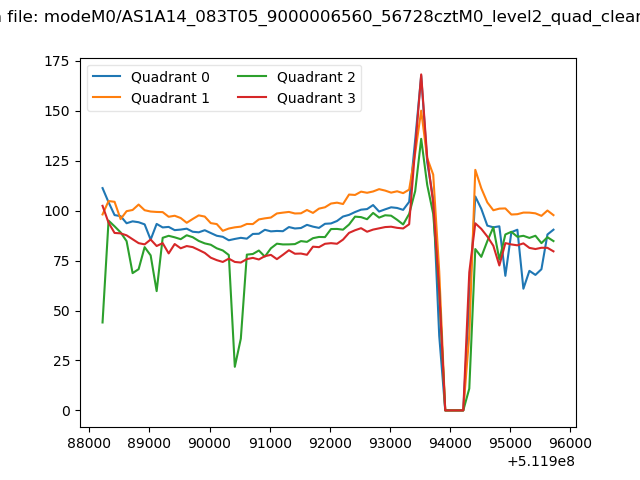 |
|
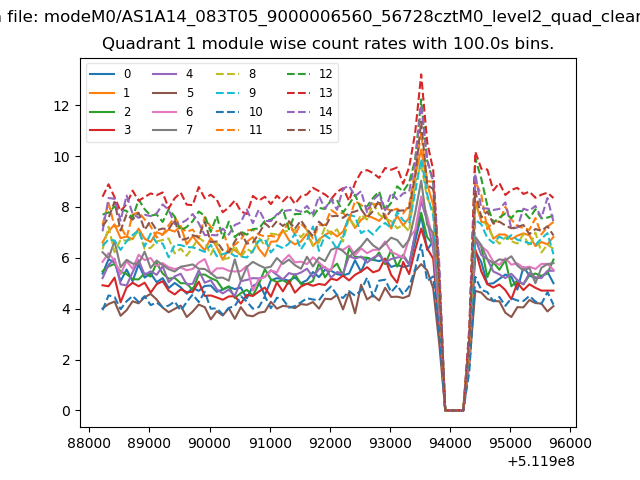
| Module-wise count rates for Quadrant A Data is divided into 100 sec bins |
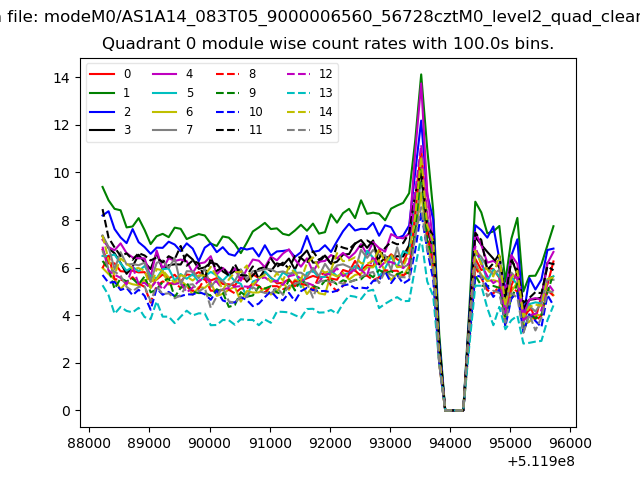 |
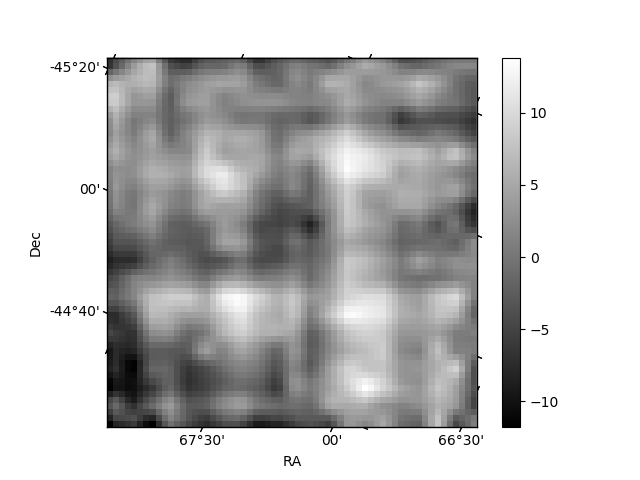 |
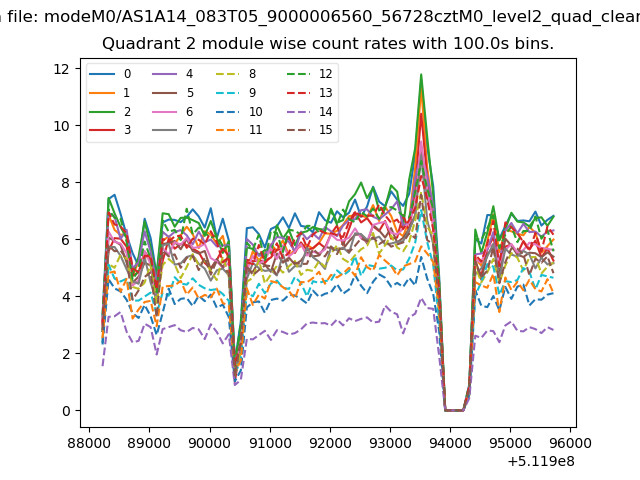
| Module-wise count rates for Quadrant B Data is divided into 100 sec bins |
 |
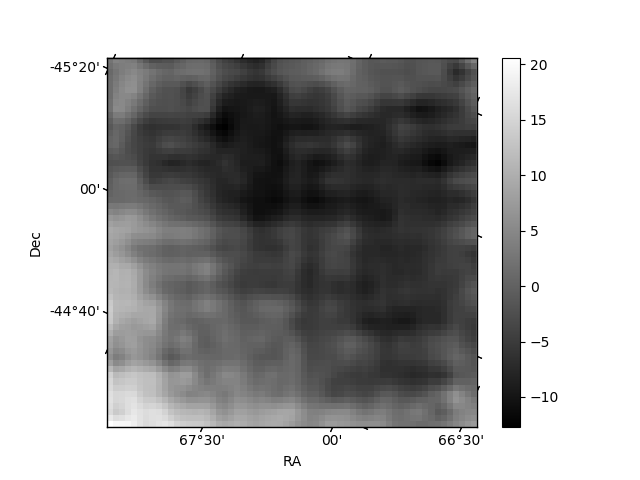 |
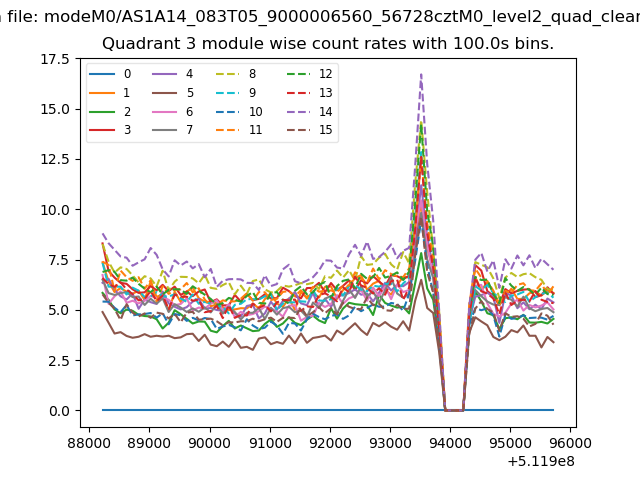
| Module-wise count rates for Quadrant C Data is divided into 100 sec bins |
 |
 |
| Module-wise count rates for Quadrant D Data is divided into 100 sec bins |
 |
 |
| Parameter | Plot |
|---|---|
| CZT HV Monitor | 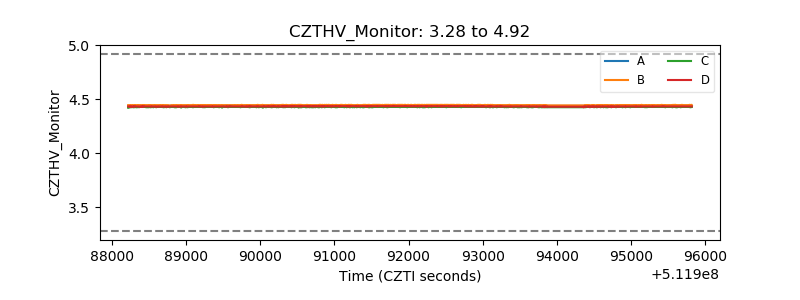 |
| D_VDD | 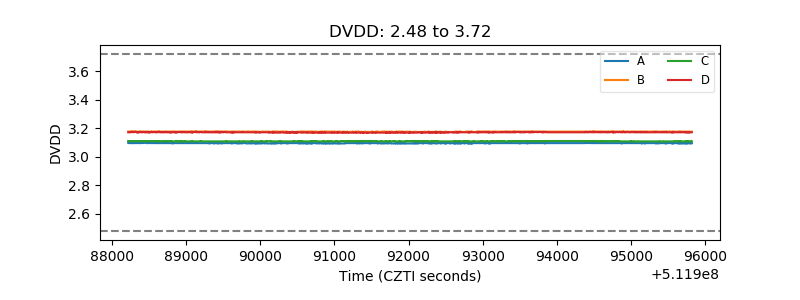 |
| Temperature 1 | 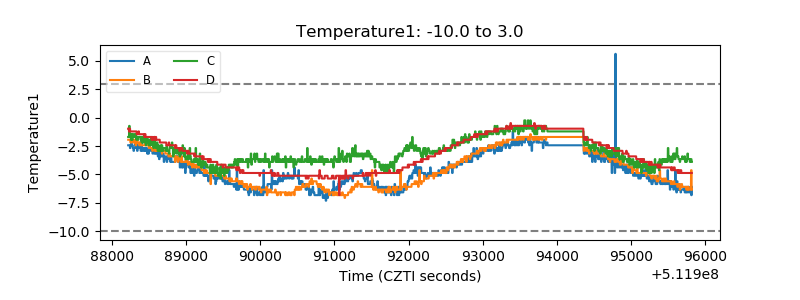 |
| Veto HV Monitor | 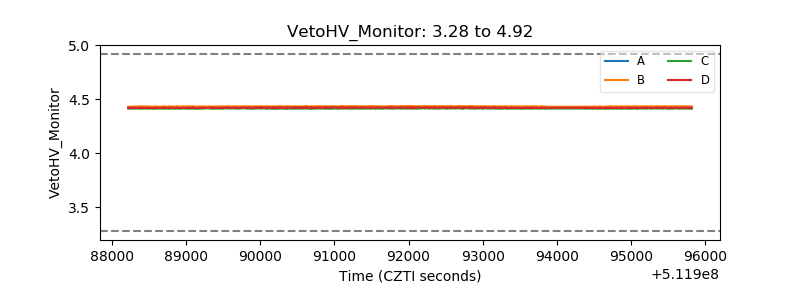 |
| Veto LLD | 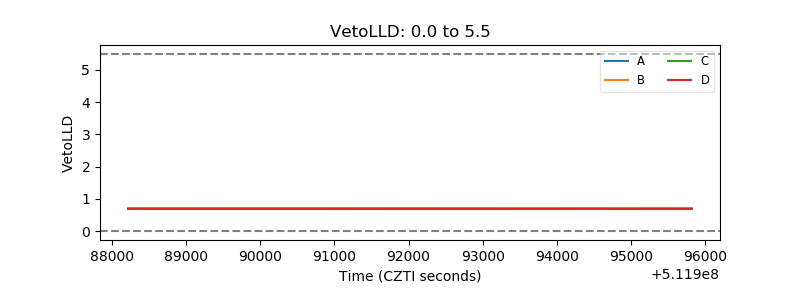 |
| Alpha Counter | 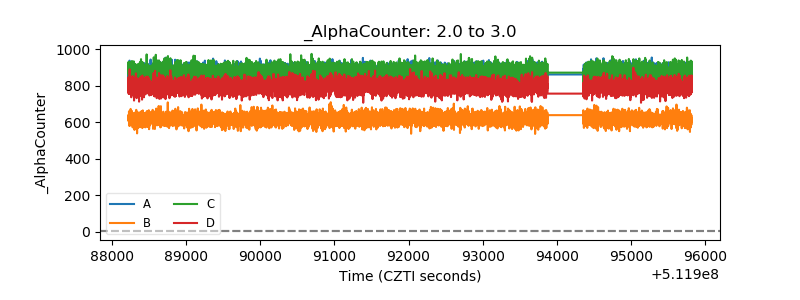 |
| _CPM_Rate | 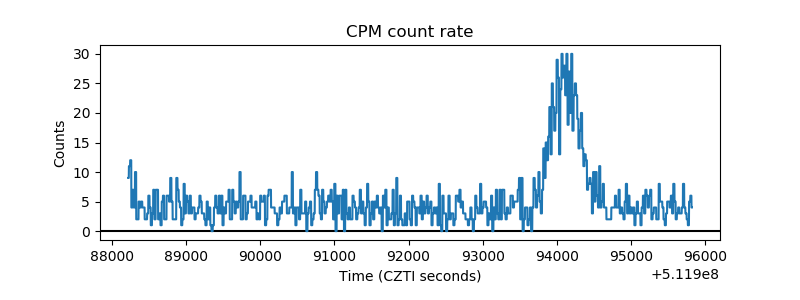 |
| CZT Counter | 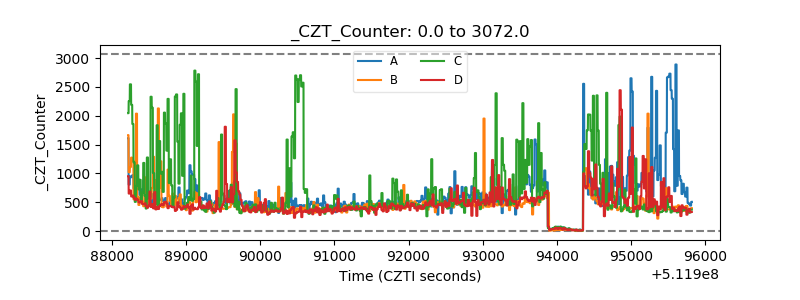 |
| +2.5 Volts monitor |  |
| +5 Volts monitor |  |
| _ROLL_ROT | 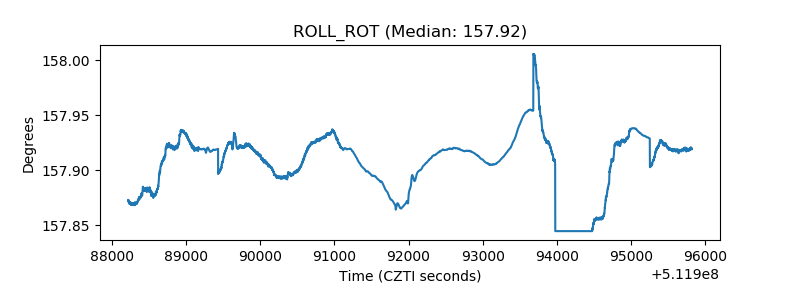 |
| _Roll_DEC | 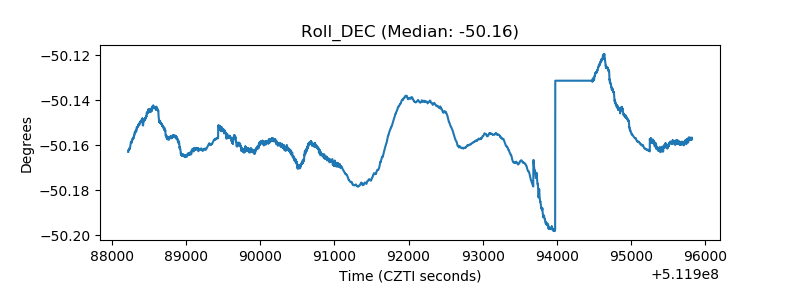 |
| _Roll_RA | 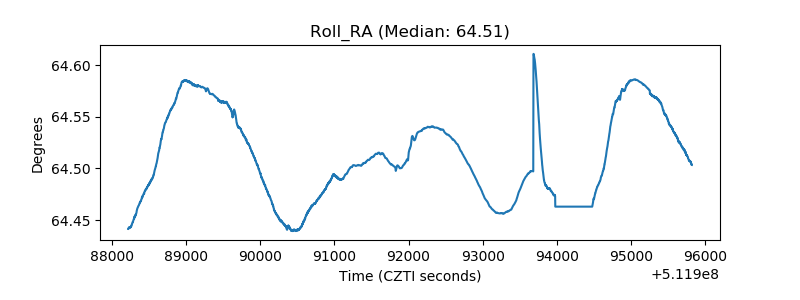 |
| Veto Counter | 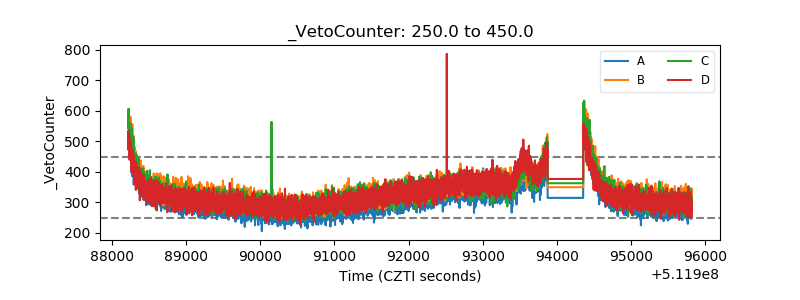 |