| Param | Original file | Final file |
|---|---|---|
| Filename | modeM0/AS1A14_083T05_9000006560_56729cztM0_level2.fits | modeM0/AS1A14_083T05_9000006560_56729cztM0_level2_quad_clean.evt |
| Size (bytes) | 497,347,200 | 108,904,320 |
| Size | 474.3 MB | 103.9 MB |
| Events in quadrant A | 5,547,444 | 689,535 |
| Events in quadrant B | 3,847,178 | 774,895 |
| Events in quadrant C | 4,573,369 | 661,861 |
| Events in quadrant D | 3,848,885 | 640,136 |
| Mode SS | |||
|---|---|---|---|
| Quadrant | BADHDUFLAG | Total packets | Discarded packets |
| A | 0 | 152 | 0 |
| B | 0 | 152 | 0 |
| C | 0 | 152 | 0 |
| D | 0 | 152 | 0 |
| Mode M0 | |||
|---|---|---|---|
| Quadrant | BADHDUFLAG | Total packets | Discarded packets |
| A | 0 | 21736 | 1 |
| B | 0 | 17081 | 0 |
| C | 0 | 19306 | 0 |
| D | 0 | 17229 | 0 |
| Quadrant | Total seconds | Saturated seconds | Saturation percentage |
|---|---|---|---|
| A | 7635 | 438 | 5.736739% |
| B | 7636 | 61 | 0.798848% |
| C | 7636 | 297 | 3.889471% |
| D | 7636 | 42 | 0.550026% |
Noise dominated data is calculated using 1-second bins in cleaned event files. If a bin has >2000 counts, and if more than 50% of those come from <1% of pixels, then it is considered to be noise-dominated and hence unusable.
| Quadrant | # 1 sec bins | Bins with >0 counts | Bins with >2000 counts | High rate bins dominated by noise | Noise dominated (total time) | Noise dominated (detector-on time) | Marked lightcurve |
|---|---|---|---|---|---|---|---|
| A | 7635 | 7635 | 398 | 398 | 5.21% | 5.21% | 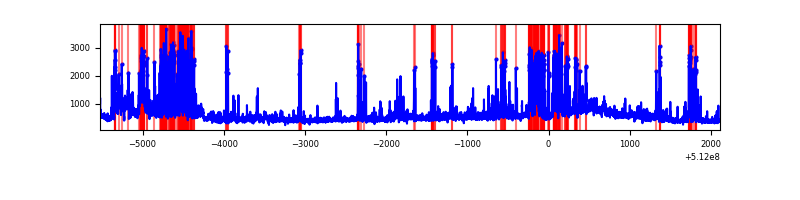 |
| B | 7636 | 7636 | 30 | 30 | 0.39% | 0.39% | 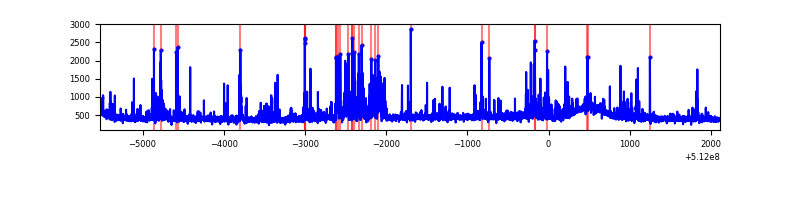 |
| C | 7636 | 7636 | 261 | 261 | 3.42% | 3.42% | 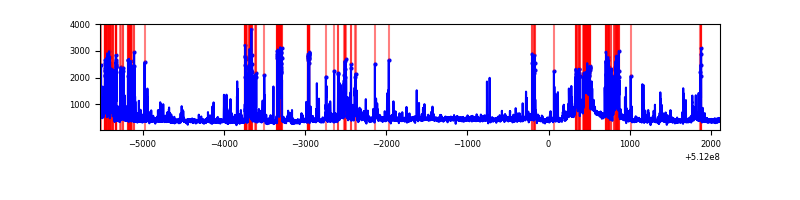 |
| D | 7636 | 7636 | 47 | 47 | 0.62% | 0.62% | 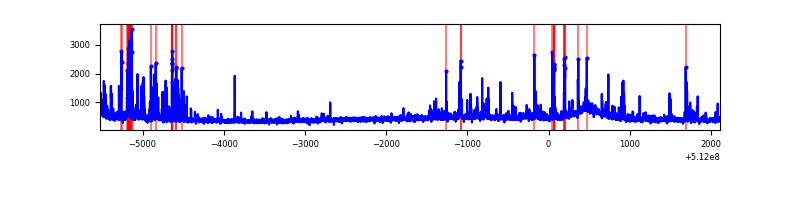 |
Top three noisy pixels from each quadrant. If the there are fewer than three noisy pixels in the level2.evt file, extra rows are filled as -1
| Pixel properties | Quadrant properties | ||||||
|---|---|---|---|---|---|---|---|
| Quadrant | DetID | PixID | Counts | Sigma | Mean | Median | Sigma |
| A | 3 | 14 | 851173 | 4289.01 | 805 | 785 | 198.3 |
| A | 3 | 62 | 807571 | 4069.1 | 805 | 785 | 198.3 |
| A | 10 | 251 | 687681 | 3464.42 | 805 | 785 | 198.3 |
| B | 5 | 185 | 314926 | 1759.11 | 818 | 785 | 178.6 |
| B | 4 | 206 | 112449 | 625.29 | 818 | 785 | 178.6 |
| B | 10 | 247 | 77585 | 430.06 | 818 | 785 | 178.6 |
| C | 15 | 208 | 525323 | 2431.17 | 781 | 773 | 215.8 |
| C | 13 | 3 | 459752 | 2127.26 | 781 | 773 | 215.8 |
| C | 6 | 223 | 225930 | 1043.55 | 781 | 773 | 215.8 |
| D | 2 | 207 | 274383 | 1228.26 | 789 | 754 | 222.8 |
| D | 2 | 249 | 151061 | 674.7 | 789 | 754 | 222.8 |
| D | 2 | 252 | 132941 | 593.36 | 789 | 754 | 222.8 |
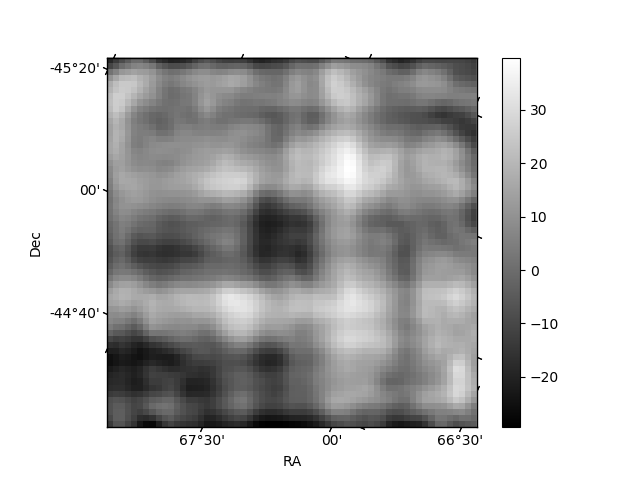
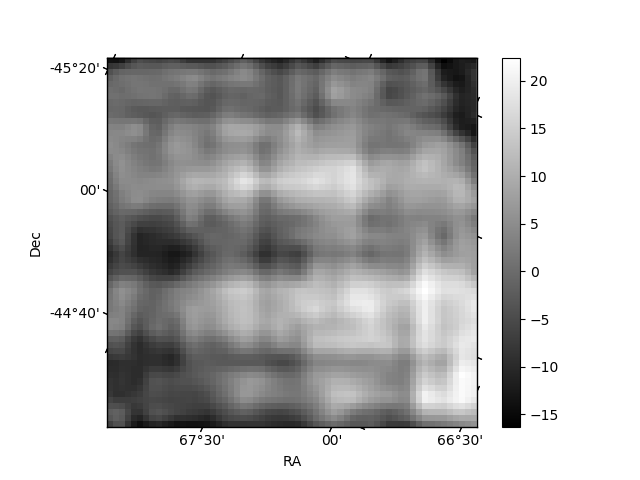
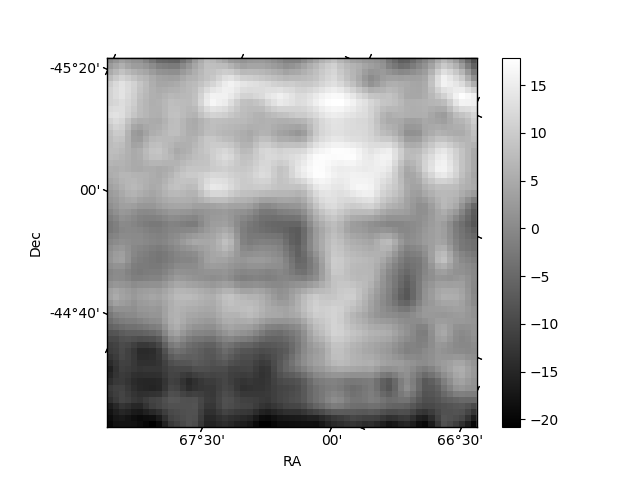
Histogram calculated using DETX and DETY for each event in the final _common_clean file
| Quadrant A | 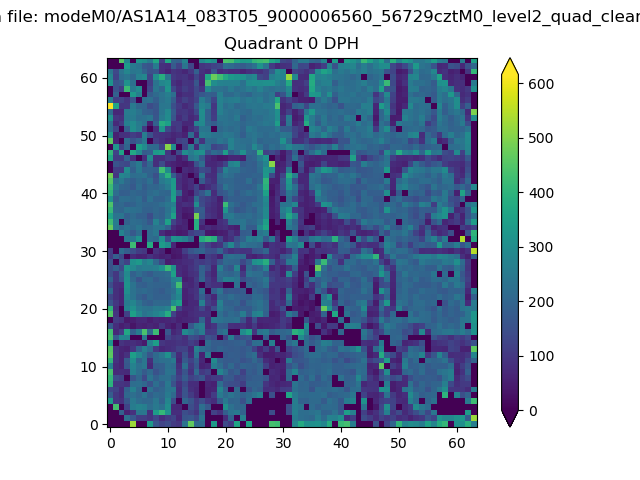 |
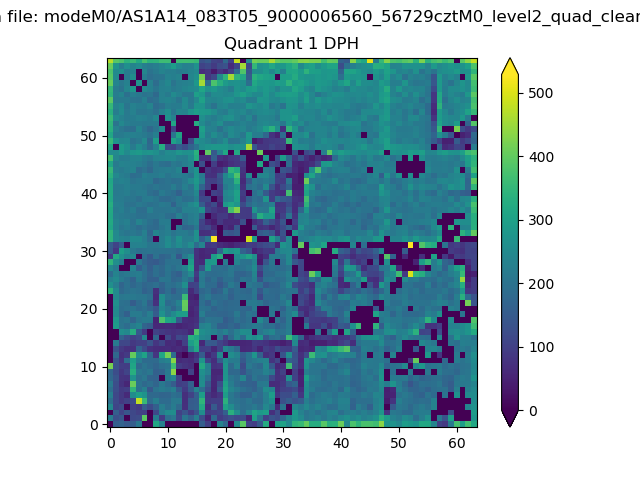 |
Quadrant B |
|---|---|---|---|
| Quadrant D | 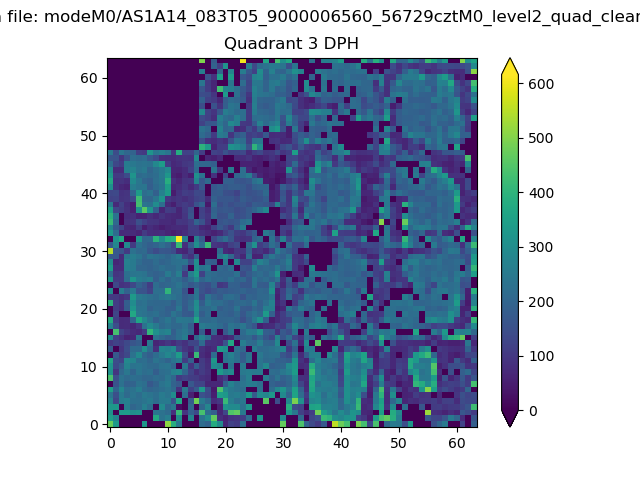 |
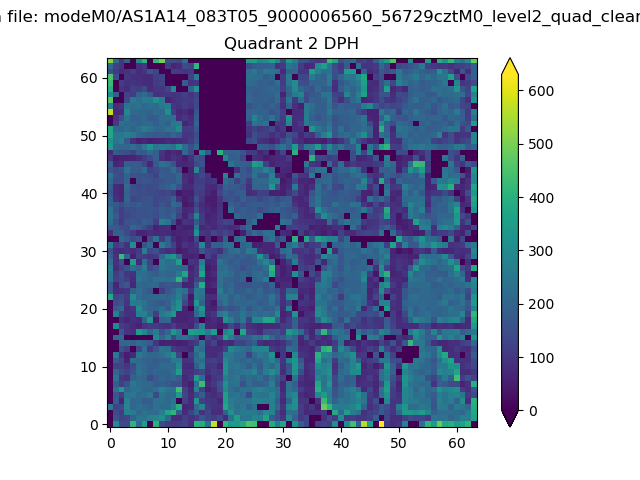 |
Quadrant C |
| Plot type | Count rate plots | Images |
|---|---|---|
| Comparison with Poisson distribution Blue bars denote a histogram of data divided into 1 sec bins. Red curve is a Poisson curve with rate = median count rate of data. |
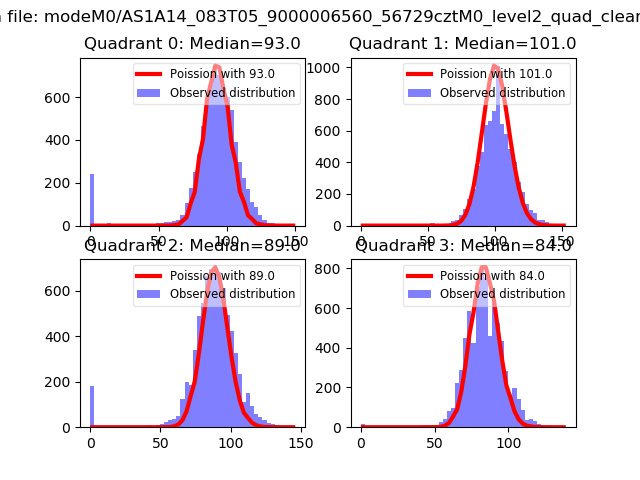 |
 |
| Quadrant-wise count rates Data is divided into 100 sec bins |
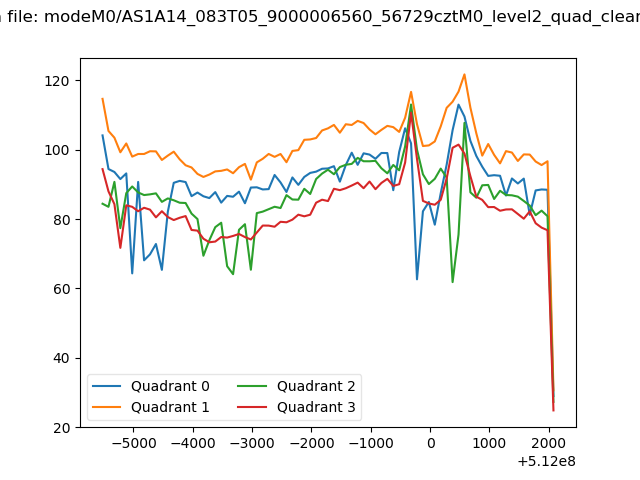 |
|
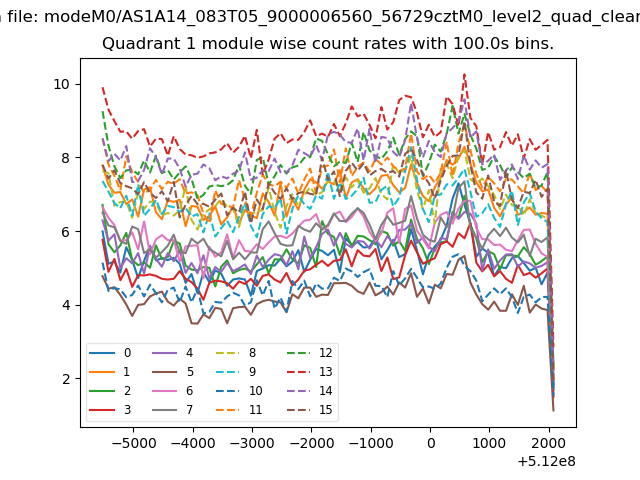
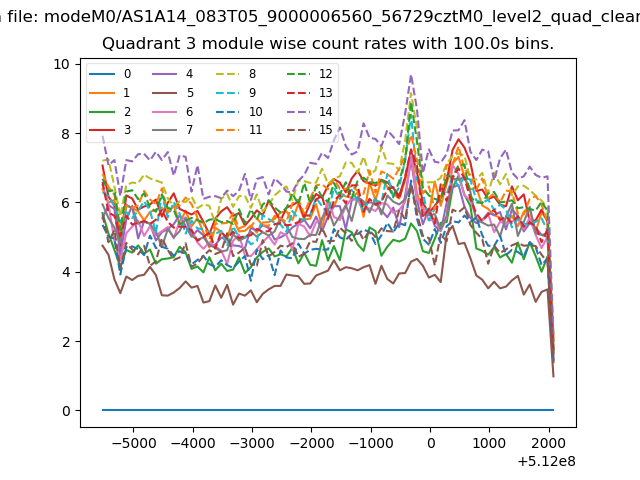
| Module-wise count rates for Quadrant A Data is divided into 100 sec bins |
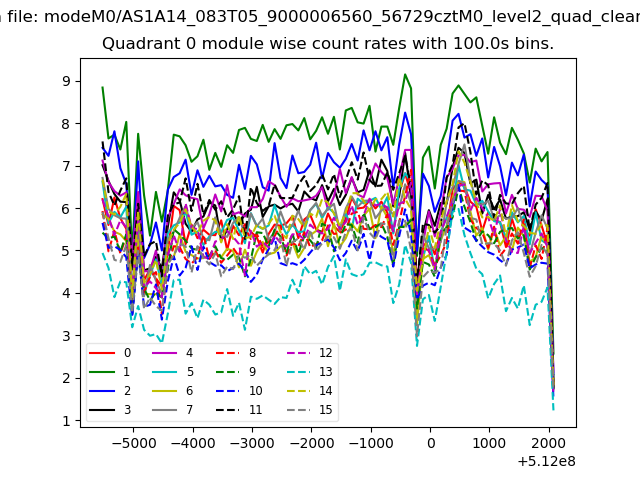 |
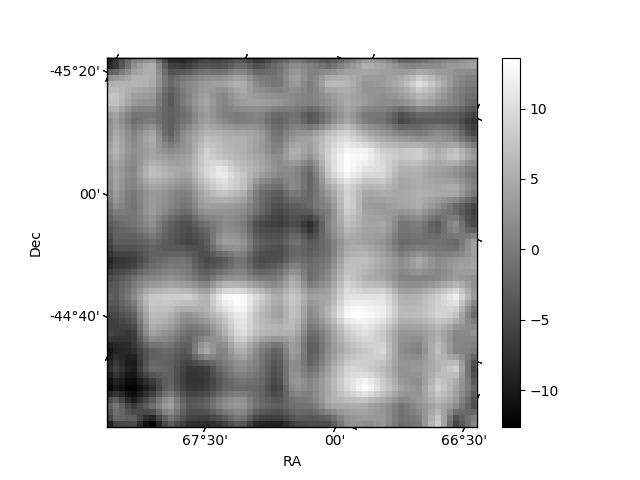 |
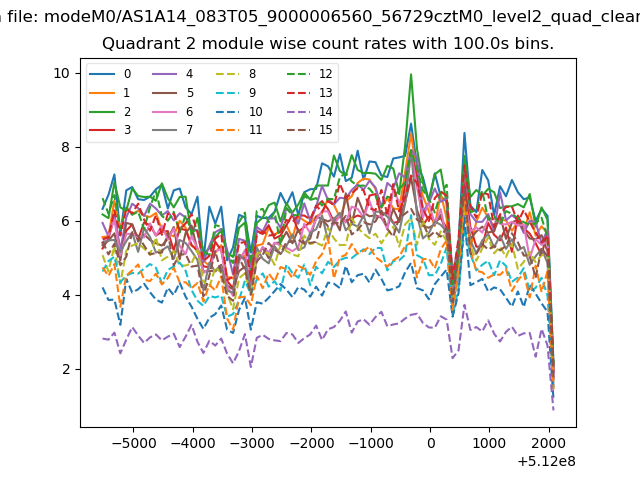
| Module-wise count rates for Quadrant B Data is divided into 100 sec bins |
 |
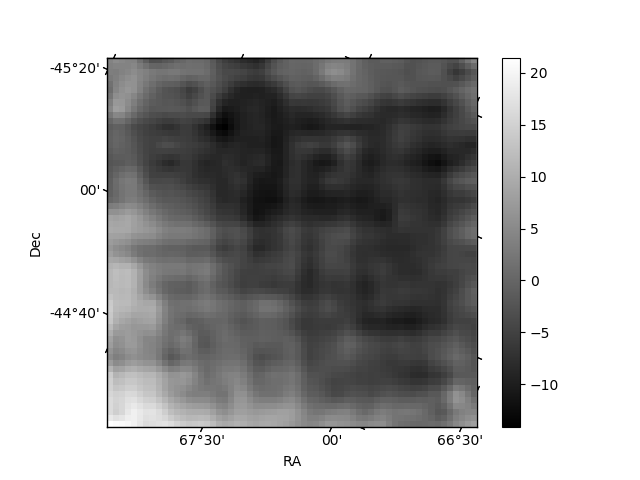 |
| Module-wise count rates for Quadrant C Data is divided into 100 sec bins |
 |
 |
| Module-wise count rates for Quadrant D Data is divided into 100 sec bins |
 |
 |
| Parameter | Plot |
|---|---|
| CZT HV Monitor | 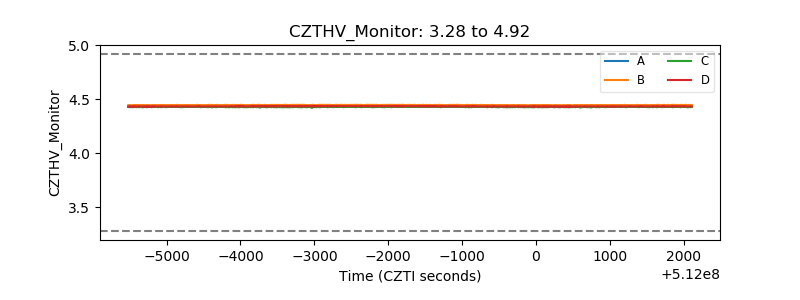 |
| D_VDD | 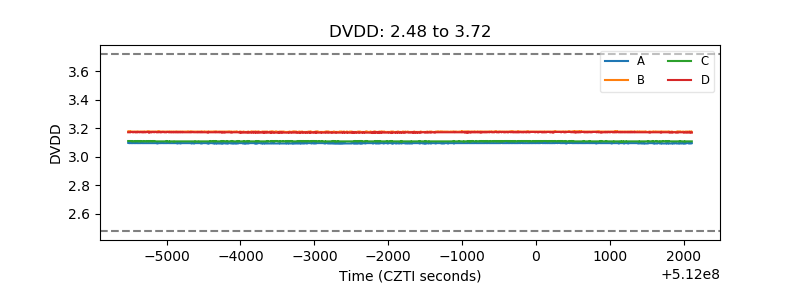 |
| Temperature 1 | 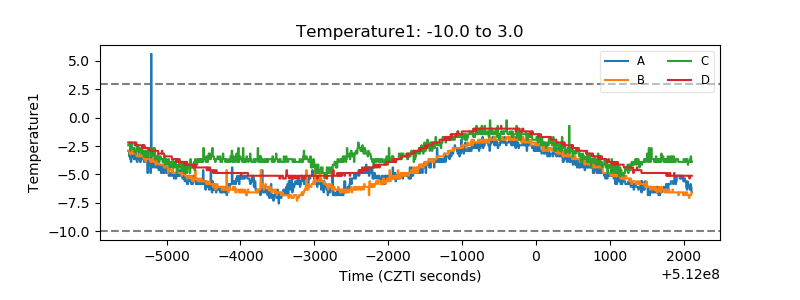 |
| Veto HV Monitor | 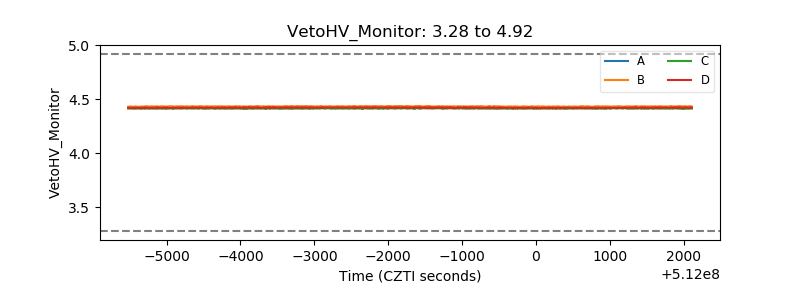 |
| Veto LLD | 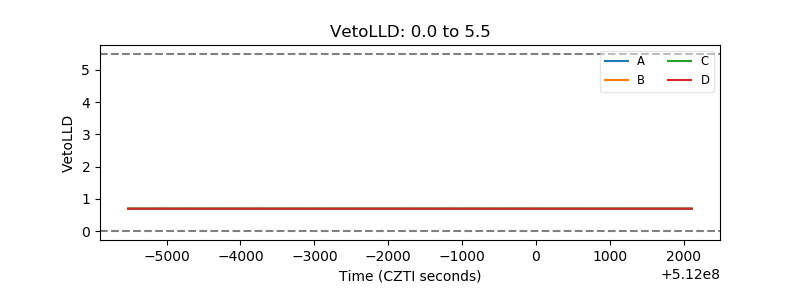 |
| Alpha Counter | 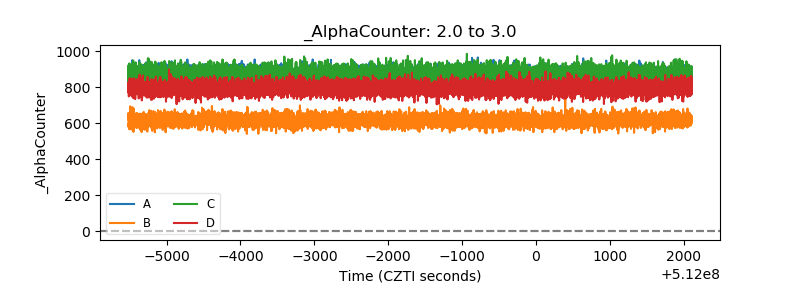 |
| _CPM_Rate | 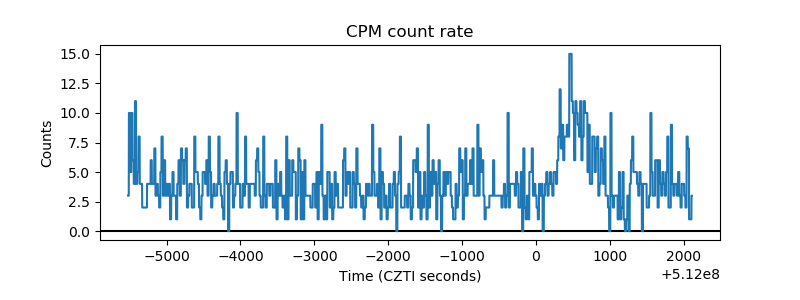 |
| CZT Counter | 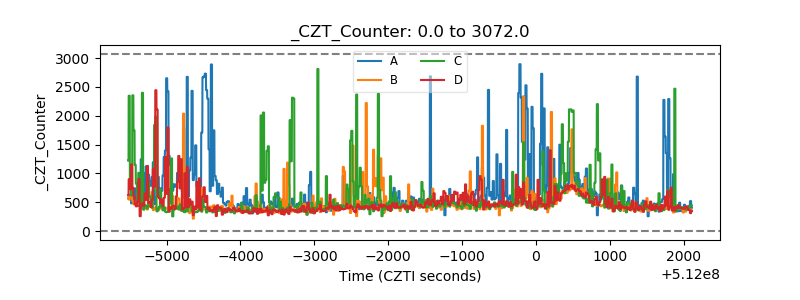 |
| +2.5 Volts monitor |  |
| +5 Volts monitor |  |
| _ROLL_ROT | 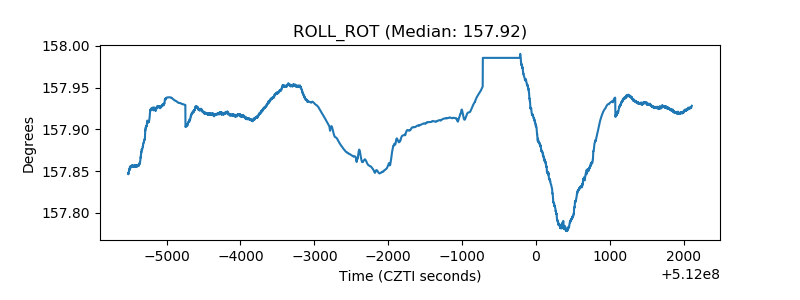 |
| _Roll_DEC | 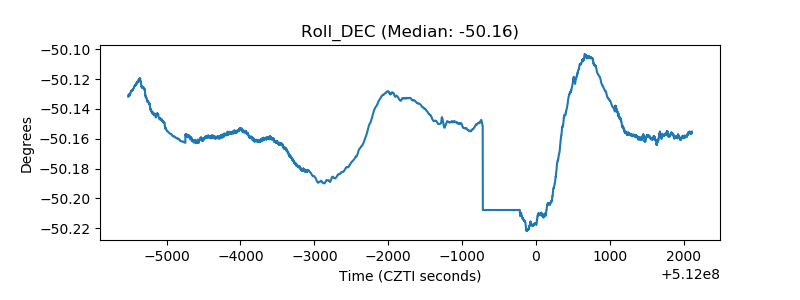 |
| _Roll_RA | 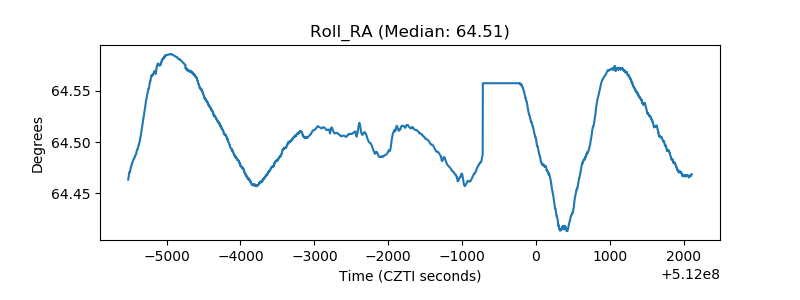 |
| Veto Counter | 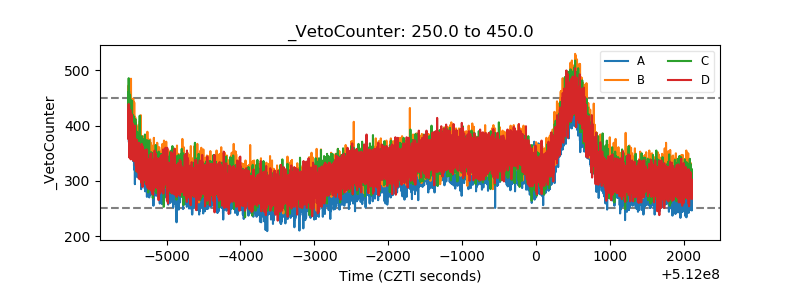 |