| Param | Original file | Final file |
|---|---|---|
| Filename | modeM0/AS1A14_083T05_9000006560_56730cztM0_level2.fits | modeM0/AS1A14_083T05_9000006560_56730cztM0_level2_quad_clean.evt |
| Size (bytes) | 551,430,720 | 124,286,400 |
| Size | 525.9 MB | 118.5 MB |
| Events in quadrant A | 5,994,108 | 795,823 |
| Events in quadrant B | 4,072,469 | 890,160 |
| Events in quadrant C | 5,098,146 | 739,494 |
| Events in quadrant D | 4,566,474 | 729,733 |
| Mode SS | |||
|---|---|---|---|
| Quadrant | BADHDUFLAG | Total packets | Discarded packets |
| A | 0 | 174 | 0 |
| B | 0 | 174 | 0 |
| C | 0 | 174 | 0 |
| D | 0 | 174 | 0 |
| Mode M0 | |||
|---|---|---|---|
| Quadrant | BADHDUFLAG | Total packets | Discarded packets |
| A | 0 | 24112 | 0 |
| B | 0 | 18809 | 0 |
| C | 0 | 21662 | 0 |
| D | 0 | 20101 | 0 |
| Quadrant | Total seconds | Saturated seconds | Saturation percentage |
|---|---|---|---|
| A | 8763 | 467 | 5.329225% |
| B | 8763 | 59 | 0.673285% |
| C | 8764 | 523 | 5.967595% |
| D | 8764 | 122 | 1.392058% |
Noise dominated data is calculated using 1-second bins in cleaned event files. If a bin has >2000 counts, and if more than 50% of those come from <1% of pixels, then it is considered to be noise-dominated and hence unusable.
| Quadrant | # 1 sec bins | Bins with >0 counts | Bins with >2000 counts | High rate bins dominated by noise | Noise dominated (total time) | Noise dominated (detector-on time) | Marked lightcurve |
|---|---|---|---|---|---|---|---|
| A | 8763 | 8763 | 388 | 388 | 4.43% | 4.43% | 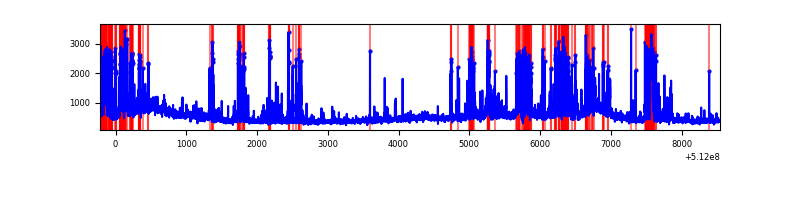 |
| B | 8763 | 8763 | 18 | 18 | 0.21% | 0.21% | 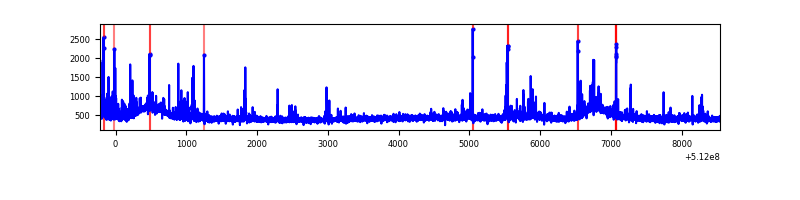 |
| C | 8764 | 8764 | 201 | 201 | 2.29% | 2.29% | 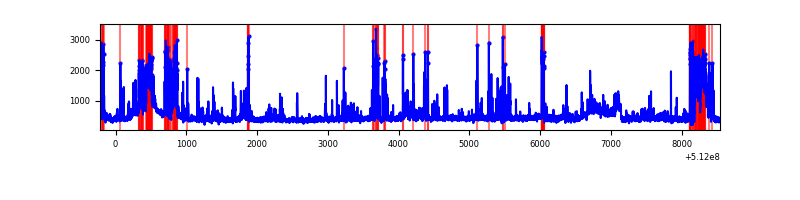 |
| D | 8764 | 8764 | 104 | 104 | 1.19% | 1.19% | 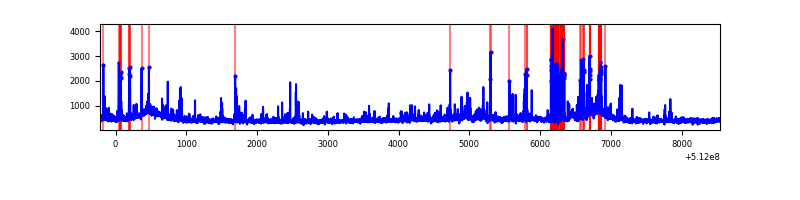 |
Top three noisy pixels from each quadrant. If the there are fewer than three noisy pixels in the level2.evt file, extra rows are filled as -1
| Pixel properties | Quadrant properties | ||||||
|---|---|---|---|---|---|---|---|
| Quadrant | DetID | PixID | Counts | Sigma | Mean | Median | Sigma |
| A | 3 | 62 | 1382039 | 5931.53 | 939 | 913 | 232.8 |
| A | 3 | 14 | 673121 | 2886.94 | 939 | 913 | 232.8 |
| A | 10 | 251 | 253170 | 1083.37 | 939 | 913 | 232.8 |
| B | 4 | 206 | 102945 | 490.1 | 953 | 916 | 208.2 |
| B | 10 | 247 | 63331 | 299.82 | 953 | 916 | 208.2 |
| B | 7 | 252 | 37492 | 175.7 | 953 | 916 | 208.2 |
| C | 13 | 3 | 939765 | 3869.52 | 890 | 883 | 242.6 |
| C | 15 | 208 | 300800 | 1236.08 | 890 | 883 | 242.6 |
| C | 15 | 230 | 78154 | 318.47 | 890 | 883 | 242.6 |
| D | 2 | 249 | 420179 | 1641.5 | 915 | 876 | 255.4 |
| D | 2 | 207 | 148873 | 579.38 | 915 | 876 | 255.4 |
| D | 2 | 252 | 147792 | 575.15 | 915 | 876 | 255.4 |
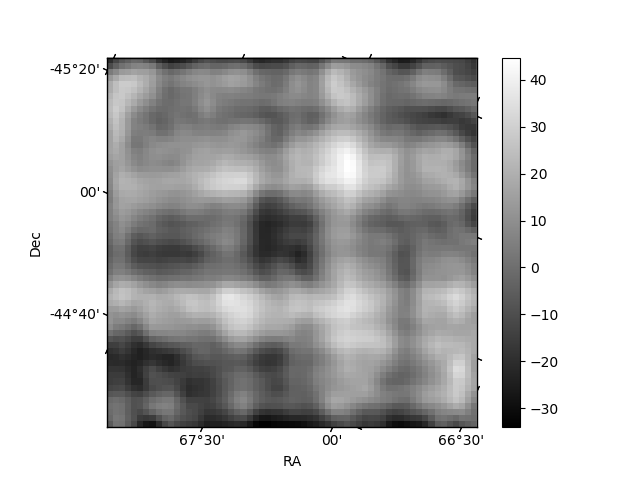
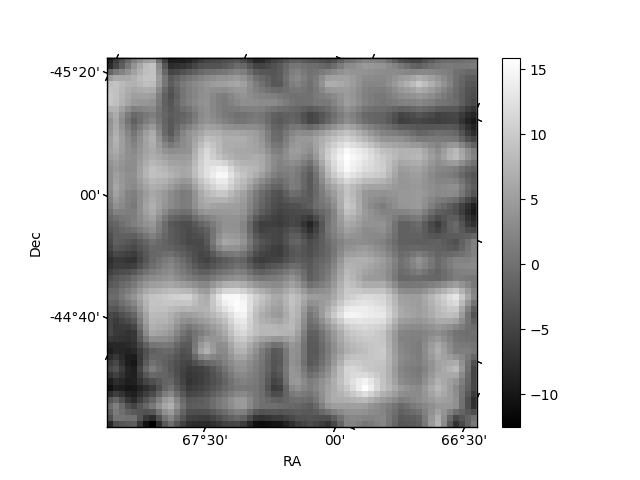
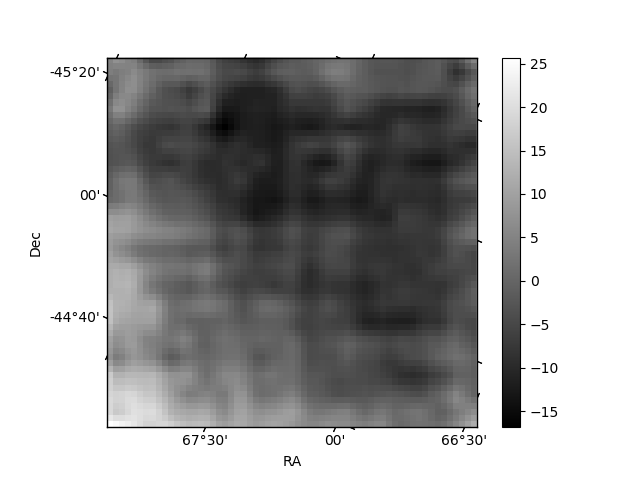
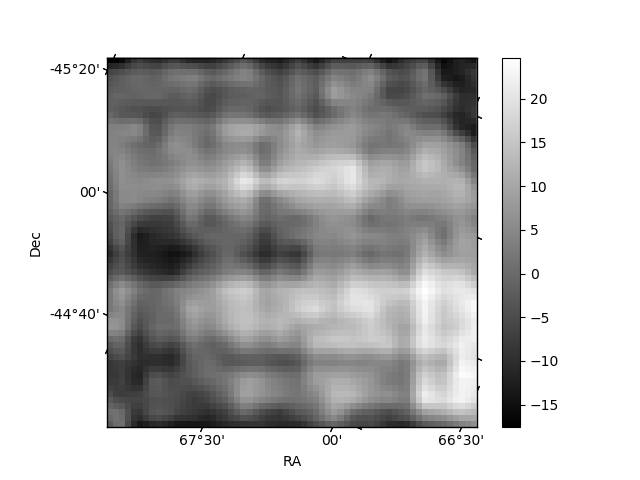
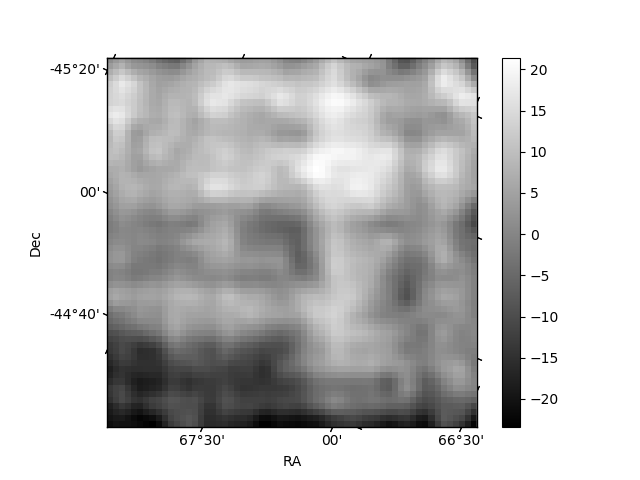
Histogram calculated using DETX and DETY for each event in the final _common_clean file
| Quadrant A | 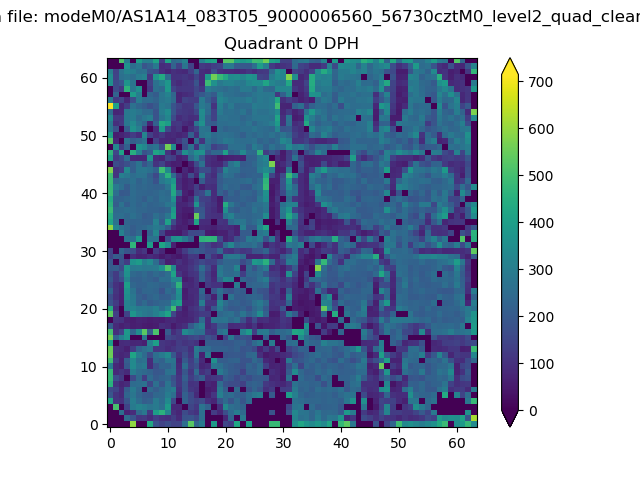 |
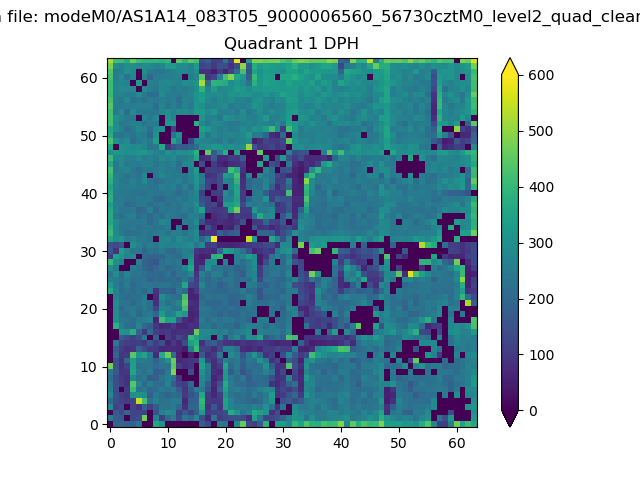 |
Quadrant B |
|---|---|---|---|
| Quadrant D | 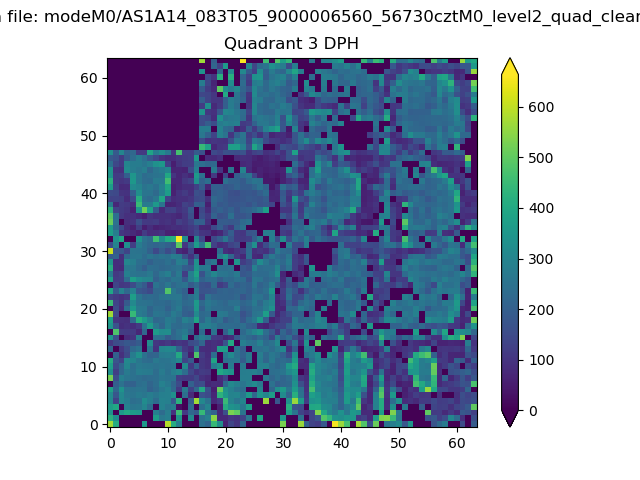 |
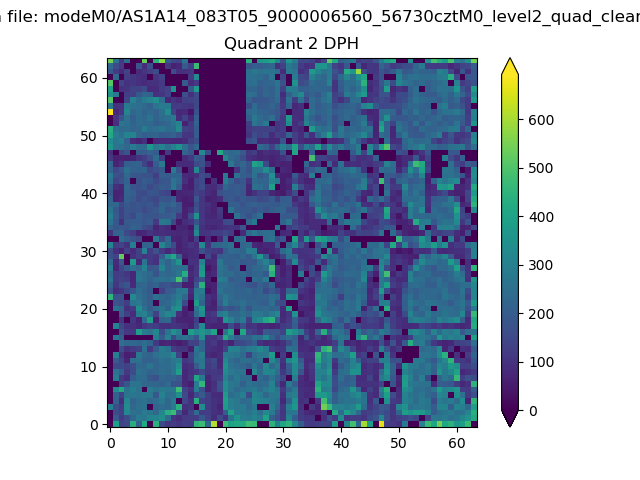 |
Quadrant C |
| Plot type | Count rate plots | Images |
|---|---|---|
| Comparison with Poisson distribution Blue bars denote a histogram of data divided into 1 sec bins. Red curve is a Poisson curve with rate = median count rate of data. |
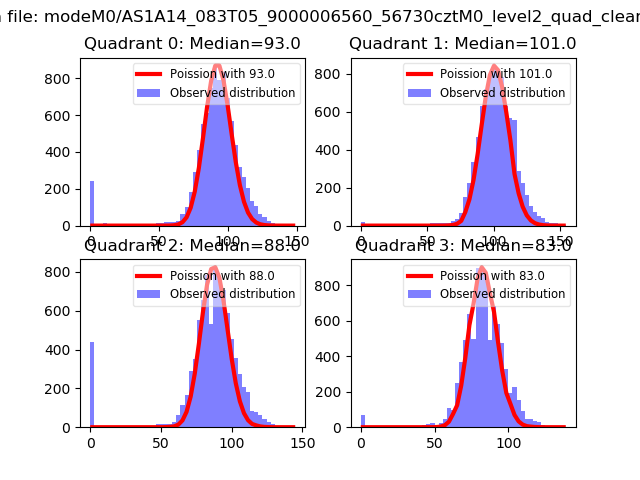 |
 |
| Quadrant-wise count rates Data is divided into 100 sec bins |
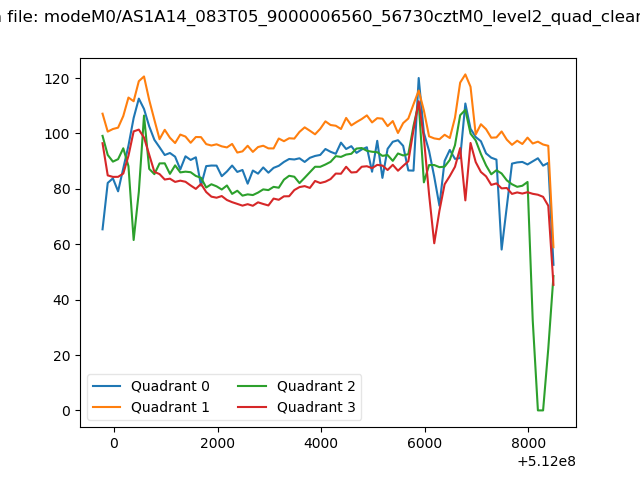 |
|
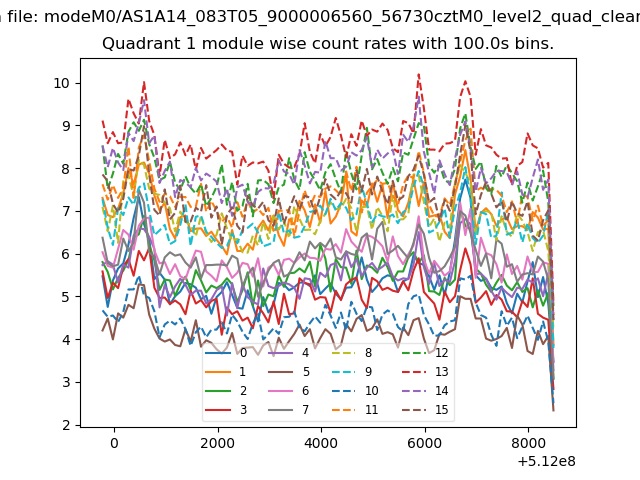
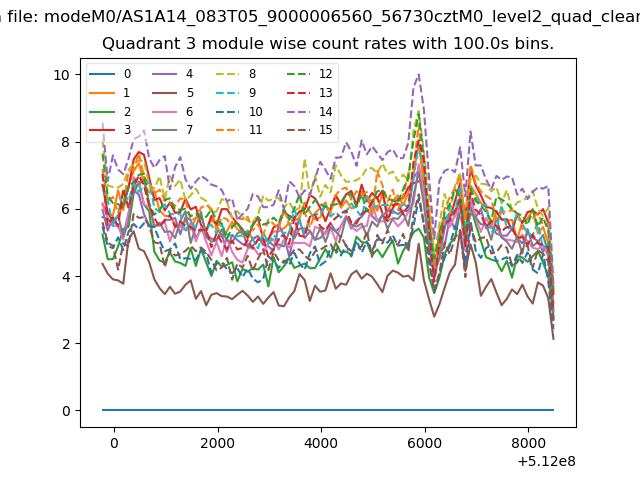
| Module-wise count rates for Quadrant A Data is divided into 100 sec bins |
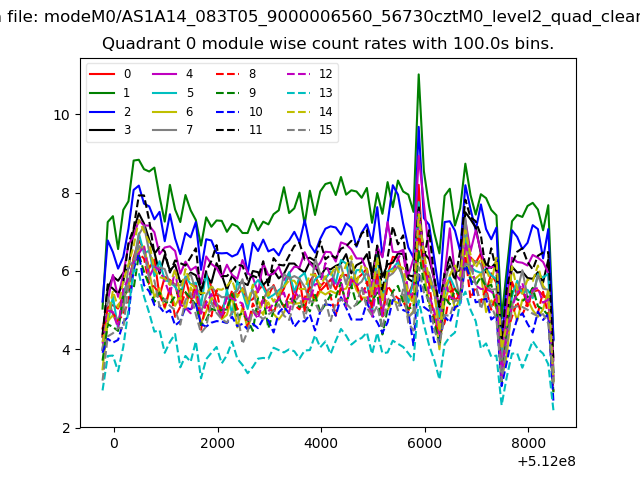 |
 |
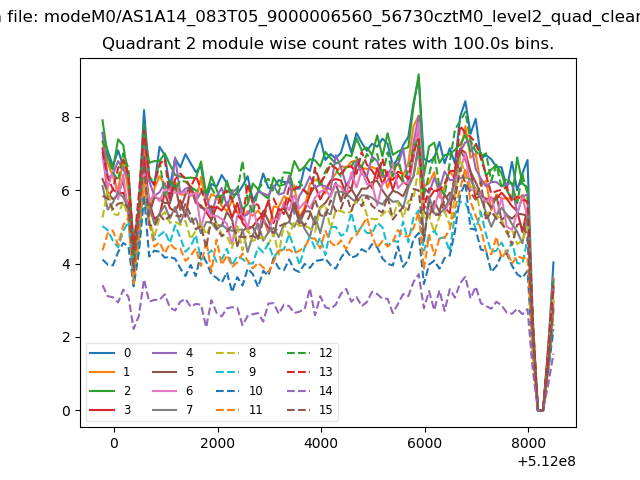
| Module-wise count rates for Quadrant B Data is divided into 100 sec bins |
 |
 |
| Module-wise count rates for Quadrant C Data is divided into 100 sec bins |
 |
 |
| Module-wise count rates for Quadrant D Data is divided into 100 sec bins |
 |
 |
| Parameter | Plot |
|---|---|
| CZT HV Monitor | 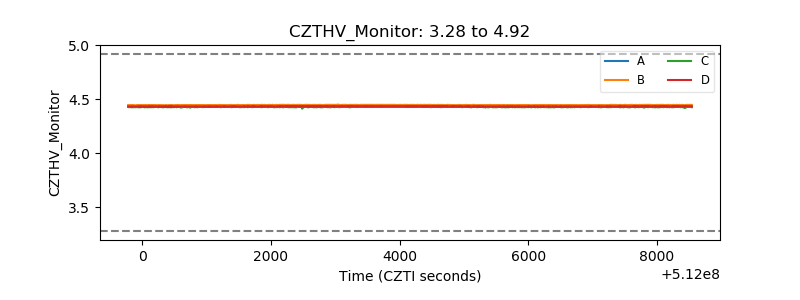 |
| D_VDD | 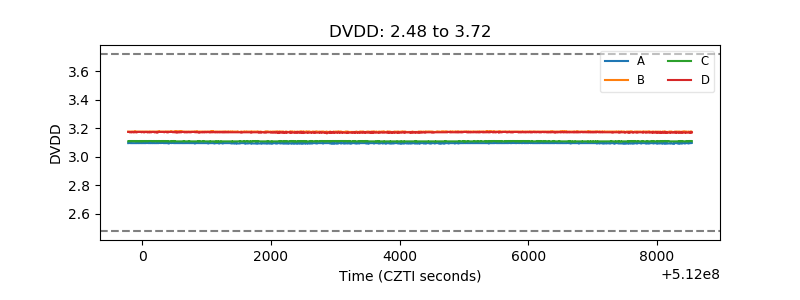 |
| Temperature 1 | 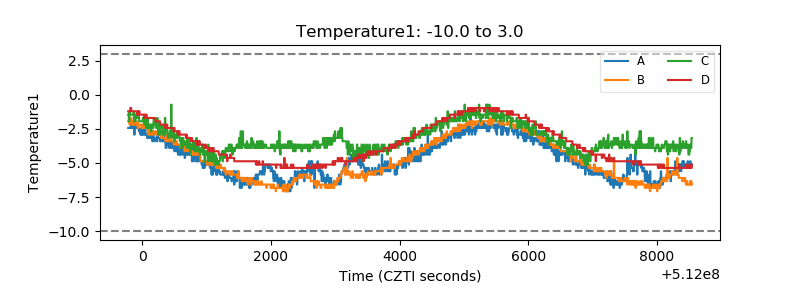 |
| Veto HV Monitor | 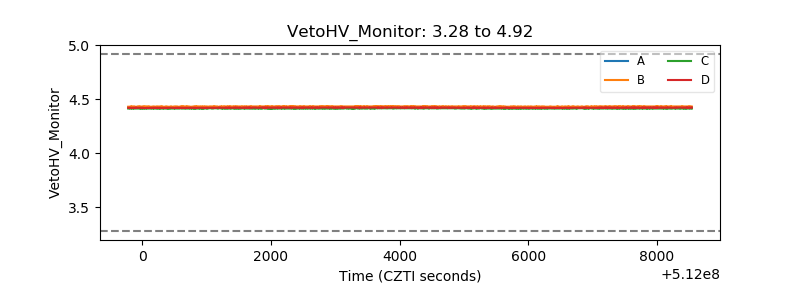 |
| Veto LLD | 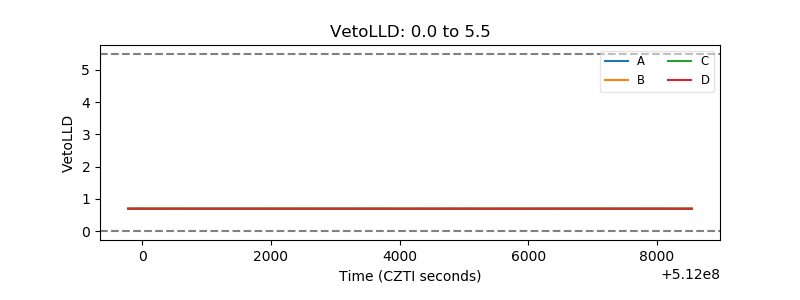 |
| Alpha Counter | 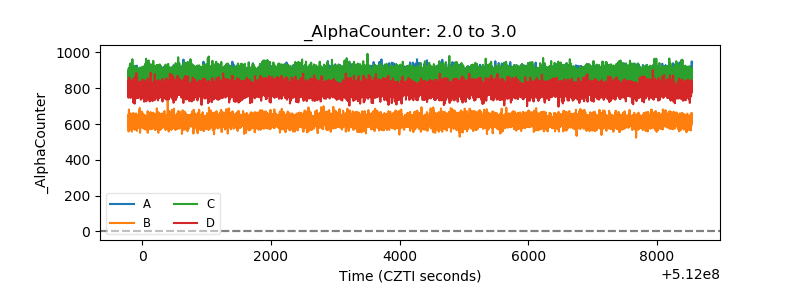 |
| _CPM_Rate | 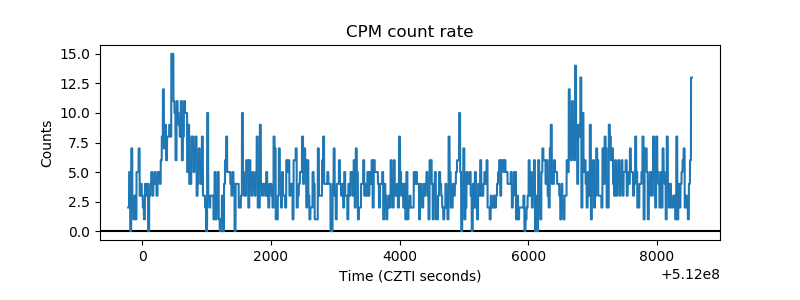 |
| CZT Counter | 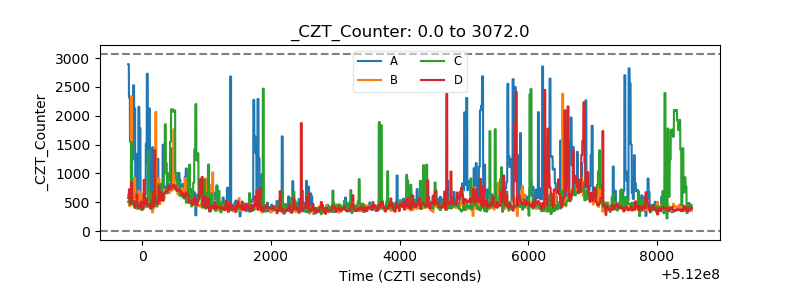 |
| +2.5 Volts monitor |  |
| +5 Volts monitor |  |
| _ROLL_ROT | 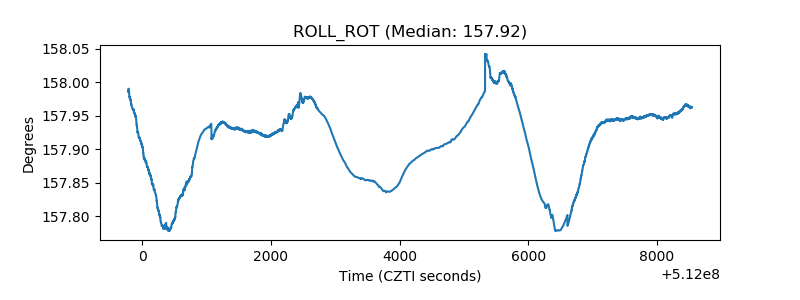 |
| _Roll_DEC | 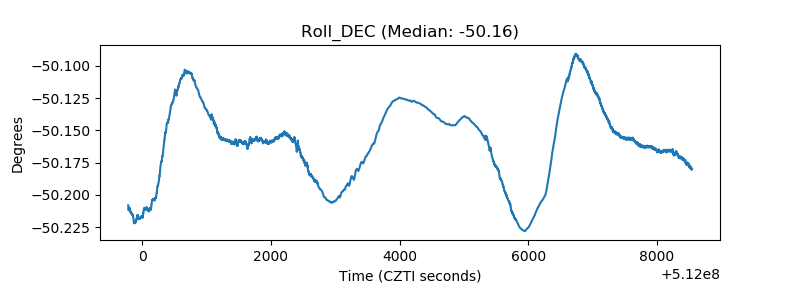 |
| _Roll_RA | 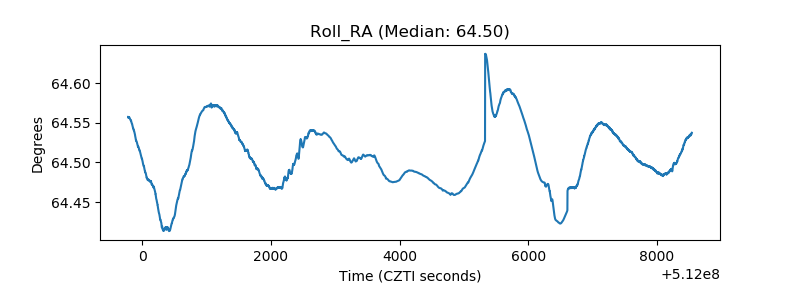 |
| Veto Counter | 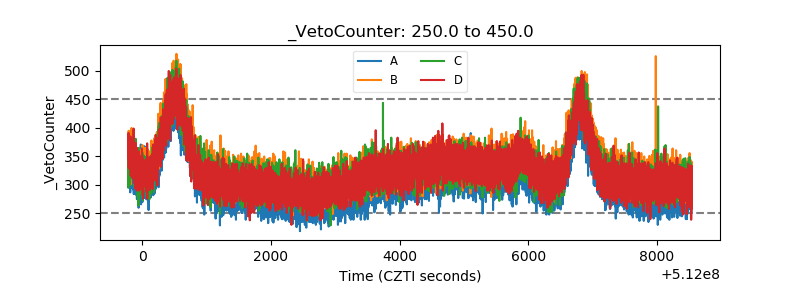 |