| Param | Original file | Final file |
|---|---|---|
| Filename | modeM0/AS1A14_083T05_9000006560_56733cztM0_level2.fits | modeM0/AS1A14_083T05_9000006560_56733cztM0_level2_quad_clean.evt |
| Size (bytes) | 656,861,760 | 136,247,040 |
| Size | 626.4 MB | 129.9 MB |
| Events in quadrant A | 6,444,261 | 884,652 |
| Events in quadrant B | 4,892,248 | 973,033 |
| Events in quadrant C | 7,328,705 | 787,332 |
| Events in quadrant D | 4,893,263 | 804,207 |
| Mode SS | |||
|---|---|---|---|
| Quadrant | BADHDUFLAG | Total packets | Discarded packets |
| A | 0 | 196 | 0 |
| B | 0 | 196 | 0 |
| C | 0 | 196 | 0 |
| D | 0 | 196 | 0 |
| Mode M0 | |||
|---|---|---|---|
| Quadrant | BADHDUFLAG | Total packets | Discarded packets |
| A | 0 | 25700 | 0 |
| B | 0 | 21879 | 0 |
| C | 0 | 28764 | 3 |
| D | 0 | 21830 | 0 |
| Quadrant | Total seconds | Saturated seconds | Saturation percentage |
|---|---|---|---|
| A | 9746 | 418 | 4.288939% |
| B | 9747 | 254 | 2.605930% |
| C | 9745 | 1054 | 10.815803% |
| D | 9747 | 157 | 1.610752% |
Noise dominated data is calculated using 1-second bins in cleaned event files. If a bin has >2000 counts, and if more than 50% of those come from <1% of pixels, then it is considered to be noise-dominated and hence unusable.
| Quadrant | # 1 sec bins | Bins with >0 counts | Bins with >2000 counts | High rate bins dominated by noise | Noise dominated (total time) | Noise dominated (detector-on time) | Marked lightcurve |
|---|---|---|---|---|---|---|---|
| A | 9746 | 9746 | 308 | 308 | 3.16% | 3.16% | 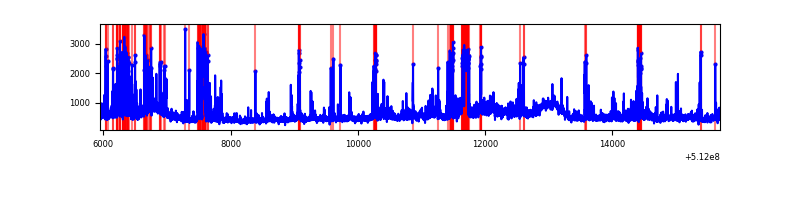 |
| B | 9747 | 9747 | 50 | 50 | 0.51% | 0.51% | 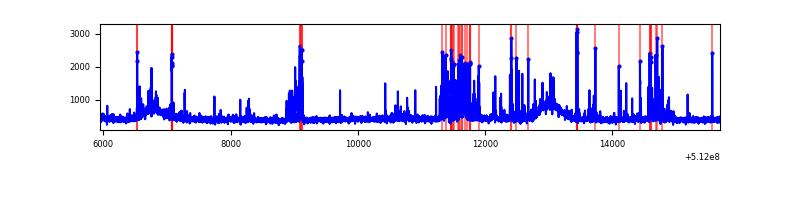 |
| C | 9747 | 9746 | 691 | 691 | 7.09% | 7.09% | 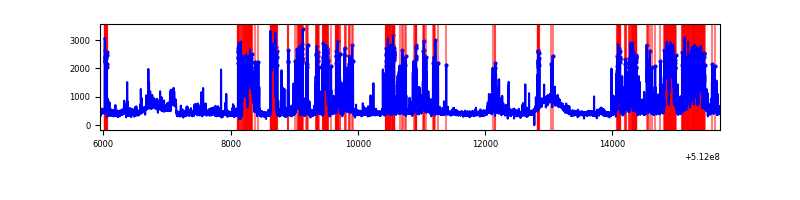 |
| D | 9747 | 9747 | 106 | 106 | 1.09% | 1.09% | 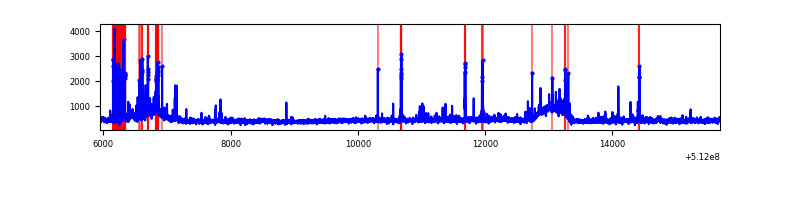 |
Top three noisy pixels from each quadrant. If the there are fewer than three noisy pixels in the level2.evt file, extra rows are filled as -1
| Pixel properties | Quadrant properties | ||||||
|---|---|---|---|---|---|---|---|
| Quadrant | DetID | PixID | Counts | Sigma | Mean | Median | Sigma |
| A | 3 | 14 | 933279 | 3585.17 | 1051 | 1023 | 260.0 |
| A | 3 | 62 | 702293 | 2696.87 | 1051 | 1023 | 260.0 |
| A | 10 | 251 | 575565 | 2209.51 | 1051 | 1023 | 260.0 |
| B | 4 | 206 | 345861 | 1490.51 | 1062 | 1020 | 231.4 |
| B | 8 | 128 | 164060 | 704.71 | 1062 | 1020 | 231.4 |
| B | 10 | 247 | 73915 | 315.07 | 1062 | 1020 | 231.4 |
| C | 15 | 230 | 1837559 | 6856.25 | 985 | 978 | 267.9 |
| C | 13 | 3 | 1135432 | 4235.1 | 985 | 978 | 267.9 |
| C | 12 | 252 | 133778 | 495.76 | 985 | 978 | 267.9 |
| D | 2 | 249 | 265268 | 919.81 | 1030 | 984 | 287.3 |
| D | 2 | 207 | 177355 | 613.84 | 1030 | 984 | 287.3 |
| D | 2 | 252 | 114955 | 396.66 | 1030 | 984 | 287.3 |
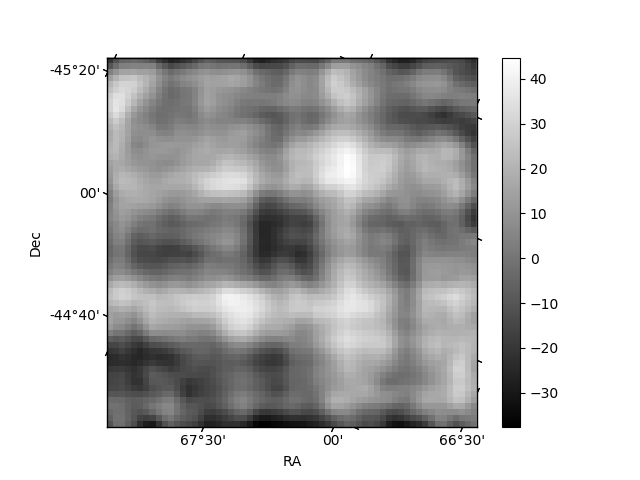
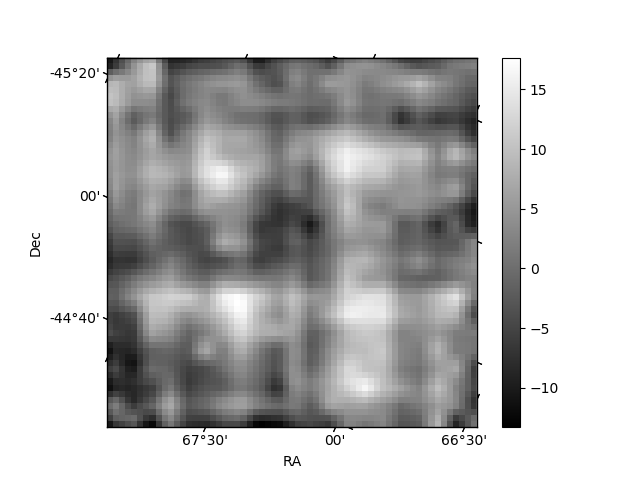
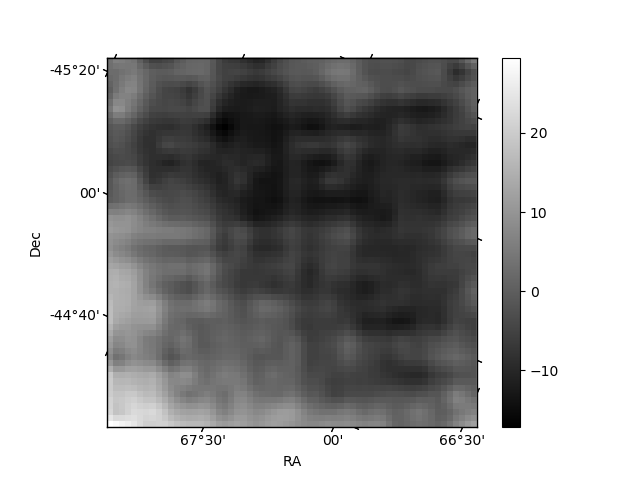
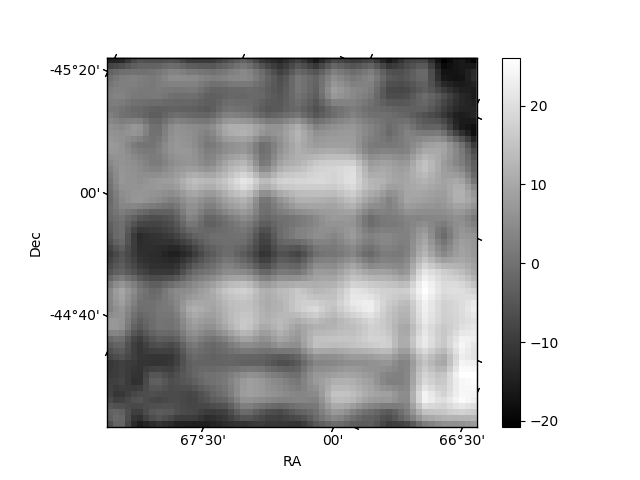
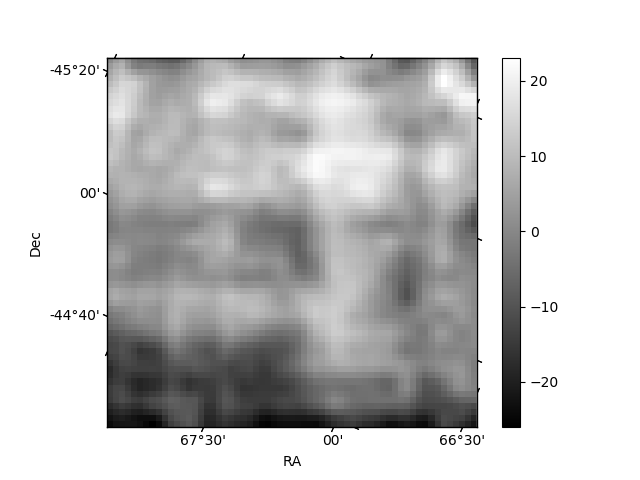
Histogram calculated using DETX and DETY for each event in the final _common_clean file
| Quadrant A | 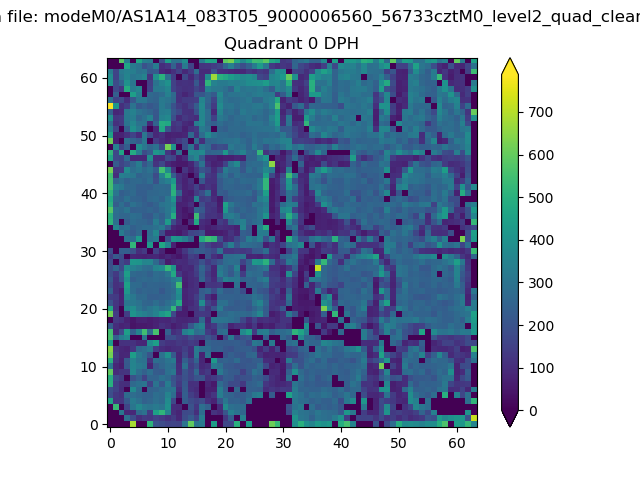 |
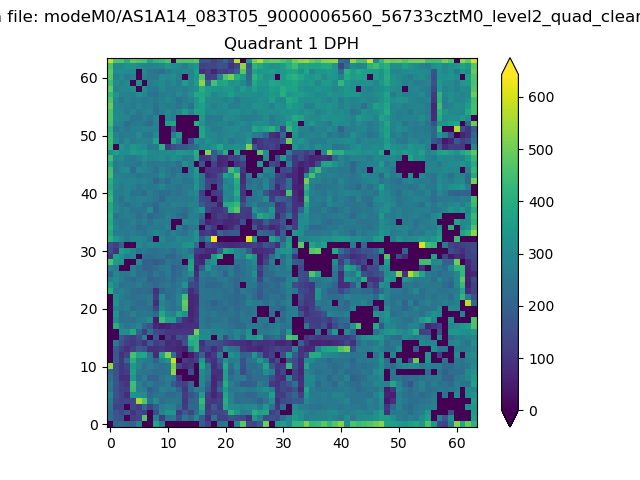 |
Quadrant B |
|---|---|---|---|
| Quadrant D | 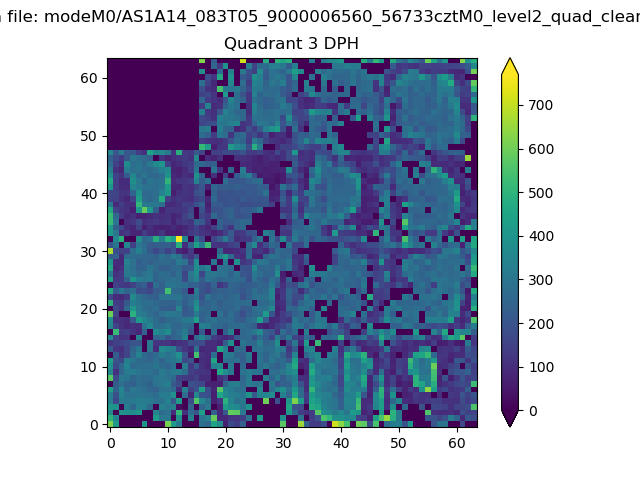 |
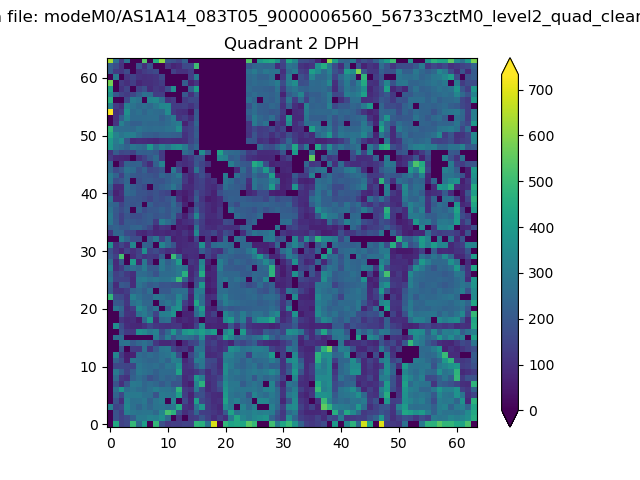 |
Quadrant C |
| Plot type | Count rate plots | Images |
|---|---|---|
| Comparison with Poisson distribution Blue bars denote a histogram of data divided into 1 sec bins. Red curve is a Poisson curve with rate = median count rate of data. |
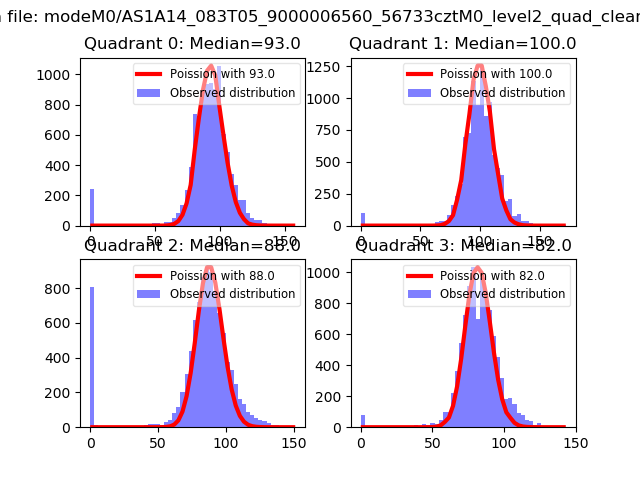 |
 |
| Quadrant-wise count rates Data is divided into 100 sec bins |
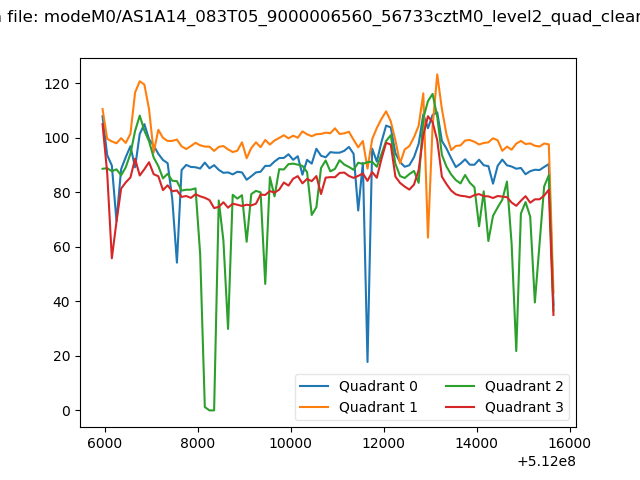 |
|
| Module-wise count rates for Quadrant A Data is divided into 100 sec bins |
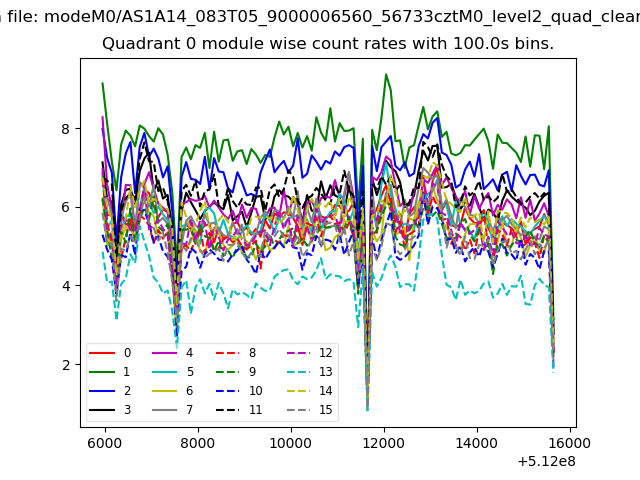 |
 |
| Module-wise count rates for Quadrant B Data is divided into 100 sec bins |
 |
 |
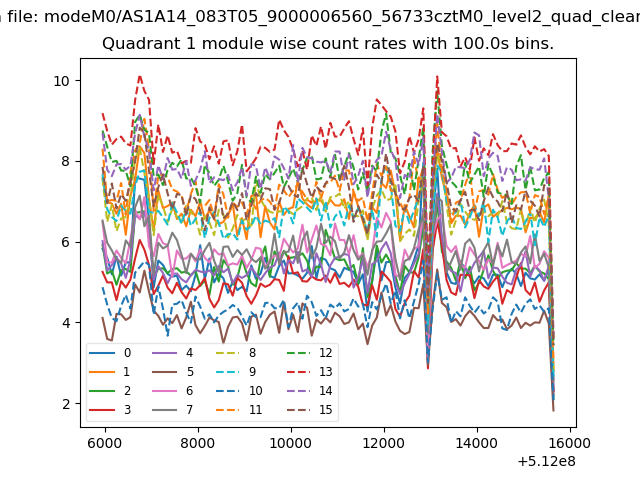
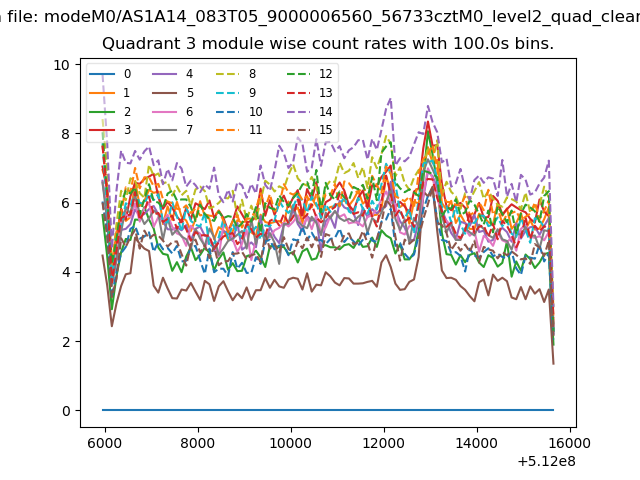
| Module-wise count rates for Quadrant C Data is divided into 100 sec bins |
 |
 |
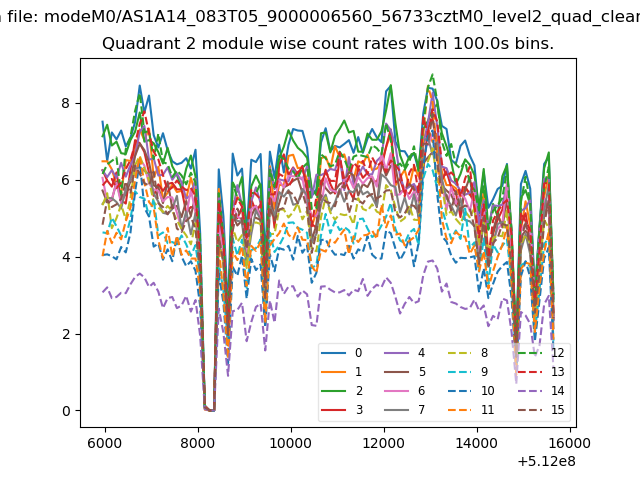
| Module-wise count rates for Quadrant D Data is divided into 100 sec bins |
 |
 |
| Parameter | Plot |
|---|---|
| CZT HV Monitor | 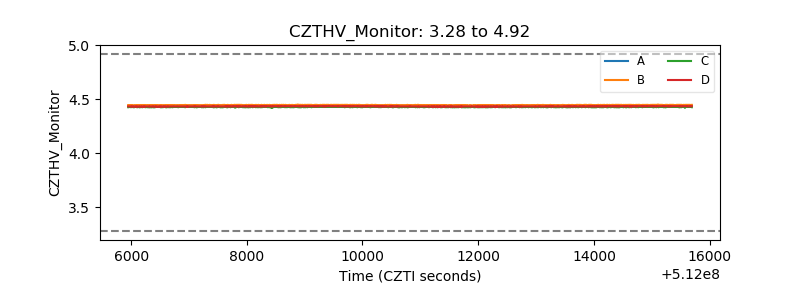 |
| D_VDD | 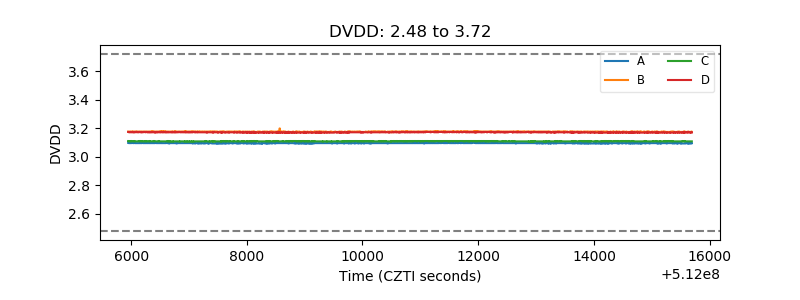 |
| Temperature 1 | 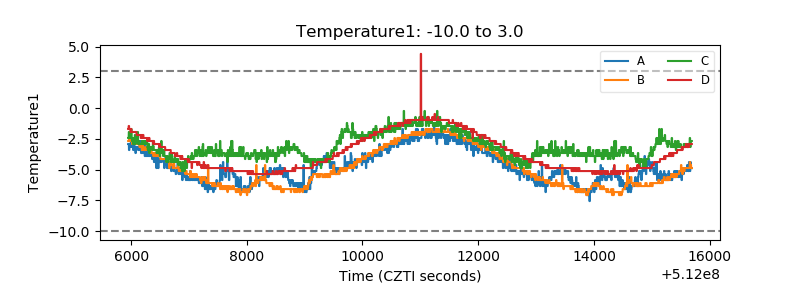 |
| Veto HV Monitor | 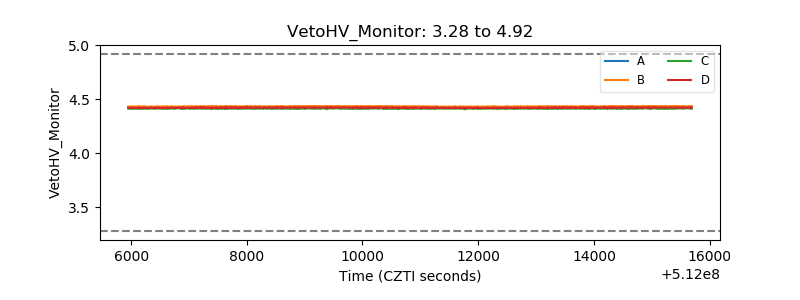 |
| Veto LLD | 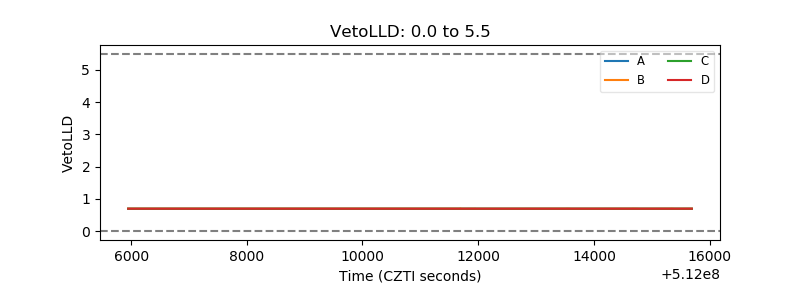 |
| Alpha Counter | 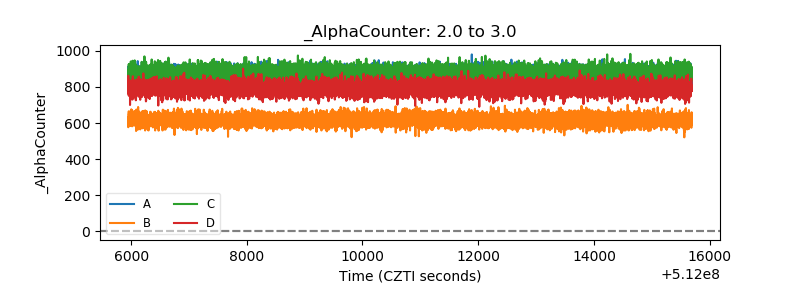 |
| _CPM_Rate | 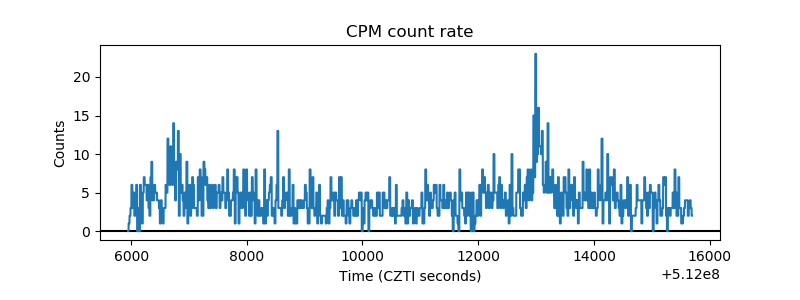 |
| CZT Counter | 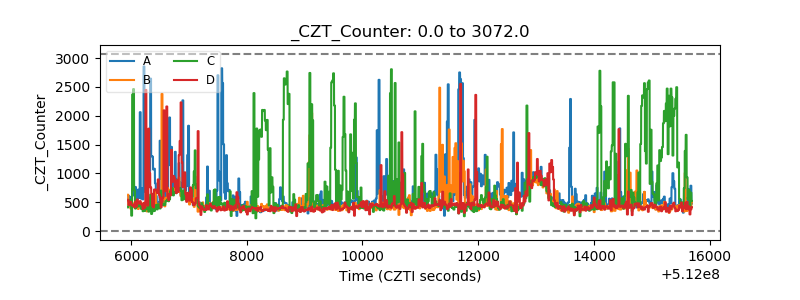 |
| +2.5 Volts monitor |  |
| +5 Volts monitor |  |
| _ROLL_ROT | 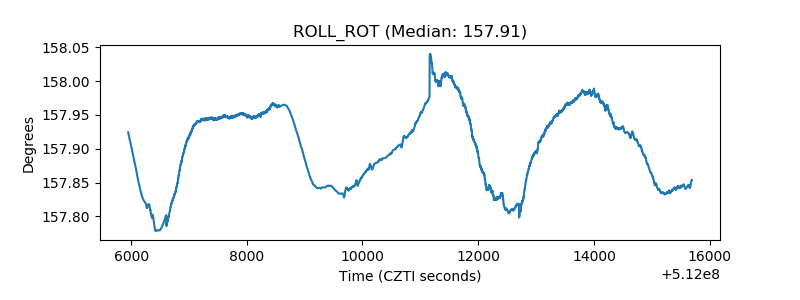 |
| _Roll_DEC | 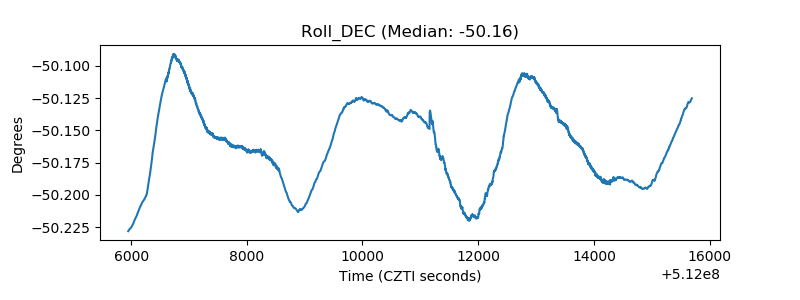 |
| _Roll_RA | 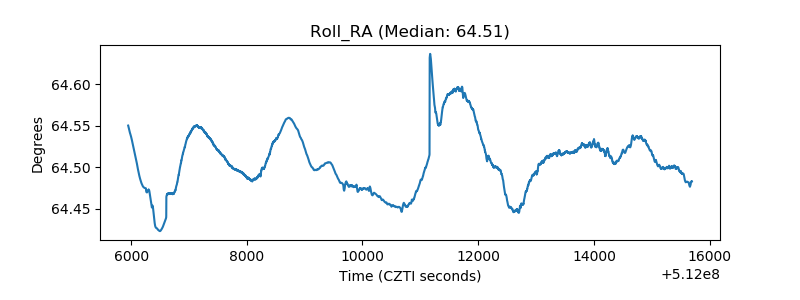 |
| Veto Counter | 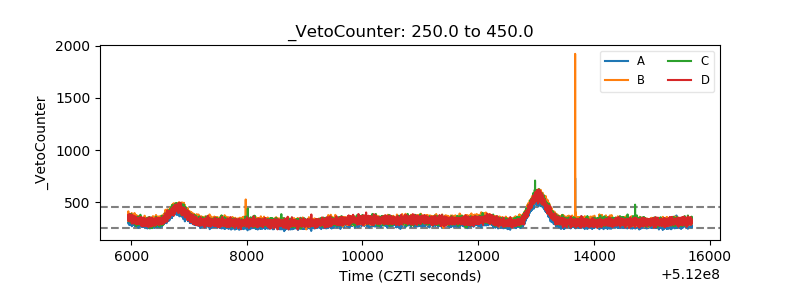 |